MIA / Melanoma-derived growth regulatory protein · Western blot design guide

Design a Western Blot for MIA

Real validated MIA Western blot protocols, expected-band and isoform facts, troubleshooting for weak or shifted signal, and recommended anti-MIA WB antibodies. Everything you need to plan the experiment before you commit precious samples.

Evidence assembled September 2026 · For research use; verify linked source records and product datasheet before use
Western blot protocol sheet for MIA: expected band ~14.5 kDa, hero antibody A01570, catalog values and labelled standard workflow; separate PMC comparisons on the guide
Printable MIA Western blot protocol sheet — expected band ~14.5 kDa, antibody A01570, controls and PMC citations. Open the full MIA WB guide →

MIA Western Blot Experimental Design Guide

Expected bands, validated protocols, controls and antibodies — the at-a-glance facts below, then the full design guide.

Must know before running
Expected band ~14.5 kDa
Gel 15% (standard starting point)
Positive control ⓘ Hippocampus (IHC candidate; verify WB) +1 more
Negative control ⓘ Adipose tissue (IHC candidate; verify WB)
Important caveats
Reasons your observed band may differ from the expected size.
PTM Cleaved
Caveat Secreted protein
Gene-set association MSigDB C7 membership
Isoform 2 isoform(s)
Section 1

Real Curated MIA Western Blot Protocols

The A01570 protocol combines labelled catalog values with standard starting conditions. Published comparisons retain their own sample, reagent and detection scope.

Recommended Western blot protocol parameters
Sample / lysateBV2 (40ug), C6 (40ug), K562 (40ug) (catalog A01570)
Gel %15% (standard starting point)
Load20–30 µg total protein per lane; optimize for abundance (standard starting point)
TransferShort semi-dry transfer; verify retention (standard starting point)
Membrane0.2 µm PVDF (standard starting point)
Blocking5% milk or 5% BSA in TBST (standard starting point)
Primary antibodyA01570; use the WB datasheet starting dilution (standard starting point)
Primary incubationOvernight at 4 °C (standard starting point)
Secondary antibodySpecies-matched HRP conjugate at validated dilution (standard starting point)
Secondary incubation1 h at room temperature (standard starting point)
Wash3 × 5 min in TBST (standard starting point)
DetectionECL; bracket exposures to avoid saturation (standard starting point)
Section 2

What Is the Expected MIA Western Blot Band Size?

UniProt predicts a 14.5 kDa precursor; secretion, signal-peptide cleavage, and isoforms may affect the blot, but their migration effects are unconfirmed.

What am I looking at on my blot?
Band near 14.5 kDamay represent the full-length precursor; confirm its identity
Band below 14.5 kDamay represent protein after signal-peptide cleavage
Little or no band in whole-cell lysateconsistent with secretion
Several discrete bandscould include isoforms 1 and 2 or precursor and mature protein; identities require validation
💡Expected MIA appearanceUniProt predicts a 14.5 kDa precursor; signal-peptide cleavage may yield a smaller mature band, but no empirical band size or isoform migration is established, so confirm band identity with controls.
How each factor affects band size
UniProt predicted precursor mass14.5 kDa before signal-peptide cleavage
Signal peptide at residues 1–24cleavage can make the mature protein smaller than the precursor
Isoform 1its mass relative to isoform 2 is not supplied
Isoform 2its mass relative to isoform 1 is not supplied
Why is my band missing or off?
SituationLikely causeNext action
No band in lysateMIA is secretedcheck conditioned medium alongside a positive control
Band higher than expectedan uncleaved precursor may run above mature MIAcompare lysate with conditioned medium and verify band identity
Band lower than expectedsignal-peptide cleavage may lower the mass from the 14.5 kDa precursorcheck conditioned medium and confirm identity with a positive control
Multiple bandsisoforms 1 and 2 or precursor and mature protein may contributecompare lysate and conditioned medium and use an identity control
Weak or no signalsecretion may leave little MIA in the sampled lysatetest conditioned medium and a positive control

Sample controls for MIA Western blot

🧪HPA-IHC candidate guidance (verify in WB): For positive controls for MIA in Western blot, you can use hippocampus tissue, which HPA lists as a positive sample.
Positive control: Hippocampus (IHC candidate; verify WB)
Negative control: Adipose tissue (IHC candidate; verify WB)
Loading controls: Run GAPDH, β-actin, and a total-protein stain such as Ponceau alongside the samples.
⚠️Feasibility: Because MIA is secreted, signal in tissue lysate may be weak; consider an extracellular protein fraction.

HPA tissue expression evidence for MIA

Comprehensive Human Protein Atlas IHC scoring per tissue. Rows are taken directly from the HPA tissue chart — click any row's HPA link to view the source.

Higher expression tissues · candidate positive controls from IHC

TissueCell typeLevelEvidenceSource
Hippocampus synapses Medium Protein (IHC) HPA →
Testis round or early spermatids Medium Protein (IHC) HPA →

Lower expression tissues · IHC evidence, not confirmed WB-negative controls

TissueCell typeLevelEvidenceSource
Adipose tissue adipocytes Not detected Protein (IHC) HPA →
Adrenal gland glandular cells Not detected Protein (IHC) HPA →
Appendix glandular cells Not detected Protein (IHC) HPA →
Bone marrow hematopoietic cells Not detected Protein (IHC) HPA →
Breast adipocytes Not detected Protein (IHC) HPA →
Section 3

Advanced MIA Western Blot Tips

Deeper troubleshooting and optimisation questions for MIA, answered from its protein features.

How should MIA band migration be interpreted?
Band shift · Use the separately labelled calculated mass and catalog-observed evidence above. A sequence annotation does not establish an observed migration shift. Verify target identity with orthogonal controls.
How could MIA isoforms affect the band pattern?
Isoforms · UniProt lists two isoforms. In isoform 2, residues 43..131 of isoform 1 are replaced by RSGRLLWRSGCSPGLFPQ. Check which sequence your antibody recognizes before assigning bands to either isoform; the features alone do not establish where either band runs.

Determine whether the antibody recognizes both isoforms or only one. The isoforms differ across UniProt residues 43..131, so an epitope in that region could make band intensity reflect antibody recognition as well as protein abundance.
Do annotated modifications prove a band shift?
PTM · The linked UniProt record describes protein features. A modification annotation alone does not demonstrate a visible shift; retain any condition or experimental qualifier attached to it.
Does this guide establish induction of MIA?
Induction · No general induction response is established by this guide. A pathway or gene-set association is not evidence of induction in a particular specimen. Verify the relevant treatment and control in a target-specific experiment.
How should transfer be checked for MIA?
Transfer · Standard workflow guidance: verify transfer efficiency for the intended target size before interpreting a weak signal. Use total-protein assessment and optimize transfer for the membrane, gel and apparatus; the labelled catalog values take precedence.
How should blocking be optimized?
Blocking · Standard workflow guidance: follow the A01570 datasheet where specified. Otherwise compare 5% milk or 5% BSA in TBST; for a phospho-specific assay start with BSA. Optimize background and specific signal with matched controls.
How should MIA be quantified?
Quantitation · Standard workflow guidance: quantify only a validated target band within the linear exposure range. Use consistent sample preparation and loading, retain biological replicates, and avoid interpreting saturation or loading differences as regulation.
Why might MIA migrate differently from its predicted 14.5 kDa mass?
Interpretation · MIA has a signal peptide at UniProt residues 1..24 and is secreted, so processing could change the mass of the detected protein. The supplied features do not establish a visible band shift or a specific apparent mass.

MIA is annotated as secreted. Check conditioned medium when a cellular lysate gives a weak signal, and compare equivalent collection conditions across samples.

UniProt lists two disulfide bonds. Comparing reducing and nonreducing lanes may help assess whether disulfide-dependent structure affects migration. These features do not guarantee a detectable change.

Consider signal-peptide processing, the two isoforms, and the two disulfide bonds when evaluating band size. MIA also interacts with FASLG and TMIGD2, but those interactions alone do not establish that an unexpected band is a complex. Confirm band identity before assigning a cause.
Boster reagents

MIA Western Blot Antibodies

Catalog antibodies with Western blot application and product-specific WB images. Evaluate suitability with the reported sample, controls and experimental conditions.

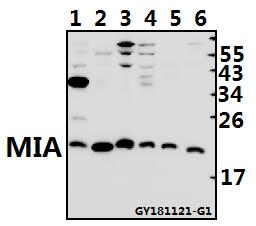
Real WB data Western blot (WB) analysis of MIA pAb at 1:500 dilution Lane1:BV2 whole cell lysate(40ug) Lane2:C6 whole cell lysate(40ug) Lane3:K562 whole cell lysate(40ug) Lane4:A2780 whole cell lysate(40ug) Lane5:U-87MG whole cell lysate(40ug) Lane6:HEK293T whole cell lysate(40ug)
Anti-MIA Antibody
Cat # A01570

A01570 is catalogued for human, mouse, and rat MIA. Its Western blot image shows testing at 1:500 on BV2, C6, K562, A2780, U-87MG, and HEK293T whole-cell lysates (40 µg each). Broader validation is not supplied.

Which to pick: A01570 is the only listed anti-MIA antibody. Its WB image documents six cell lysates at 1:500; compare those tested samples and the stated reactivity with your experiment.

Source: BosterBio MIA gene-info card — filtered to Western-blot-capable antibodies; each card shows that product's actual WB validation figure.