This website uses cookies to ensure you get the best experience on our website.


- Table of Contents
Plan MIA3 IHC in paraffin sections using the expected cytoplasmic tissue pattern and ER exit site localisation (HPA tissue IHC; UniProt). Compare staining with rectal glandular cells, which show high expression, and adipocytes, where MIA3 is not detected (HPA tissue IHC).

Expected localisation, validated protocols, controls and antibodies — the at-a-glance facts below, then the full design guide.
| Expected localisation | Cytoplasmic staining (HPA tissue IHC); ER exit sites expected (UniProt) | |
| Staining pattern | Cytoplasmic staining in cells of most tissues (HPA tissue IHC) | |
| Antigen retrieval | EDTA pH 8.0 HIER, heat-mediated (datasheet A06158-1) | |
| Positive control | Cerebellum+4 more · see all | |
| Negative control | Adipose tissue+3 more · see all |
| Fixation | Keep fixation consistent across sections. (standard IHC practice; not target-specific) | |
| Caveat | Signal varies by cell type; adipocytes are not detected (HPA tissue IHC) | |
| Regulation | Down-regulated in melanoma tissue (UniProt) | |
| Isoform / epitope | 4 isoforms; check whether the epitope is lumenal or cytoplasmic (UniProt) |
Compare the catalog antibody’s IHC-P protocol (datasheet A06158-1) with published MIA3 staining methods for clinical sections (PMC5576312) and tumour xenografts (PMC11455670).
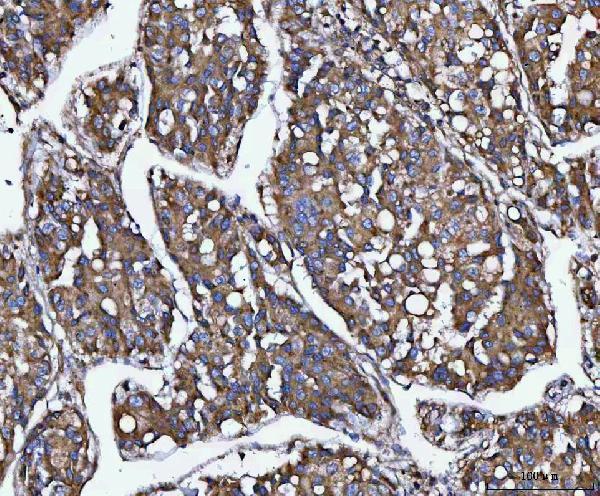
| Sample | Paraffin-embedded human colorectal adenocarcinoma tissue; fixative not specified (datasheet A06158-1) |
| Fixation | Image fixative and duration unreported (datasheet A06158-1); verify before use. |
| Sectioning | 4–5 µm sections on charged slides (standard) |
| Deparaffinisation | Xylene, graded ethanol series to water (standard) |
| Antigen retrieval | Heat retrieval: EDTA pH 8.0 (datasheet A06158-1); 20 min, 95–100 °C (standard) |
| Peroxidase block | 3% H2O2, 10 min, room temperature (standard) |
| Blocking | 10% goat serum (datasheet A06158-1) |
| Primary antibody | Rabbit anti-MIA3, 2-5 μg/ml (datasheet A06158-1) |
| Primary incubation | Overnight at 4 °C (datasheet A06158-1) |
| Detection | HRP-conjugated secondary, DAB chromogen (datasheet A06158-1) |
| Counterstain | Hematoxylin, blue, dehydrate and mount (standard) |
| Expected result | MIA3-positive staining in cells in molecular layer of cerebellum (HPA tissue IHC: High). HPA tissue profile: Cytoplasmic expression in most tissues. No signal in the no-primary control. |
MIA3 is an endoplasmic reticulum (ER) membrane protein enriched at ER exit sites; its large N-terminal region is lumenal and its C-terminal region is cytoplasmic (UniProt Q5JRA6 topology and subcellular location). In paraffin-section IHC, expect predominantly cytoplasmic staining in the cell populations reported by HPA, including rectal glandular cells and cerebral cortical neurons (HPA tissue IHC). HPA rates its tissue staining profile Supported, with consistency between antibody staining and RNA expression (HPA tissue IHC).
| Cytoplasmic staining in rectal glandular cells or cerebral cortical neurons. | This fits HPA's High staining in these cells and its broader cytoplasmic tissue profile (HPA tissue IHC). Compare signal within the identified cells; do not assume every neighboring cell should stain equally. |
| Predominantly nuclear staining or staining confined to the extracellular space, without convincing cytoplasmic signal. | This does not fit the ER membrane location (UniProt Q5JRA6 subcellular location) or the cytoplasmic tissue profile (HPA tissue IHC). Treat it as a localization concern and review controls and morphology before scoring it as MIA3. |
| Strong staining in adipocytes, alveolar cells, skeletal muscle myocytes or chondrocytes. | HPA reports MIA3 as Not detected in those respective cell populations (HPA tissue IHC). Unexpected staining warrants a check for antibody cross-reactivity or endogenous detection activity; tissue-level absence is not proof that every positive-looking pixel is an artefact. |
| Diffuse color across cells, stroma and tissue edges, with little distinction between cell populations. | A widespread haze is difficult to reconcile with HPA's cell-specific levels and cytoplasmic profile (HPA tissue IHC). In chromogenic IHC, nonspecific antibody binding or detection background can obscure a real signal (general IHC practice). |
| No staining in a well-preserved rectal glandular or cerebral cortical neuronal positive-control area. | HPA reports High staining in those cells, so a blank control challenges the run before it supports biological absence in a test specimen (HPA tissue IHC). Check that the intended cells are present and that the staining and detection steps worked. |
| Cell population and tissue choice | HPA reports High staining in rectal glandular cells, cerebral cortical neurons, nasopharyngeal respiratory epithelium and pachytene spermatocytes, but Not detected in adipocytes and alveolar cells (HPA tissue IHC). Use the named cell population when interpreting a section; an organ name alone is too coarse. |
| Expected compartment | MIA3 is an ER membrane protein at ER exit sites, with one transmembrane segment at residues 1177–1197 (UniProt Q5JRA6 topology and subcellular location). HPA describes tissue IHC as cytoplasmic in most tissues (HPA tissue IHC). Routine chromogenic sections need not resolve individual exit sites. |
| Antibody evidence | HPA rates the tissue profile Supported and lists IHC as Supported for HPA055922 and HPA056816 (HPA tissue IHC; HPA antibodies). These summaries support the reported pattern but do not validate every antibody or explain an unexpected pattern from the antibody used in a separate experiment. |
| Protein forms and epitope interpretation | UniProt lists four isoforms, a cleaved signal peptide at residues 1–22 and two glycosylation sites at residues 246 and 589 (UniProt Q5JRA6 isoforms, processing and glycosylation). Without an antibody's mapped epitope, these facts cannot establish which forms it stains or predict an antigen-retrieval response. |
| IF/ICC Q: Should vesicular signal match the IHC appearance? | A: HPA calls vesicles the enhanced main location in ICC-IF images from A-549, U-251MG and U2OS, while its tissue IHC summary says cytoplasmic expression (HPA subcellular ICC-IF; HPA tissue IHC). Interpret each assay at its own resolution; the IF/ICC guide covers that application. |
| Fixation sensitivity | Target-specific fixation effects and antigen-retrieval requirements are unreported in the supplied UniProt and HPA records (UniProt Q5JRA6; HPA tissue IHC). Any retrieval adjustment is a general IHC workflow decision, not an evidence-based prediction of altered MIA3 staining. |
| Situation | Likely cause | Next action |
|---|---|---|
| Positive-control cells are blank. | The expected High population may be absent from the viewed area (HPA tissue IHC), or a staining or detection step may have failed (general IHC practice). | Locate the named cells on the counterstained section, then review primary-antibody, detection and chromogen steps with an appropriate run control (general IHC practice). |
| Only nuclei appear positive. | Nuclear-only color conflicts with the ER membrane location (UniProt Q5JRA6 subcellular location) and HPA's cytoplasmic IHC profile (HPA tissue IHC). | Check morphology and compare with a primary-omission or other appropriate negative control for nonspecific detection (general IHC practice); avoid scoring nuclear color alone as MIA3. |
| Adipocytes or alveolar cells stain strongly. | These are reported as Not detected by HPA (HPA tissue IHC); cross-reactivity or endogenous detection activity is possible (general IHC practice). | Confirm cell identity, inspect the negative control and compare the same run with a named High population (HPA tissue IHC; general IHC practice). |
| Color covers stroma and tissue edges. | Broad background may reflect nonspecific binding or detection activity (general IHC practice); it obscures HPA's cytoplasmic, cell-associated profile (HPA tissue IHC). | Inspect a primary-omission control and review blocking, washing and chromogen development for the assay (general IHC practice). |
| A weak test section seems negative. | Some named populations are Low, including hepatocytes and duodenal glandular cells, whereas others are High (HPA tissue IHC). A weak result alone cannot establish assay failure or true absence. | Score the relevant cell population and compare it with a High-expression control processed in the same run (HPA tissue IHC; general IHC practice). |
| A tissue IHC image looks less punctate than an ICC-IF image. | HPA describes cytoplasmic tissue IHC and enhanced vesicular ICC-IF localization (HPA tissue IHC; HPA subcellular ICC-IF); chromogenic section detail differs from fluorescence microscopy (general IHC/IF practice). | Judge paraffin-section IHC against its cytoplasmic cell-pattern expectation and controls (HPA tissue IHC; general IHC practice); use the separate IF/ICC guide for fluorescence interpretation. |



Comprehensive Human Protein Atlas IHC scoring per tissue (reliability: Supported — High consistency between antibody staining and RNA expression data. Paired antibodies with high similarity supports the protein expression profile.). Rows are taken directly from the HPA tissue chart — click any row's HPA link to view the source.
| Tissue | Cell type | Level | Evidence | Source |
|---|---|---|---|---|
| Cerebellum | Cells in molecular layer | High | Protein (IHC) | HPA → |
| Cerebral cortex | Neuronal cells | High | Protein (IHC) | HPA → |
| Nasopharynx | Respiratory epithelial cells | High | Protein (IHC) | HPA → |
| Rectum | Glandular cells | High | Protein (IHC) | HPA → |
| Testis | Pachytene spermatocytes | High | Protein (IHC) | HPA → |
| Tissue | Cell type | Level | Evidence | Source |
|---|---|---|---|---|
| Adipose tissue | Adipocytes | Not detected | Protein (IHC) | HPA → |
| Lung | Alveolar cells | Not detected | Protein (IHC) | HPA → |
| Skeletal muscle | Myocytes | Not detected | Protein (IHC) | HPA → |
| Soft tissue | Chondrocytes | Not detected | Protein (IHC) | HPA → |
Use the catalog antibody’s paraffin section evidence to troubleshoot MIA3 chromogenic IHC, then check whether staining fits its reported cellular distribution.
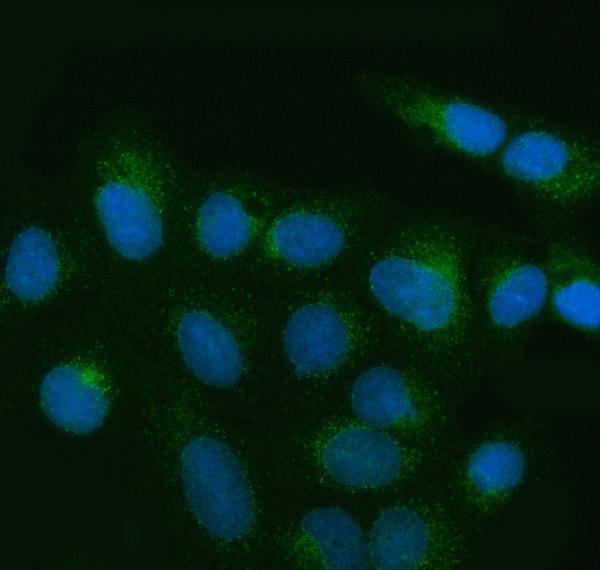
A06158-1 has IHC images from human paraffin sections and an IF/ICC image from U2OS cells (catalog image captions); its listed reactivity is human (datasheet).
A06158-1 will render with human paraffin-section IHC data from colorectal adenocarcinoma, liver cancer, and testicular germ cell tumor (catalog IHC captions). The same SKU lists IF/ICC and has a U2OS-cell IF image (datasheet; catalog IF caption).
Which to pick: Choose A06158-1 for human tissue IHC on paraffin sections, as shown in its own IHC captions (catalog IHC captions). Choose A06158-1 for IF/ICC because both applications are listed and its IF caption shows U2OS-cell staining (datasheet; catalog IF caption). No cross-species or clone-based choice is supported: only human reactivity is listed, clonality is unreported, and the paraffin-section IHC captions do not report the fixative (datasheet; catalog IHC captions).