This website uses cookies to ensure you get the best experience on our website.


- Table of Contents
Plan chromogenic MOSPD2 IHC in paraffin sections using the catalog antibody's 2–5 μg/ml range (datasheet A16695-1). Assess cytoplasmic staining while accounting for the uncertain tissue evidence (HPA tissue IHC).

Expected localisation, validated protocols, controls and antibodies — the at-a-glance facts below, then the full design guide.
| Expected localisation | Cytoplasmic staining (HPA tissue IHC); ER membrane (UniProt) | |
| Staining pattern | Cytoplasmic staining in most tissues (HPA tissue IHC) | |
| Antigen retrieval | EDTA pH 8.0 HIER, heat-mediated (datasheet A16695-1) | |
| Positive control | Appendix+4 more · see all | |
| Negative control | Adipose tissue+4 more · see all |
| Fixation | Keep fixation consistent across paraffin sections (standard IHC practice; not target-specific); Matched tissue-IHC evidence does not establish the fixation claim. Validate the specimen-specific method before use. (selected-SKU IHC image A16695-1) | |
| Caveat | Staining has low concordance with RNA expression (HPA tissue IHC) | |
| Regulation | CD14(+) monocytes enriched; neutrophils lower (UniProt) | |
| Isoform / epitope | 2 isoforms; cytoplasmic 1–496, TM 497–518; epitope map unknown (UniProt) |
The catalog antibody uses EDTA pH 8.0 retrieval (datasheet A16695-1). The published paraffin-section protocol below uses citrate retrieval (PMC9338958).
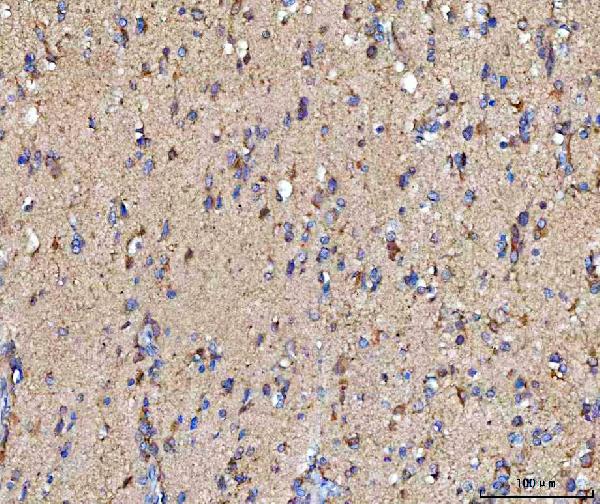
| Sample | Paraffin-embedded human brain tissue; fixative not specified (datasheet A16695-1) |
| Fixation | Image fixative and duration unreported (datasheet A16695-1); verify before use. |
| Sectioning | 4–5 µm sections on charged slides (standard) |
| Deparaffinisation | Xylene, graded ethanol series to water (standard) |
| Antigen retrieval | Heat retrieval: EDTA pH 8.0 (datasheet A16695-1); 20 min, 95–100 °C (standard) |
| Peroxidase block | 3% H2O2, 10 min, room temperature (standard) |
| Blocking | 10% goat serum (datasheet A16695-1) |
| Primary antibody | Rabbit anti-MOSPD2, 2-5 μg/ml (datasheet A16695-1) |
| Primary incubation | Overnight at 4 °C (datasheet A16695-1) |
| Detection | HRP-conjugated secondary, DAB chromogen (datasheet A16695-1) |
| Counterstain | Hematoxylin, blue, dehydrate and mount (standard) |
| Expected result | MOSPD2-positive staining in glandular cells of appendix (HPA tissue IHC: Medium). HPA tissue profile: Cytoplasmic expression in most tissues. No signal in the no-primary control. |
MOSPD2 is an endoplasmic reticulum (ER) membrane protein with a cytoplasmic region at residues 1–496 and a transmembrane segment at 497–518 (UniProt Q8NHP6 topology). In paraffin IHC, expect cytoplasmic staining in reported positive cells, including appendix glandular cells and bone marrow hematopoietic cells (HPA: Medium). CD14(+) monocytes express MOSPD2 highly (UniProt Q8NHP6 tissue specificity). Treat the tissue pattern as provisional because HPA rates its IHC profile Uncertain (HPA: Uncertain).
| Cytoplasmic stain in appendix glandular cells or bone marrow hematopoietic cells. | This fits the reported Medium staining in those cell populations (HPA: tissue IHC). Assess the named cells within the section; a positive result in one population does not imply that every cell in the tissue should stain. HPA reports low consistency between antibody staining and RNA expression, so morphology alone cannot establish specificity (HPA: Uncertain). |
| Predominantly nuclear staining, with little cytoplasmic signal. | A predominantly nuclear pattern conflicts with the expected ER membrane location and cytoplasmic topology (UniProt Q8NHP6 subcellular location and topology). Consider nonspecific staining or a detection artefact. Review the no-primary control and whether the signal follows nuclei or other tissue structures before scoring the section as MOSPD2 positive. |
| Strong staining in a cell population reported as undetected. | For example, HPA reports Not detected in adipocytes and cardiomyocytes (HPA: tissue IHC). Strong signal in those particular cells raises concern about cross-reactivity or endogenous detection activity; it does not mean the entire tissue must be blank. Compare cell morphology and controls, while remembering that HPA's tissue IHC assessment is Uncertain (HPA: Uncertain). |
| Diffuse colour across cells and tissue spaces, without a clear cellular pattern. | Widespread, poorly localized signal is difficult to reconcile with an ER-associated cytoplasmic result (UniProt Q8NHP6 subcellular location; HPA: cytoplasmic tissue profile). Background from the detection system or insufficient blocking is plausible in routine chromogenic IHC. Compare a no-primary control and avoid scoring diffuse haze as target staining. |
| No staining in appendix glandular cells or bone marrow hematopoietic cells. | Those cells have reported Medium staining and are useful comparison populations (HPA: tissue IHC), but HPA does not establish them as definitive positive controls because its tissue IHC profile is Uncertain (HPA: Uncertain). Check tissue identity, section quality, retrieval, antibody dilution and detection controls before interpreting an absent signal as biological absence. |
| Cell population within the tissue | HPA's levels apply to specified cells: colon glandular cells are Medium, while glomerular cells in kidney are Not detected (HPA: tissue IHC). Identify and score the named population rather than assigning its level to the whole organ. |
| ER topology | MOSPD2 has one C-terminal transmembrane segment at residues 497–518; residues 1–496 face the cytoplasm (UniProt Q8NHP6 topology). This supports a cytoplasmic, potentially reticular interpretation, but does not establish how sharply ER structure will resolve in chromogenic sections. |
| Tissue IHC confidence | The tissue profile is labelled Uncertain because antibody staining and RNA expression show low consistency; the listed HPA antibody, HPA003334, also has IHC validation marked Uncertain (HPA: tissue IHC; HPA: antibody validation). Use the reported pattern as a comparison, not proof of antibody specificity. |
| Isoforms and epitope information | UniProt lists two MOSPD2 isoforms (UniProt Q8NHP6 isoforms). The supplied evidence does not locate the catalog antibody's epitope or show whether it recognizes both isoforms. Do not attribute a staining difference to isoform selectivity without separate antibody-specific evidence. |
| Q: What should IF/ICC show? | A: ER localization is the supported main location in HPA ICC-IF images, consistent with UniProt's ER membrane annotation (HPA: subcellular; UniProt Q8NHP6 subcellular location). This cross-check concerns localization; IF/ICC staining conditions belong in its separate guide and do not define an IHC protocol. |
| Situation | Likely cause | Next action |
|---|---|---|
| Expected cells show little or no chromogenic signal. | The reported positive population may be absent from the section, or the routine IHC workflow may have failed. | Confirm the cell population first; appendix glandular and bone marrow hematopoietic cells are reported Medium (HPA: tissue IHC). Then review retrieval, primary dilution and detection controls without assuming a MOSPD2-specific retrieval requirement. |
| Nuclei dominate the stain. | The pattern disagrees with MOSPD2's ER membrane location (UniProt Q8NHP6 subcellular location). | Compare the no-primary control and inspect whether colour tracks nuclei rather than cytoplasm. Score only a reproducible cellular pattern consistent with the expected compartment; investigate persistent nuclear staining as possible nonspecific signal. |
| Adipocytes or cardiomyocytes stain strongly. | These cells are reported Not detected, making cross-reactivity or endogenous chromogenic activity possible explanations (HPA: tissue IHC). | Verify cell identity and examine a no-primary control; check the routine endogenous enzyme block if using enzyme-based detection. Interpret disagreement cautiously because HPA rates the tissue profile Uncertain (HPA: Uncertain). |
| The entire section has diffuse brown background. | Routine blocking, wash or detection background may obscure cellular staining. | Use a no-primary control to separate detection background from antibody-associated colour, then review blocking, washes and primary dilution. Seek a discrete cytoplasmic pattern before comparing the section with HPA's cytoplasmic tissue profile (HPA: tissue IHC). |
| Two reported positive tissues stain differently. | HPA's Medium calls describe specific cell populations, and its overall tissue IHC reliability is Uncertain (HPA: tissue IHC). | Compare the same named cell types across appropriately controlled sections and record intensity and the fraction of cells stained. Do not treat a difference between whole tissues as an established MOSPD2 expression change. |
| Signal appears in a reported undetected population but not in reported positive cells. | A reversed pattern is inconsistent with the supplied cell-level IHC observations, though those observations remain provisional (HPA: tissue IHC; HPA: Uncertain). | Recheck slide labels, tissue morphology and detection controls, then reassess specificity with an independent validation approach if the reversal persists. Avoid calling the unexpected stain a confirmed MOSPD2 pattern solely from chromogenic colour. |

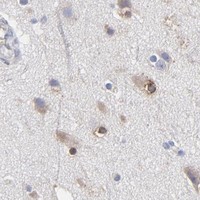


Comprehensive Human Protein Atlas IHC scoring per tissue (reliability: Uncertain — Low consistency between antibody staining and RNA expression data. Pending external verification.). Rows are taken directly from the HPA tissue chart — click any row's HPA link to view the source.
| Tissue | Cell type | Level | Evidence | Source |
|---|---|---|---|---|
| Appendix | Glandular cells | Medium | Protein (IHC) | HPA → |
| Bone marrow | Hematopoietic cells | Medium | Protein (IHC) | HPA → |
| Bronchus | Respiratory epithelial cells | Medium | Protein (IHC) | HPA → |
| Caudate | Glial cells | Medium | Protein (IHC) | HPA → |
| Cerebellum | Cells in granular layer | Medium | Protein (IHC) | HPA → |
| Tissue | Cell type | Level | Evidence | Source |
|---|---|---|---|---|
| Adipose tissue | Adipocytes | Not detected | Protein (IHC) | HPA → |
| Esophagus | Squamous epithelial cells | Not detected | Protein (IHC) | HPA → |
| Heart muscle | Cardiomyocytes | Not detected | Protein (IHC) | HPA → |
| Kidney | Cells in glomeruli | Not detected | Protein (IHC) | HPA → |
| Liver | Cholangiocytes | Not detected | Protein (IHC) | HPA → |
Troubleshoot MOSPD2 staining in paraffin sections by checking retrieval, compartment, cell identity, and controls before interpreting chromogenic signal.
A16695-1 has real IHC data from paraffin-embedded human brain, colorectal adenocarcinoma, placenta, and testicular germ cell tumor sections (catalog IHC captions). No IF images are supplied (catalog image payload).
A16695-1 is listed for IHC in human, mouse, and rat (catalog applications/reactivity). Its own IHC captions document DAB staining in paraffin-embedded human brain, colorectal adenocarcinoma, placenta, and testicular germ cell tumor sections (catalog IHC captions).
Which to pick: For tissue IHC, choose A16695-1 at a listed starting range of 2–5 μg/ml (datasheet: IHC dilution); its own captions show paraffin sections, but do not report the fixative (catalog IHC captions). For IF/ICC, A16695-1 has no listed validation or IF images, so there is no supported IF/ICC pick in this payload (catalog applications and image payload). For cross-species IHC, A16695-1 lists human, mouse, and rat reactivity, while its IHC images document human tissue only (catalog reactivity; catalog IHC captions).