MTUS1 · Western blot design guide

Design a Western Blot for MTUS1

Real validated MTUS1 Western blot protocols, expected-band and isoform facts, troubleshooting for weak or shifted signal, and recommended anti-MTUS1 WB antibodies. Everything you need to plan the experiment before you commit precious samples.
Last reviewed: May 2026 · Scientific review: Boster Bio technical team
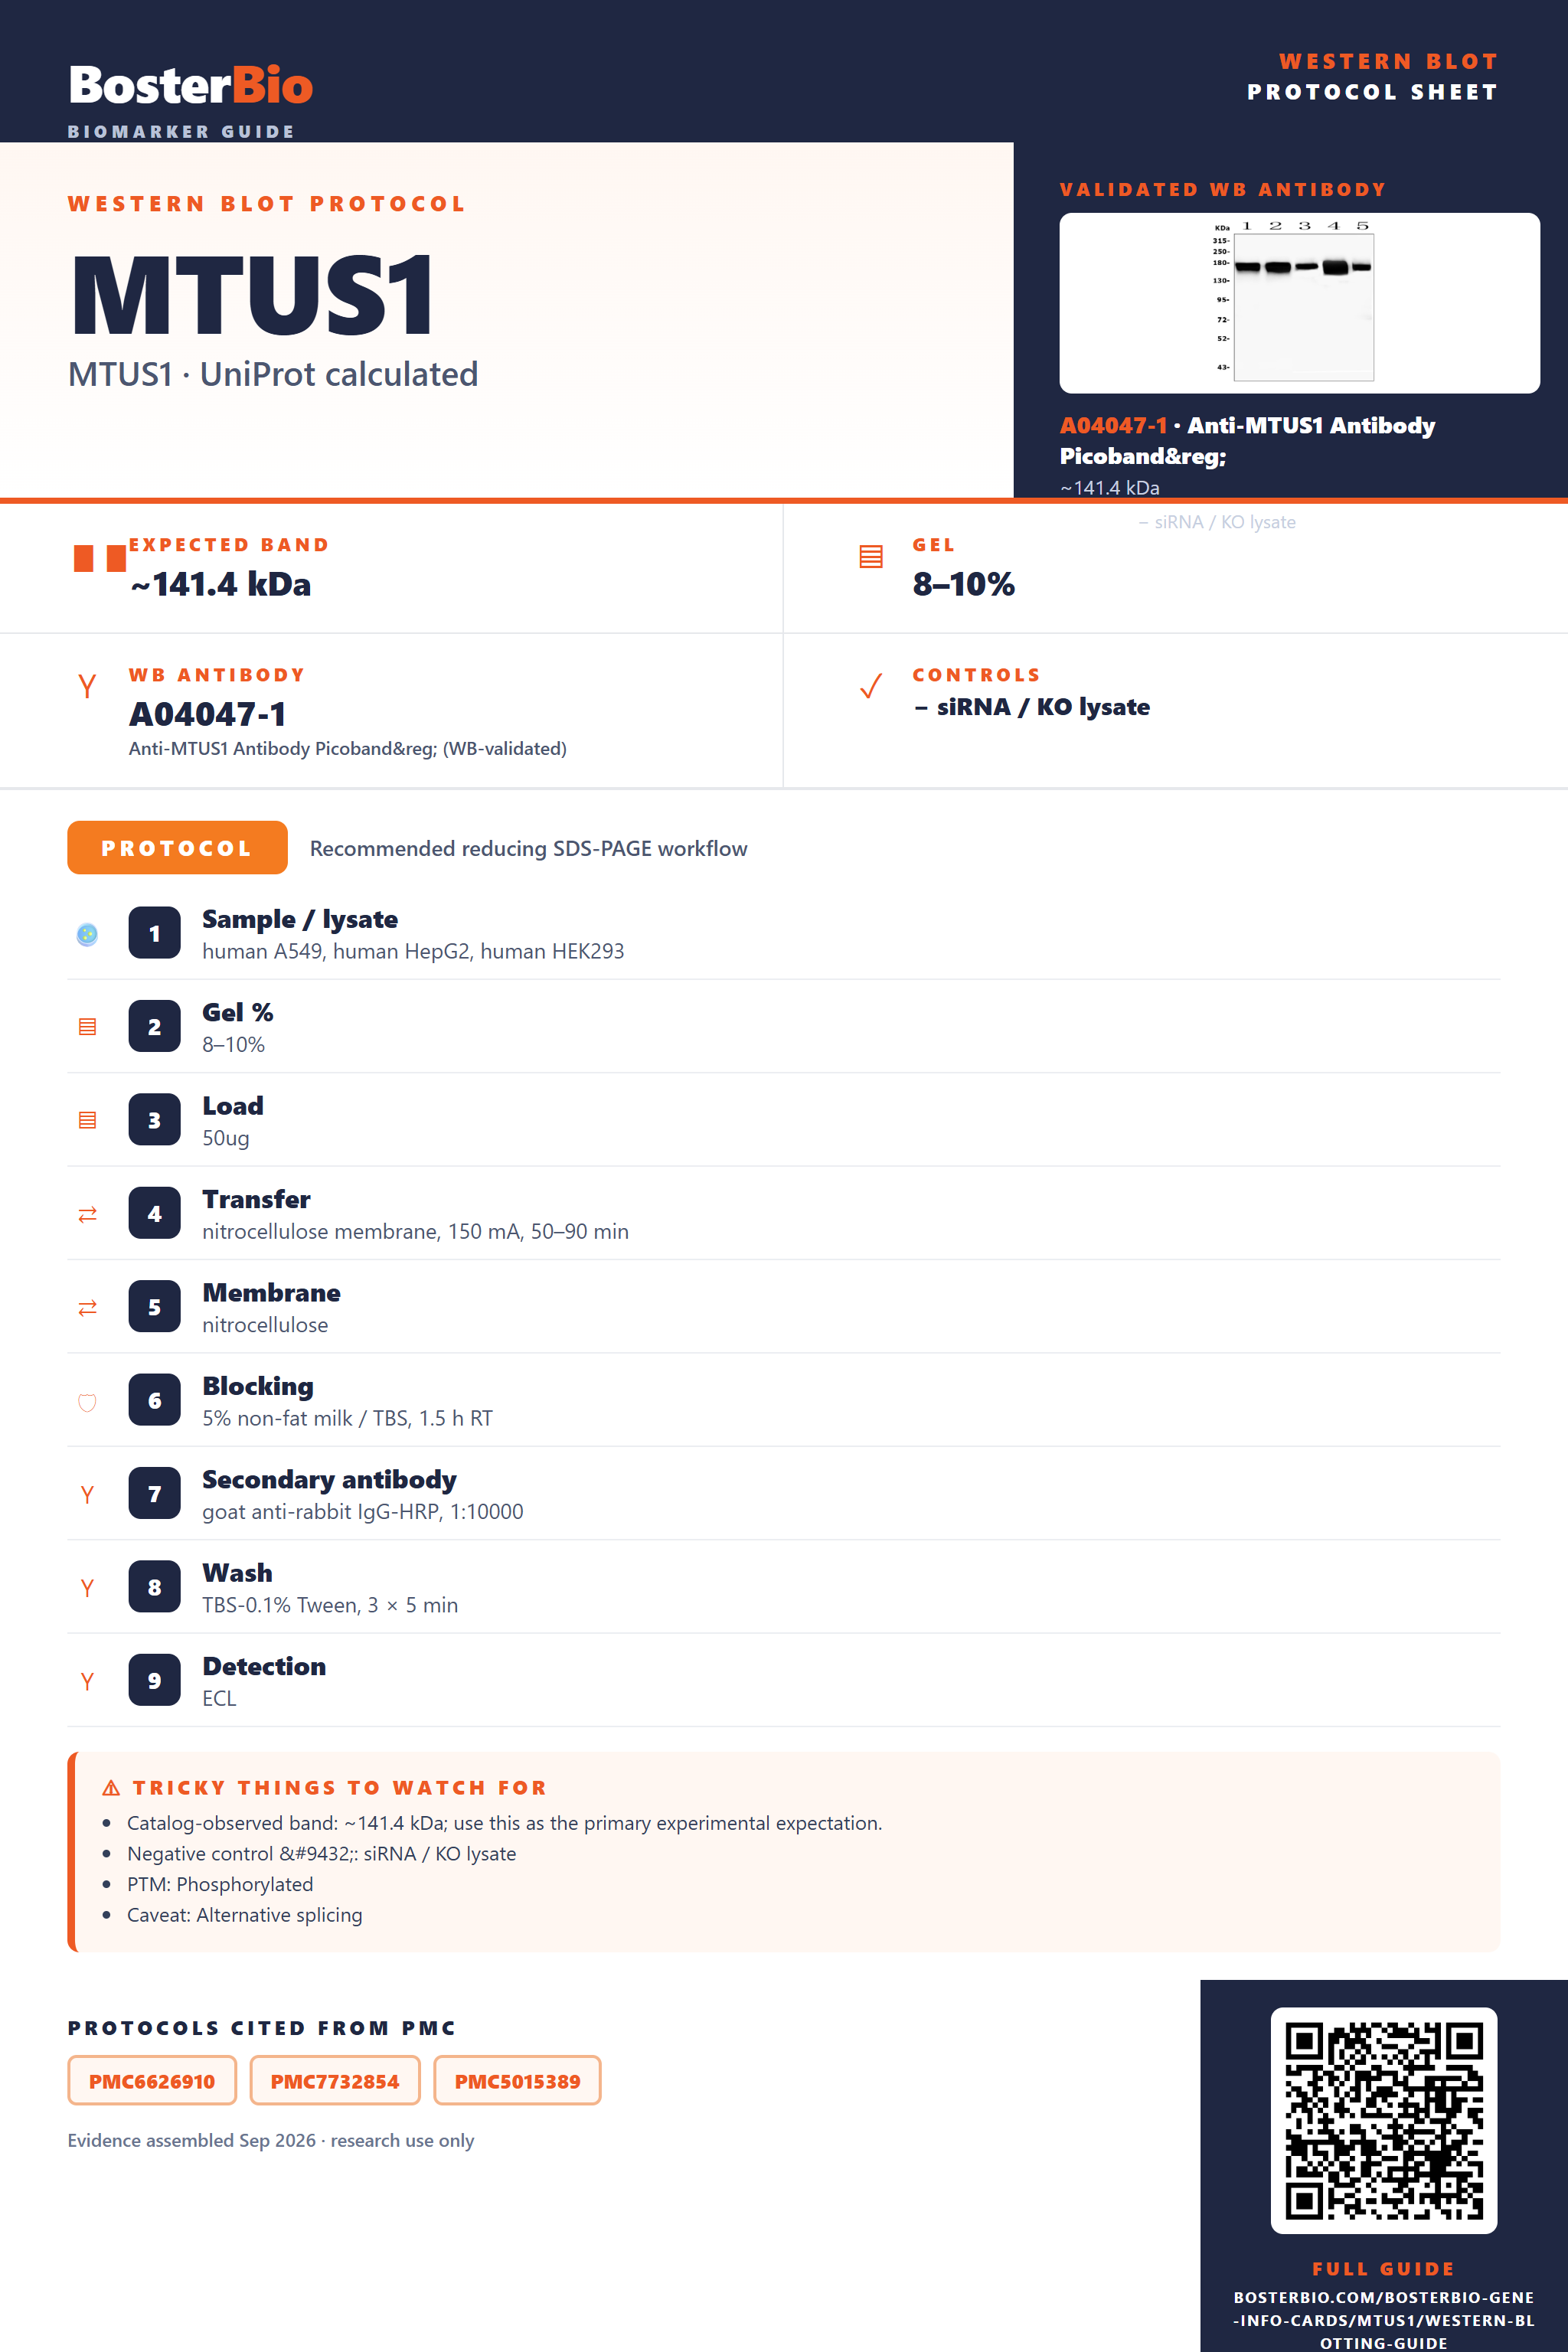
Western blot protocol sheet for MTUS1: expected band ~141.4 kDa, antibody A04047-1, and PMC-cited SDS-PAGE protocol steps
MTUS1 Western blot protocol sheet — expected band ~141.4 kDa, antibody A04047-1, controls and PMC citations. Open the full MTUS1 WB guide →

MTUS1 Western Blot Experimental Design Guide

Expected bands, validated protocols, controls and antibodies — the at-a-glance facts below, then the full design guide.

Must know before running
Expected band ~141.4 kDa
Observed band ~170 kDa
Gel 8–10%
Negative control ⓘ siRNA / KO lysate
Important caveats
Reasons your observed band may differ from the expected size.
PTM Phosphorylated
Caveat Alternative splicing
Regulation IFN-γ-induced
Isoform 7 isoform(s)
Section 1

Real Curated MTUS1 Western Blot Protocols

Literature-validated Western blot parameters for MTUS1 — gel percentage, transfer, blocking, antibody incubation and detection, extracted from published methods.

Recommended Western blot protocol parameters
Sample / lysatehuman A549, human HepG2, human HEK293
Gel %8–10%
Load50ug
Transfernitrocellulose membrane, 150 mA, 50–90 min
Membranenitrocellulose
Blocking5% non-fat milk / TBS, 1.5 h RT
Secondary antibodygoat anti-rabbit IgG-HRP, 1:10000
WashTBS-0.1% Tween, 3 × 5 min
DetectionECL
Exposure / imagingTanon 5200
Observed band170 kDa
Section 2

What Is the Expected MTUS1 Western Blot Band Size?

MTUS1 has a 141.4 kDa predicted mass but is empirically observed near 170 kDa, a shift driven mainly by extensive phosphorylation and anomalous coiled-coil migration on SDS-PAGE.

What am I looking at on my blot?
Single band around 170 kDathe predominant native MTUS1 species, migrating above its 141.4 kDa predicted mass due to heavy phosphorylation and anomalous SDS-PAGE mobility of this large coiled-coil protein
Band position or number varies across cell linesdifferent tissues/cell lines express different combinations of the seven annotated MTUS1 splice isoforms
Slightly diffuse band or closely spaced doubletheterogeneous phosphorylation across MTUS1's 13 modified Ser/Thr residues can produce subtly shifted or broadened species
No shift between reducing and non-reducing lanesconsistent with MTUS1 forming a homodimer through non-covalent contacts rather than inter-chain disulfide bonds, so reducing SDS-PAGE still resolves the monomer-sized band
Band detected in standard whole-cell lysateexpected because MTUS1 is intracellular (mitochondria, Golgi, cell membrane, nucleus), not secreted, so it is captured in routine lysate preparations
💡Expected MTUS1 appearanceMTUS1 typically appears as a band around 170 kDa in whole-cell lysate, running above its 141.4 kDa predicted mass due to extensive phosphorylation and anomalous migration typical of large coiled-coil proteins.
How each factor affects band size
Predicted mass (141.4 kDa, 1270 aa)sets the calculated baseline, though the empirically observed band runs notably higher at ~170 kDa
Extensive phosphorylation (13 modified residues, multiple Ser/Thr sites)phosphorylation commonly slows SDS-PAGE migration, contributing to the shift from predicted mass to the ~170 kDa observed band
Coiled-coil domain contentlarge coiled-coil-rich proteins often migrate more slowly than their calculated mass predicts, independent of any covalent modification
Seven annotated splice isoformsdifferent isoforms may appear as bands of differing apparent size depending on tissue or cell line, so the overall pattern can vary by sample
Homodimer formation (non-covalent, no confirmed inter-chain disulfide)under standard reducing/denaturing SDS-PAGE the dimer dissociates to the monomer-sized band; only native or non-reducing conditions would be expected to show a higher dimer-sized species
Why is my band missing or off?
SituationLikely causeNext action
Band higher than expectedextensive phosphorylation and coiled-coil structure slow MTUS1's migration relative to its 141.4 kDa calculated masscompare against the known ~170 kDa native band rather than the calculated mass, and treat this as the expected pattern
Multiple bandsco-expression of different MTUS1 splice isoforms across the seven annotated variantscompare the pattern across cell lines or tissues and check which isoforms the antibody epitope can detect
Broad smear instead of sharp bandheterogeneous phosphorylation across MTUS1's 13 modified residues broadens the bandtreat the lysate with phosphatase before electrophoresis to collapse phosphoforms into a sharper single band
Fragments below expected sizeMTUS1 is a large 1270-residue protein susceptible to proteolytic degradation during lysate preparationprepare lysate fresh with protease inhibitors and minimize freeze-thaw cycles to limit degradation products
Weak or no signalMTUS1 expression can be low or restricted to specific subcellular compartments such as mitochondria, Golgi, cell membrane, or nucleusload more total protein, enrich the relevant subcellular fraction, or select a cell line confirmed to express MTUS1

Sample controls for MTUS1 Western blot

🧪For positive controls for MTUS1 in Western blot, you can use lysate from cells transiently transfected with an MTUS1 expression construct, since no HPA tissue/cell expression data is available for this protein.
Positive control: MTUS1-transfected cell lysate
Negative control: ubiquitously expressed; use siRNA knockdown or KO line
Loading controls: Alongside MTUS1, probe for GAPDH and β-actin as loading controls and include a total-protein stain (e.g., stain-free gel, Ponceau S, or REVERT) for normalization.
⚠️Feasibility: With no HPA expression data and MTUS1 localizing across mitochondria, Golgi, cell membrane, and nucleus, a single clean reference tissue cannot be identified, so confirm antibody specificity with an overexpression lysate and an siRNA/KO negative control rather than tissue panels.

Comprehensive Human Protein Atlas IHC scoring per tissue. Rows are taken directly from the HPA tissue chart — click any row's HPA link to view the source.

Positive expression · recommended positive controls

TissueCell typeLevelEvidenceSource

Undetected expression · recommended negative controls

TissueCell typeLevelEvidenceSource
Section 3

Advanced MTUS1 Western Blot Tips

Deeper troubleshooting and optimisation questions for MTUS1, answered from its protein features.

Why does MTUS1 run near 170 kDa instead of 141 kDa?
MTUS1 contains extensive coiled-coil regions and 13 phosphorylation sites that increase apparent molecular weight on SDS-PAGE. The homodimer-forming coiled-coil structure resists full unfolding by SDS, causing anomalous migration. Combined with heavy phosphorylation, this commonly shifts the observed band to ~170 kDa versus the 141.4 kDa predicted mass; this is expected, not a specificity concern.
Why do multiple bands appear across MTUS1 samples?
MTUS1 has 7 annotated isoforms differing in exon inclusion; isoform 1 uniquely associates with microtubules. Antibodies targeting shared regions can detect several isoform-specific bands simultaneously, so multiple bands near and below the ~170 kDa main band may reflect genuine isoform diversity rather than nonspecific binding, especially in tissues with variable splicing.
Does angiotensin-II treatment affect MTUS1 detection?
In neurons, angiotensin-II treatment via AGTR2 signaling drives MTUS1 translocation from cytoplasmic/membrane pools into the nucleus. If probing subcellular fractions, expect reduced membrane/cytoplasmic signal and increased nuclear signal after AII stimulation; this is a real biological shift, not degradation or loading variability, and should guide fraction-specific loading controls.
What blocking approach best suits MTUS1 detection?
Because MTUS1 is heavily phosphorylated (13 modified residues) and antibodies may target phospho-epitopes, use BSA rather than milk for blocking to avoid casein phosphoprotein interference. 5% BSA in TBST is standard for phospho-sensitive detection, preserving epitope integrity while minimizing background from the protein's basic, coiled-coil-rich sequence.
What transfer method to use for MTUS1 Western blot?
At ~170 kDa apparent size, use wet/tank transfer rather than semi-dry for more efficient large-protein transfer. Use low-methanol (10%) transfer buffer, extend transfer time (60-90 min at 100V or overnight at low amperage), and use 0.45 µm PVDF membrane to retain this large, coiled-coil-rich protein without blow-through.
How should MTUS1 signal be normalized across fractions?
Since MTUS1 localizes to mitochondria, Golgi, cell membrane, and nucleus, and redistributes upon angiotensin-II stimulation, choose loading controls matching the specific compartment analyzed (e.g., VDAC for mitochondrial fraction, lamin for nuclear fraction) rather than a single whole-cell control, to avoid misinterpreting redistribution as expression change.
What explains faint bands below the main MTUS1 band?
Faint lower-MW bands may represent proteolytic fragments, given the protein's large size and lack of stabilizing disulfide bonds, or alternative isoforms lacking microtubule-binding regions. Confirm specificity with fresh lysates, protease inhibitors, and comparison against isoform-specific epitope mapping before attributing lower bands to degradation.
Boster reagents

Best MTUS1 Western Blot Antibodies

BosterBio's MTUS1 antibodies are among the best-performing WB antibodies on the market — well cited, thoroughly validated, and orthogonally cross-validated against negative tissues and complementary methods.

Real WB data Western blot analysis of MTUS1 using anti-MTUS1 antibody (A04047-1). <br>
Electrophoresis was performed on a 5-20% SDS-PAGE gel at 70V (Stacking gel) / 90V (Resolving gel) for 2-3 hours. The sample well of each lane was loaded with 50ug of sample under reducing conditions. <br>
Lane 1: human A549 whole cell lysates, <br>
Lane 2: human HepG2 whole cell lysates, <br>
Lane 3: human HEK293 whole cell lysates, <br>
Lane 4: human Caco-2 whole cell lysates, <br>
Lane 5: human Hela whole cell lysates. <br>
After Electrophoresis, proteins were transferred to a Nitrocellulose membrane at 150mA for 50-90 minutes. Blocked the membrane with 5% Non-fat Milk/ TBS for 1.5 hour at RT. The membrane was incubated with rabbit anti-MTUS1 antigen affinity purified polyclonal antibody (Catalog # A04047-1) at 0.5 μg/mL overnight at 4°C, then washed with TBS-0.1%Tween 3 times with 5 minutes each and probed with a goat anti-rabbit IgG-HRP secondary antibody at a dilution of 1:10000 for 1.5 hour at RT. The signal is developed using an Enhanced Chemiluminescent detection (ECL) kit (Catalog # EK1002) with Tanon 5200 system. A specific band was detected for MTUS1 at approximately 170KD. The expected band size for MTUS1 is at 141KD.
Anti-MTUS1 Antibody Picoband®
Cat # A04047-1

Boster's anti-MTUS1 antibody is a top-performing, extensively cited reagent, rigorously validated by western blot and orthogonally cross-checked against negative tissue and complementary detection methods, giving researchers a dependable, high-confidence choice for detecting MTUS1 in western blot applications.

Which to pick: Only one Boster anti-MTUS1 antibody (A04047-1) is catalogued here, and it includes an actual western blot validation image, so it's the clear, ready-to-use choice for your MTUS1 western blot experiments—no alternative SKUs to compare against.

Source: BosterBio MTUS1 gene-info card — filtered to Western-blot-capable antibodies; each card shows that product's actual WB validation figure.

References

  1. UniProt Consortium. UniProt entry Q9ULD2.
  2. Human Protein Atlas. MTUS1 tissue expression.

