This website uses cookies to ensure you get the best experience on our website.


- Table of Contents
Real validated MYO6 Western blot protocols, expected-band and isoform facts, troubleshooting for weak or shifted signal, and recommended anti-MYO6 WB antibodies. Everything you need to plan the experiment before you commit precious samples.

Expected bands, validated protocols, controls and antibodies — the at-a-glance facts below, then the full design guide.
| Expected band | ~149.7 kDa | |
| Observed band | ~150 kDa | |
| Gel | 5–20% (catalog A02627-2) | |
| Positive control | Bronchus (IHC candidate; verify WB) +4 more | |
| Negative control | Adipose tissue (IHC candidate; verify WB) |
| PTM | Phosphorylated | |
| Caveat | Phosphorylation-state controls | |
| Gene-set association | MSigDB C7 membership | |
| Isoform | 6 isoform(s) |
The A02627-2 protocol combines labelled catalog values with standard starting conditions. Published comparisons retain their own sample, reagent and detection scope.
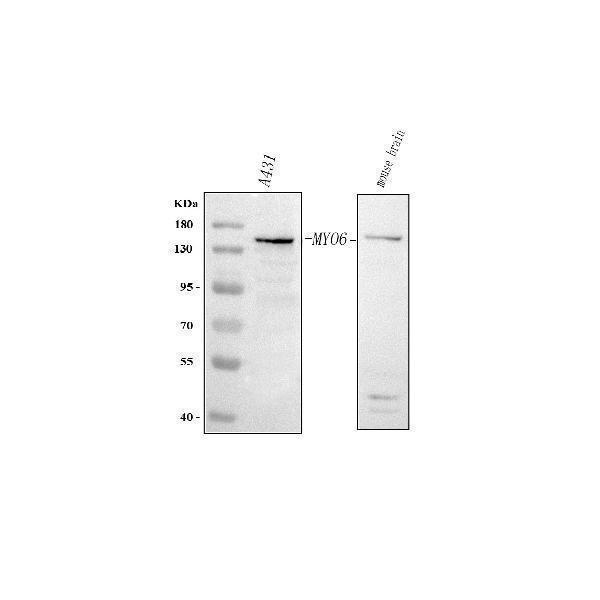
| Sample / lysate | human A431, mouse brain (catalog A02627-2) |
| Gel % | 5–20% (catalog A02627-2) |
| Load | 30 ug; reducing conditions (catalog A02627-2) |
| Transfer | a nitrocellulose membrane at 150 mA for 50-90 minutes (catalog A02627-2) |
| Membrane | nitrocellulose membrane (catalog A02627-2) |
| Blocking | 5% non-fat milk/TBS for 1.5 hour at RT (catalog A02627-2) |
| Primary antibody | A02627-2 · 0.5 μg/mL (catalog A02627-2) |
| Primary incubation | overnight at 4°C (catalog A02627-2) |
| Secondary antibody | goat anti-rabbit IgG-HRP, 1:5000 (catalog A02627-2) |
| Secondary incubation | 1.5 hour at RT (catalog A02627-2) |
| Wash | TBS-0.1%Tween 3 times with 5 minutes each (catalog A02627-2) |
| Detection | ECL (catalog A02627-2) |
MYO6 is predicted at 149.7 kDa and observed near 150 kDa; the small difference has no established cause in the supplied evidence.
| Band near 150 kDa | Matches the empirical MYO6 band and its 149.7 kDa predicted mass; confirm identity with controls |
| Band near twice the monomer size | Could represent a retained MYO6 homodimer if it survives SDS-PAGE |
| Several bands at different positions | Could reflect MYO6 splice isoforms; distinct migration is not established |
| Close doublet near 150 kDa | Could reflect phosphorylation at documented sites; a visible shift is not established |
| Predicted MYO6 mass | 149.7 kDa, consistent with the observed band near 150 kDa |
| Homodimer formation | Could yield a band near twice the monomer size if the dimer survives SDS-PAGE |
| Splice isoforms 1, 2, and 3 | May differ in apparent size; their individual migration is not supplied |
| Splice isoforms 4, 5, and 6 | May differ in apparent size; their individual migration is not supplied |
| Situation | Likely cause | Next action |
|---|---|---|
| Band higher than expected | MYO6 homodimer may persist during electrophoresis | Compare fully reducing and nonreducing preparations |
| Band lower than expected | A splice isoform or sample degradation is possible | Check sample integrity and confirm identity with a second MYO6 antibody |
| Multiple bands | MYO6 has six splice isoforms, though distinct migration is unproven | Compare bands with a second MYO6 antibody and an appropriate positive control |
| Weak or no signal | MYO6 abundance or antibody recognition may be low in the sample | Check transfer and compare with A431 or mouse brain positive lysate |
| Fragments below expected size | MYO6 may have degraded during sample preparation | Prepare fresh lysate with protease inhibitors and confirm band identity |
| Broad smear instead of sharp band | Sample degradation or excess loaded protein is possible | Check lysate integrity and repeat with less protein |
Comprehensive Human Protein Atlas IHC scoring per tissue. Rows are taken directly from the HPA tissue chart — click any row's HPA link to view the source.
| Tissue | Cell type | Level | Evidence | Source |
|---|---|---|---|---|
| Bronchus | ciliated cells (cell body) | High | Protein (IHC) | HPA → |
| Cerebellum | processes in white matter | High | Protein (IHC) | HPA → |
| Cerebral cortex | glial cells | High | Protein (IHC) | HPA → |
| Colon | glandular cells | High | Protein (IHC) | HPA → |
| Duodenum | glandular cells | High | Protein (IHC) | HPA → |
| Tissue | Cell type | Level | Evidence | Source |
|---|---|---|---|---|
| Adipose tissue | adipocytes | Not detected | Protein (IHC) | HPA → |
| Bone marrow | hematopoietic cells | Not detected | Protein (IHC) | HPA → |
| Heart muscle | cardiomyocytes | Not detected | Protein (IHC) | HPA → |
| Hippocampus | glial cells | Not detected | Protein (IHC) | HPA → |
| Lymph node | germinal center cells | Not detected | Protein (IHC) | HPA → |
Deeper troubleshooting and optimisation questions for MYO6, answered from its protein features.
Catalog antibodies with Western blot application and product-specific WB images. Evaluate suitability with the reported sample, controls and experimental conditions.
The catalog reports one anti-MYO6 antibody, A02627-2, with stated human and mouse reactivity. Its Western blot image shows an approximately 150 kDa band in human A431 cell and mouse brain lysates. The supplied evidence is limited to this product example.
Which to pick: A02627-2 is the only listed option. Its Western blot image documents human A431 cells and mouse brain under the reported conditions; use those examples when judging fit for your sample.