This website uses cookies to ensure you get the best experience on our website.


- Table of Contents
Plan chromogenic NASP IHC in paraffin sections using the observed nuclear tissue pattern as a guide (HPA tissue IHC). Compare proliferating cell populations and include an adipocyte-rich area as a low-signal reference (HPA tissue IHC).

Expected localisation, validated protocols, controls and antibodies — the at-a-glance facts below, then the full design guide.
| Expected localisation | Nuclear staining in most tissues (HPA tissue IHC); cytoplasmic location also annotated (UniProt) | |
| Staining pattern | Nuclear staining, strongest in proliferating cells (HPA tissue IHC) | |
| Antigen retrieval | EDTA pH 8.0 HIER, heat-mediated (datasheet A05383-1) | |
| Positive control | Appendix+4 more · see all | |
| Negative control | Adipose tissue |
| Fixation | Keep fixation consistent across sections (standard IHC practice; not target-specific); Matched tissue-IHC evidence does not establish the fixation claim. Validate the specimen-specific method before use. (selected-SKU IHC image A05383-1) | |
| Caveat | Adipocytes may lack signal despite broad tissue staining (HPA tissue IHC) | |
| Regulation | Most abundant in proliferating cells (HPA tissue IHC) | |
| Isoform / epitope | Four isoforms; isoform 1 is testis/sperm-specific; epitope impact unknown (UniProt) |
The catalog antibody’s IHC-P protocol (datasheet: A05383-1) sits alongside three published NASP IHC protocols (PMC5294820; PMC11009454; PMC8524314).
| Sample | Paraffin-embedded human liver cancer tissue; fixative not specified (datasheet A05383-1) |
| Fixation | Image fixative and duration unreported (datasheet A05383-1); verify before use. |
| Sectioning | 4–5 µm sections on charged slides (standard) |
| Deparaffinisation | Xylene, graded ethanol series to water (standard) |
| Antigen retrieval | Heat retrieval: EDTA pH 8.0 (datasheet A05383-1); 20 min, 95–100 °C (standard) |
| Peroxidase block | 3% H2O2, 10 min, room temperature (standard) |
| Blocking | 10% goat serum (datasheet A05383-1) |
| Primary antibody | Rabbit anti-NASP, 2-5μg/ml (datasheet A05383-1) |
| Primary incubation | Overnight at 4 °C (datasheet A05383-1) |
| Detection | HRP-conjugated secondary, DAB chromogen (datasheet A05383-1) |
| Counterstain | Hematoxylin, blue, dehydrate and mount (standard) |
| Expected result | NASP-positive staining in glandular cells of appendix (HPA tissue IHC: High). HPA tissue profile: Nuclear expression in most tissues, most abundant in proliferating cells. No signal in the no-primary control. |
NASP should appear chiefly in nuclei across many tissues, with stronger staining in proliferating cells (HPA tissue IHC: Enhanced reliability; medium consistency with RNA). High staining is reported in colon glandular cells and esophageal squamous epithelial cells (HPA tissue IHC). UniProt also places NASP in the cytoplasm and reports no transmembrane segment (UniProt P49321: subcellular location; topology).
| Distinct nuclear staining in colon glandular cells, with nearby structures remaining interpretable. | This matches a reported high signal in colon glandular cells (HPA tissue IHC). Compare nuclei within the same section; HPA describes nuclear expression in most tissues, especially proliferating cells (HPA tissue IHC). |
| Strong membrane outlines or predominantly cytoplasmic staining, with little nuclear signal. | A membrane-dominant result conflicts with the absence of a transmembrane segment (UniProt P49321: topology). Predominantly cytoplasmic IHC conflicts with the reported nuclear tissue pattern, although UniProt also lists cytoplasm (HPA tissue IHC; UniProt P49321: subcellular location). Check specificity before scoring it as NASP. |
| Prominent chromogenic staining in adipocytes while expected positive cells remain faint. | Adipocytes are reported as not detected (HPA tissue IHC: adipose tissue). This mismatch raises concern for cross-reactivity or endogenous detection activity; the stain alone cannot distinguish those causes. |
| Diffuse color across tissue and spaces between cells, obscuring nuclear boundaries. | Treat this as background until control sections clarify it. General IHC causes include excess antibody or detection reagent and incomplete blocking or washing; diffuse color does not establish NASP localization. |
| No nuclear staining in an otherwise intact colon glandular region. | That conflicts with the reported high glandular signal (HPA tissue IHC: colon). Review run controls and section quality before interpreting the specimen as NASP negative; HPA tissue observations do not guarantee every section will stain. |
| Tissue and cell population | HPA reports high staining in appendix, colon, duodenum and fallopian tube glandular cells, and in esophageal and oral squamous epithelium (HPA tissue IHC). Select a documented positive cell population for comparison. |
| Proliferation context | The atlas describes nuclear expression in most tissues, most abundant in proliferating cells (HPA tissue IHC). Interpret weaker areas against the cell population present, rather than assigning one intensity to the whole organ. |
| Isoform scope | UniProt lists 4 isoforms and describes isoform 1 as testis- and sperm-specific (UniProt P49321: isoforms; tissue specificity). Without an antibody epitope, these data cannot establish which isoforms the assay detects. |
| Antibody validation | HPA lists IHC as Enhanced for HPA028136, HPA030518 and HPA030520 (HPA antibodies). That supports the reported pattern; HPA still describes only medium consistency between antibody staining and RNA expression (HPA tissue IHC). |
| Chromogenic detection | Endogenous enzyme activity or nonspecific detection can produce color independently of the primary antibody (general IHC practice). A primary-antibody omission control helps assess detection background; it does not prove that every remaining signal is specific. |
| Situation | Likely cause | Next action |
|---|---|---|
| The positive-control section has no nuclear signal. | The run may have failed, or the selected field may lack the documented positive cell population; colon glandular cells are reported high (HPA tissue IHC: colon). | Confirm the glandular region and section integrity, then check reagent activity, antigen retrieval and antibody conditions using the assay's validated IHC protocol (general IHC practice). No NASP-specific retrieval requirement is supplied. |
| Color is strongest at membranes or throughout cytoplasm. | A membrane-dominant pattern conflicts with NASP topology, while a cytoplasm-dominant tissue pattern differs from HPA's nuclear profile (UniProt P49321: topology; HPA tissue IHC). | Compare nuclear and extranuclear signal in a documented positive tissue, inspect the omission control, and confirm the antibody's IHC validation. Do not infer that all cytoplasmic signal is artefactual: UniProt also lists cytoplasm (UniProt P49321: subcellular location). |
| Adipocytes stain conspicuously. | HPA reports NASP as not detected in adipocytes (HPA tissue IHC: adipose tissue); cross-reactivity or endogenous detection activity is possible. | Check a primary-antibody omission control and detection blocking, then compare with a documented positive tissue. Treat adipocyte color as unresolved unless controls support specificity (general IHC practice). |
| Diffuse color makes nuclear scoring unreliable. | Excess reagent, incomplete blocking or insufficient washing can raise chromogenic background (general IHC practice). | Review omission-control staining and the assay's blocking, dilution and wash conditions. Adjust one condition at a time, then assess whether distinct nuclei reappear (general IHC practice). |
| Different tissue regions have different staining intensities. | HPA reports a broad nuclear pattern enriched in proliferating cells and different levels across cell populations (HPA tissue IHC). | Score identified cell populations separately and compare like regions across sections. Preserve the distinction between weak staining and no detectable staining (general IHC practice). |
| IF/ICC images show nucleoplasmic signal plus puncta. | HPA reports nucleoplasm as the enhanced main location and vesicles as an additional location (HPA subcellular ICC-IF). | Interpret IF/ICC on its separate guide page; compare nuclear and punctate channels with appropriate controls. The ICC-IF pattern is contextual evidence, not an IHC-P protocol option (HPA subcellular ICC-IF). |
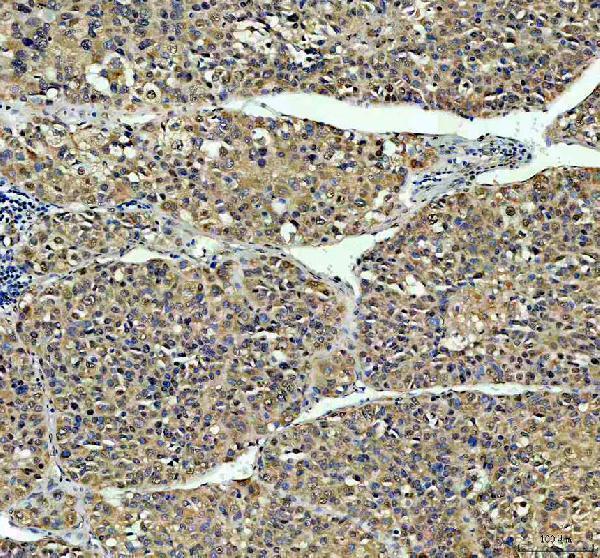
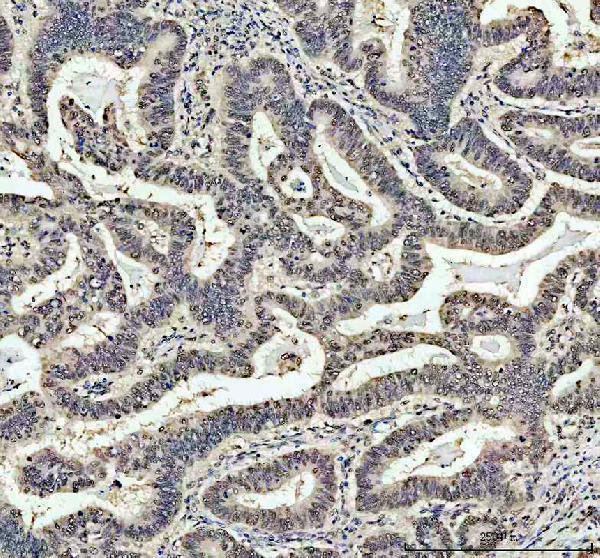
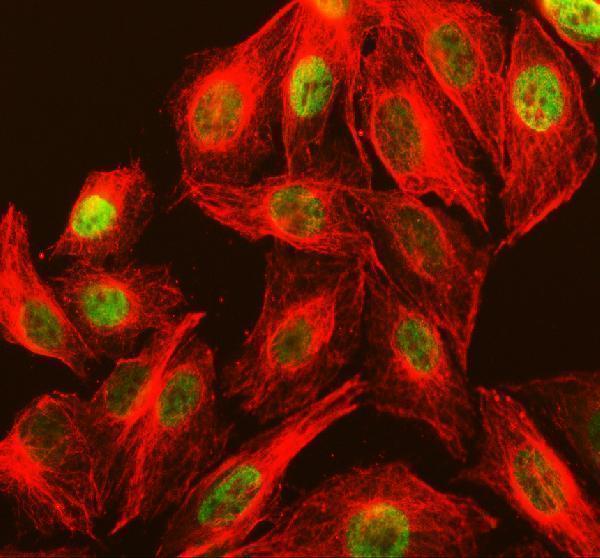


Comprehensive Human Protein Atlas IHC scoring per tissue (reliability: Enhanced — Medium consistency between antibody staining and RNA expression data.). Rows are taken directly from the HPA tissue chart — click any row's HPA link to view the source.
| Tissue | Cell type | Level | Evidence | Source |
|---|---|---|---|---|
| Appendix | Glandular cells | High | Protein (IHC) | HPA → |
| Colon | Glandular cells | High | Protein (IHC) | HPA → |
| Duodenum | Glandular cells | High | Protein (IHC) | HPA → |
| Endometrium | Cells in endometrial stroma | Medium | Protein (IHC) | HPA → |
| Esophagus | Squamous epithelial cells | High | Protein (IHC) | HPA → |
| Tissue | Cell type | Level | Evidence | Source |
|---|---|---|---|---|
| Adipose tissue | Adipocytes | Not detected | Protein (IHC) | HPA → |
Use the catalog antibody’s paraffin-section evidence alongside NASP localisation and tissue patterns when troubleshooting chromogenic IHC.
A05383-1 is an IHC/IF-tested anti-NASP antibody with images from human cancer sections, mouse testis sections, and U2OS cells (catalog applications and image captions).
The A05383-1 card shows IHC in paraffin-embedded human liver cancer, human stomach cancer, and mouse testis sections (A05383-1 IHC image captions). Its IF images show U2OS cells and paraffin-embedded human stomach cancer and mouse testis sections (A05383-1 IF image captions).
Which to pick: For tissue IHC, choose A05383-1 at 2–5 μg/ml; its IHC captions document heat retrieval in EDTA at pH 8.0 (catalog dilution; A05383-1 IHC image captions). For IF/ICC, the same SKU lists 5 μg/ml and has IF images; clonality is unreported (catalog applications and dilution; A05383-1 IF image captions; catalog clone field). For cross-species work, A05383-1 lists Human, Mouse, and Rat reactivity, while its IHC images cover human and mouse only; the paraffin-section captions do not report a fixative (catalog reactivity; A05383-1 IHC image captions).