This website uses cookies to ensure you get the best experience on our website.


- Table of Contents
Use bone marrow hematopoietic cells or lymph node germinal center cells as high-staining IHC references (HPA tissue IHC). This guide helps assess staining in immune cell subsets (HPA tissue IHC) against the expected cytosolic and membrane distribution (UniProt).

Expected localisation, validated protocols, controls and antibodies — the at-a-glance facts below, then the full design guide.
| Expected localisation | Cytosol and membrane expected (UniProt) | |
| Staining pattern | Immune cell subsets (HPA tissue IHC); cytosol or membrane expected (UniProt) | |
| Antigen retrieval | EDTA pH 8.0 HIER, heat-mediated (datasheet A01586-3) | |
| Positive control | Bone marrow+4 more · see all | |
| Negative control | Adipose tissue+4 more · see all |
| Fixation | Matched tissue-IHC evidence does not establish the fixation claim. Validate the specimen-specific method before use. (selected-SKU IHC image A01586-3) | |
| Caveat | Endogenous peroxidase in phagocytes can mimic DAB signal (standard IHC practice) | |
| Regulation | Activation recruits NCF1 to membranes (UniProt) | |
| Isoform / epitope | 2 isoforms; epitope coverage is unspecified (UniProt) |
The catalog antibody protocol is paired with published NCF1 IHC methods for rat submandibular gland (PMC13008658) and liver specimens (PMC9282929).
| Sample | Paraffin-embedded rat lymph tissue; fixative not specified (datasheet A01586-3) |
| Fixation | Image fixative and duration unreported (datasheet A01586-3); verify before use. |
| Sectioning | 4–5 µm sections on charged slides (standard) |
| Deparaffinisation | Xylene, graded ethanol series to water (standard) |
| Antigen retrieval | Heat retrieval: EDTA pH 8.0 (datasheet A01586-3); 20 min, 95–100 °C (standard) |
| Peroxidase block | 3% H2O2, 10 min, room temperature (standard) |
| Blocking | 10% goat serum (datasheet A01586-3) |
| Primary antibody | Rabbit anti-NCF1, 2-5 μg/ml (datasheet A01586-3) |
| Primary incubation | Overnight at 4 °C (datasheet A01586-3) |
| Detection | HRP-conjugated secondary, DAB chromogen (datasheet A01586-3) |
| Counterstain | Hematoxylin, blue, dehydrate and mount (standard) |
| Expected result | NCF1-positive staining in hematopoietic cells of bone marrow (HPA tissue IHC: High). HPA tissue profile: Distinct expression in a subset of immune cells in most tissues. No signal in the no-primary control. |
NCF1 is a cytosolic protein that can associate with membranes during phagocyte NADPH oxidase assembly; it has no transmembrane segment (UniProt P14598). In IHC, expect staining in subsets of immune cells across tissues, including strong staining in bone marrow hematopoietic cells and lymphoid populations, and moderate staining in lung macrophages (HPA tissue IHC). The tissue profile has Enhanced reliability, reflecting consistency between antibody staining and RNA expression (HPA tissue IHC).
| Cytoplasmic staining in scattered immune cells, with strong signal in bone marrow hematopoietic cells. | This matches the expected compartment (UniProt P14598) and a high-expression reference population (HPA: High in bone marrow hematopoietic cells). Score the stained cells rather than averaging signal across the entire section. |
| Staining is confined to nuclei, with little or no cytoplasmic signal. | An exclusively nuclear pattern conflicts with the reported cytosolic and membrane locations (UniProt P14598). Check the counterstain and detection controls before interpreting the nuclear signal as NCF1. |
| Strong signal fills adipocytes or respiratory epithelial cells. | These cells are reported as Not detected (HPA: adipose tissue adipocytes; bronchus respiratory epithelial cells). Consider nonspecific antibody binding or endogenous detection activity; nearby immune cells may still be positive (HPA tissue IHC). |
| Brown precipitate covers many cell types or extends beyond cell boundaries. | Diffuse chromogen obscures cell-specific scoring and may reflect background from detection or washing (general IHC practice). Compare a no-primary control and assess whether the signal follows identifiable cells. |
| No staining appears in bone marrow hematopoietic cells or lymph node germinal center cells. | Both are reported High (HPA tissue IHC). A blank section therefore needs a control and workflow check before being read as a biological negative; the HPA profile does not establish target-specific fixation sensitivity. |
| Cell population selected for scoring | NCF1 is detected in peripheral blood monocytes and neutrophils (UniProt P14598), while tissue staining is distinct in subsets of immune cells (HPA tissue IHC). Identify the cell population before calling a whole section positive or negative. |
| Cytosolic versus peripheral signal | NCF1 is cytosolic and participates in oxidase assembly at plasma or phagosomal membranes (UniProt P14598). Some peripheral staining can fit its biology; membrane association alone does not establish activation in a fixed section. |
| Antibody evidence | IHC validation differs among the listed antibodies: HPA047836 and CAB004524 are Enhanced; HPA052095 is Supported (HPA antibodies). This supports checking the exact antibody used when comparing staining patterns. |
| Isoform and epitope interpretation | Two isoforms are listed (UniProt P14598). The supplied record does not map antibody epitopes or establish isoform-specific IHC staining, so a negative result cannot identify which isoform is absent. |
| Situation | Likely cause | Next action |
|---|---|---|
| Known-positive tissue is blank. | The run may have failed, or the tested section may lack the expected cells; bone marrow hematopoietic cells are High (HPA tissue IHC). | Confirm the cells on a counterstained section, then review the IHC control, retrieval, antibody dilution and detection steps as general workflow checks. |
| Most of the section has diffuse brown background. | Residual detection reagent or inadequate washing can produce nonspecific chromogen deposition (general IHC practice). | Inspect a no-primary control and the pattern around cell boundaries; review blocking and washes before changing the biological interpretation. |
| Unexpected strong staining appears in epithelial cells or adipocytes. | Respiratory epithelial cells and adipocytes are Not detected in the specified HPA tissues (HPA tissue IHC); binding or detection activity may explain the signal. | Compare a no-primary control and cell morphology; score identifiable immune cells separately from the unexpected cell population. |
| Signal looks nuclear rather than cytoplasmic. | Nuclear-only staining does not match the reported cytosolic and membrane locations (UniProt P14598). | Check focus, counterstain and a no-primary control, then compare with the cytoplasmic pattern in a known-positive immune-cell population. |
| A thin peripheral rim is the only visible signal. | Membrane association is biologically plausible during oxidase assembly (UniProt P14598), but the rim alone does not establish NCF1 specificity or activation. | Check whether the rim belongs to identifiable immune cells and whether control staining supports a cell-associated pattern. |
| Can the IHC pattern be used as the expected IF/ICC pattern? | HPA lists no main ICC-IF location or cell-line images, and the listed antibodies have no ICC validation entry (HPA subcellular; HPA antibodies). | Use an independently validated IF/ICC control and assess cellular localisation there; do not infer an IF/ICC protocol or image pattern from these IHC data. |


Comprehensive Human Protein Atlas IHC scoring per tissue (reliability: Enhanced — High consistency between antibody staining and RNA expression data.). Rows are taken directly from the HPA tissue chart — click any row's HPA link to view the source.
| Tissue | Cell type | Level | Evidence | Source |
|---|---|---|---|---|
| Bone marrow | Hematopoietic cells | High | Protein (IHC) | HPA → |
| Lymph node | Germinal center cells | High | Protein (IHC) | HPA → |
| Spleen | Cells in white pulp | High | Protein (IHC) | HPA → |
| Tonsil | Non-germinal center cells | High | Protein (IHC) | HPA → |
| Lung | Macrophages | Medium | Protein (IHC) | HPA → |
| Tissue | Cell type | Level | Evidence | Source |
|---|---|---|---|---|
| Adipose tissue | Adipocytes | Not detected | Protein (IHC) | HPA → |
| Adrenal gland | Glandular cells | Not detected | Protein (IHC) | HPA → |
| Appendix | Glandular cells | Not detected | Protein (IHC) | HPA → |
| Breast | Adipocytes | Not detected | Protein (IHC) | HPA → |
| Bronchus | Respiratory epithelial cells | Not detected | Protein (IHC) | HPA → |
Troubleshoot NCF1 staining in paraffin sections by checking retrieval, immune cell distribution, cytosolic localisation and chromogenic background against the available evidence.
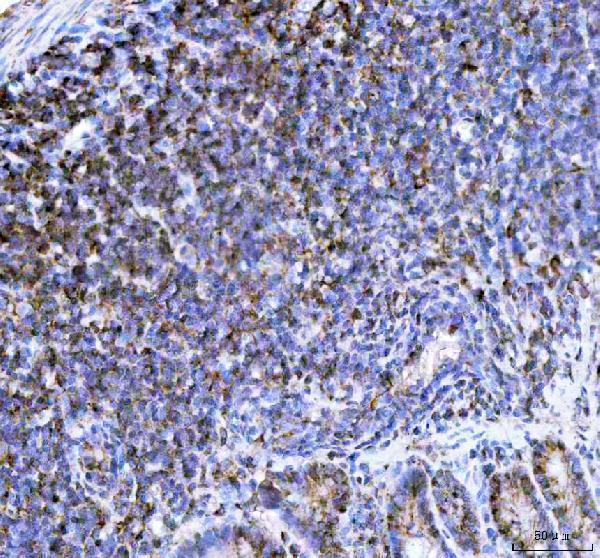
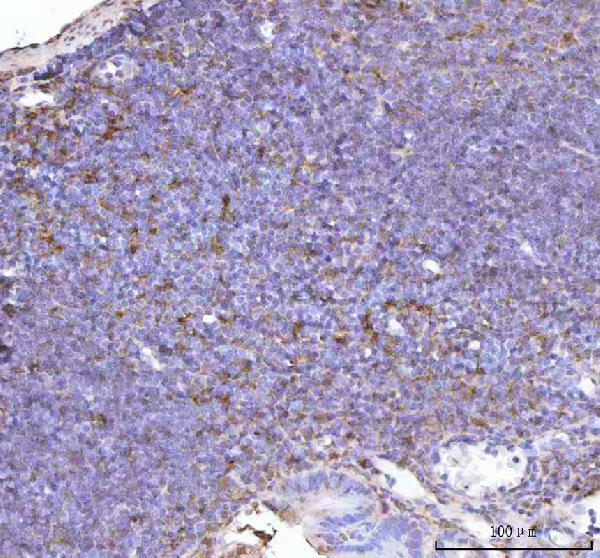
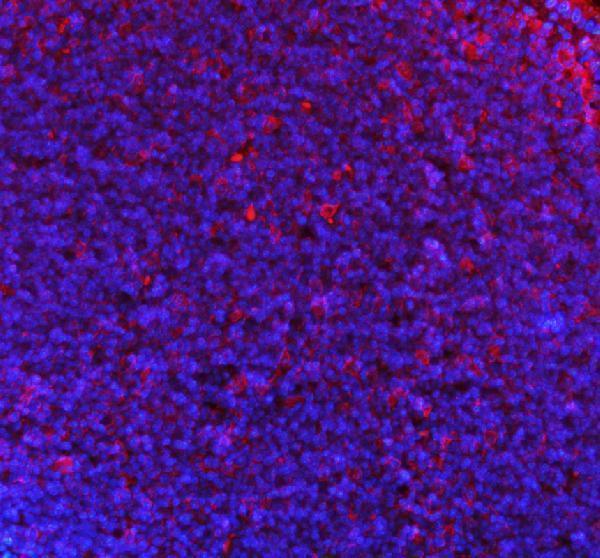
A01586-3 has IHC images from rat and mouse paraffin lymph tissue and IF images from mouse and rat paraffin lymph node tissue (catalog image captions). Human reactivity is listed without a tissue image (catalog: reactivity).
A01586-3 has IHC images from rat and mouse paraffin lymph tissue and IF images from mouse and rat paraffin lymph node tissue (catalog image captions). A01586S370 lists IHC and IF applications and Human, Mouse, and Rat reactivity, but has no supplied IHC or IF image captions (catalog: applications, reactivity, image captions).
Which to pick: Choose A01586-3 for paraffin-section IHC: its rat and mouse lymph tissue captions document EDTA retrieval, goat-serum blocking, and DAB detection; the fixative is unreported (A01586-3 IHC image captions). For IF, A01586-3 has mouse and rat paraffin lymph node images; ICC is not listed, while A01586S370 lists IF without a supplied image (catalog: applications and IF image captions). For work across Human, Mouse, and Rat, both SKUs list reactivity in all three species, but the supplied tissue images cover only Mouse and Rat for A01586-3 (catalog: reactivity and image captions).