NOD1 · Western blot design guide

Design a Western Blot for NOD1

Real validated NOD1 Western blot protocols, expected-band and isoform facts, troubleshooting for weak or shifted signal, and recommended anti-NOD1 WB antibodies. Everything you need to plan the experiment before you commit precious samples.
Last reviewed: May 2026 · Scientific review: Boster Bio technical team
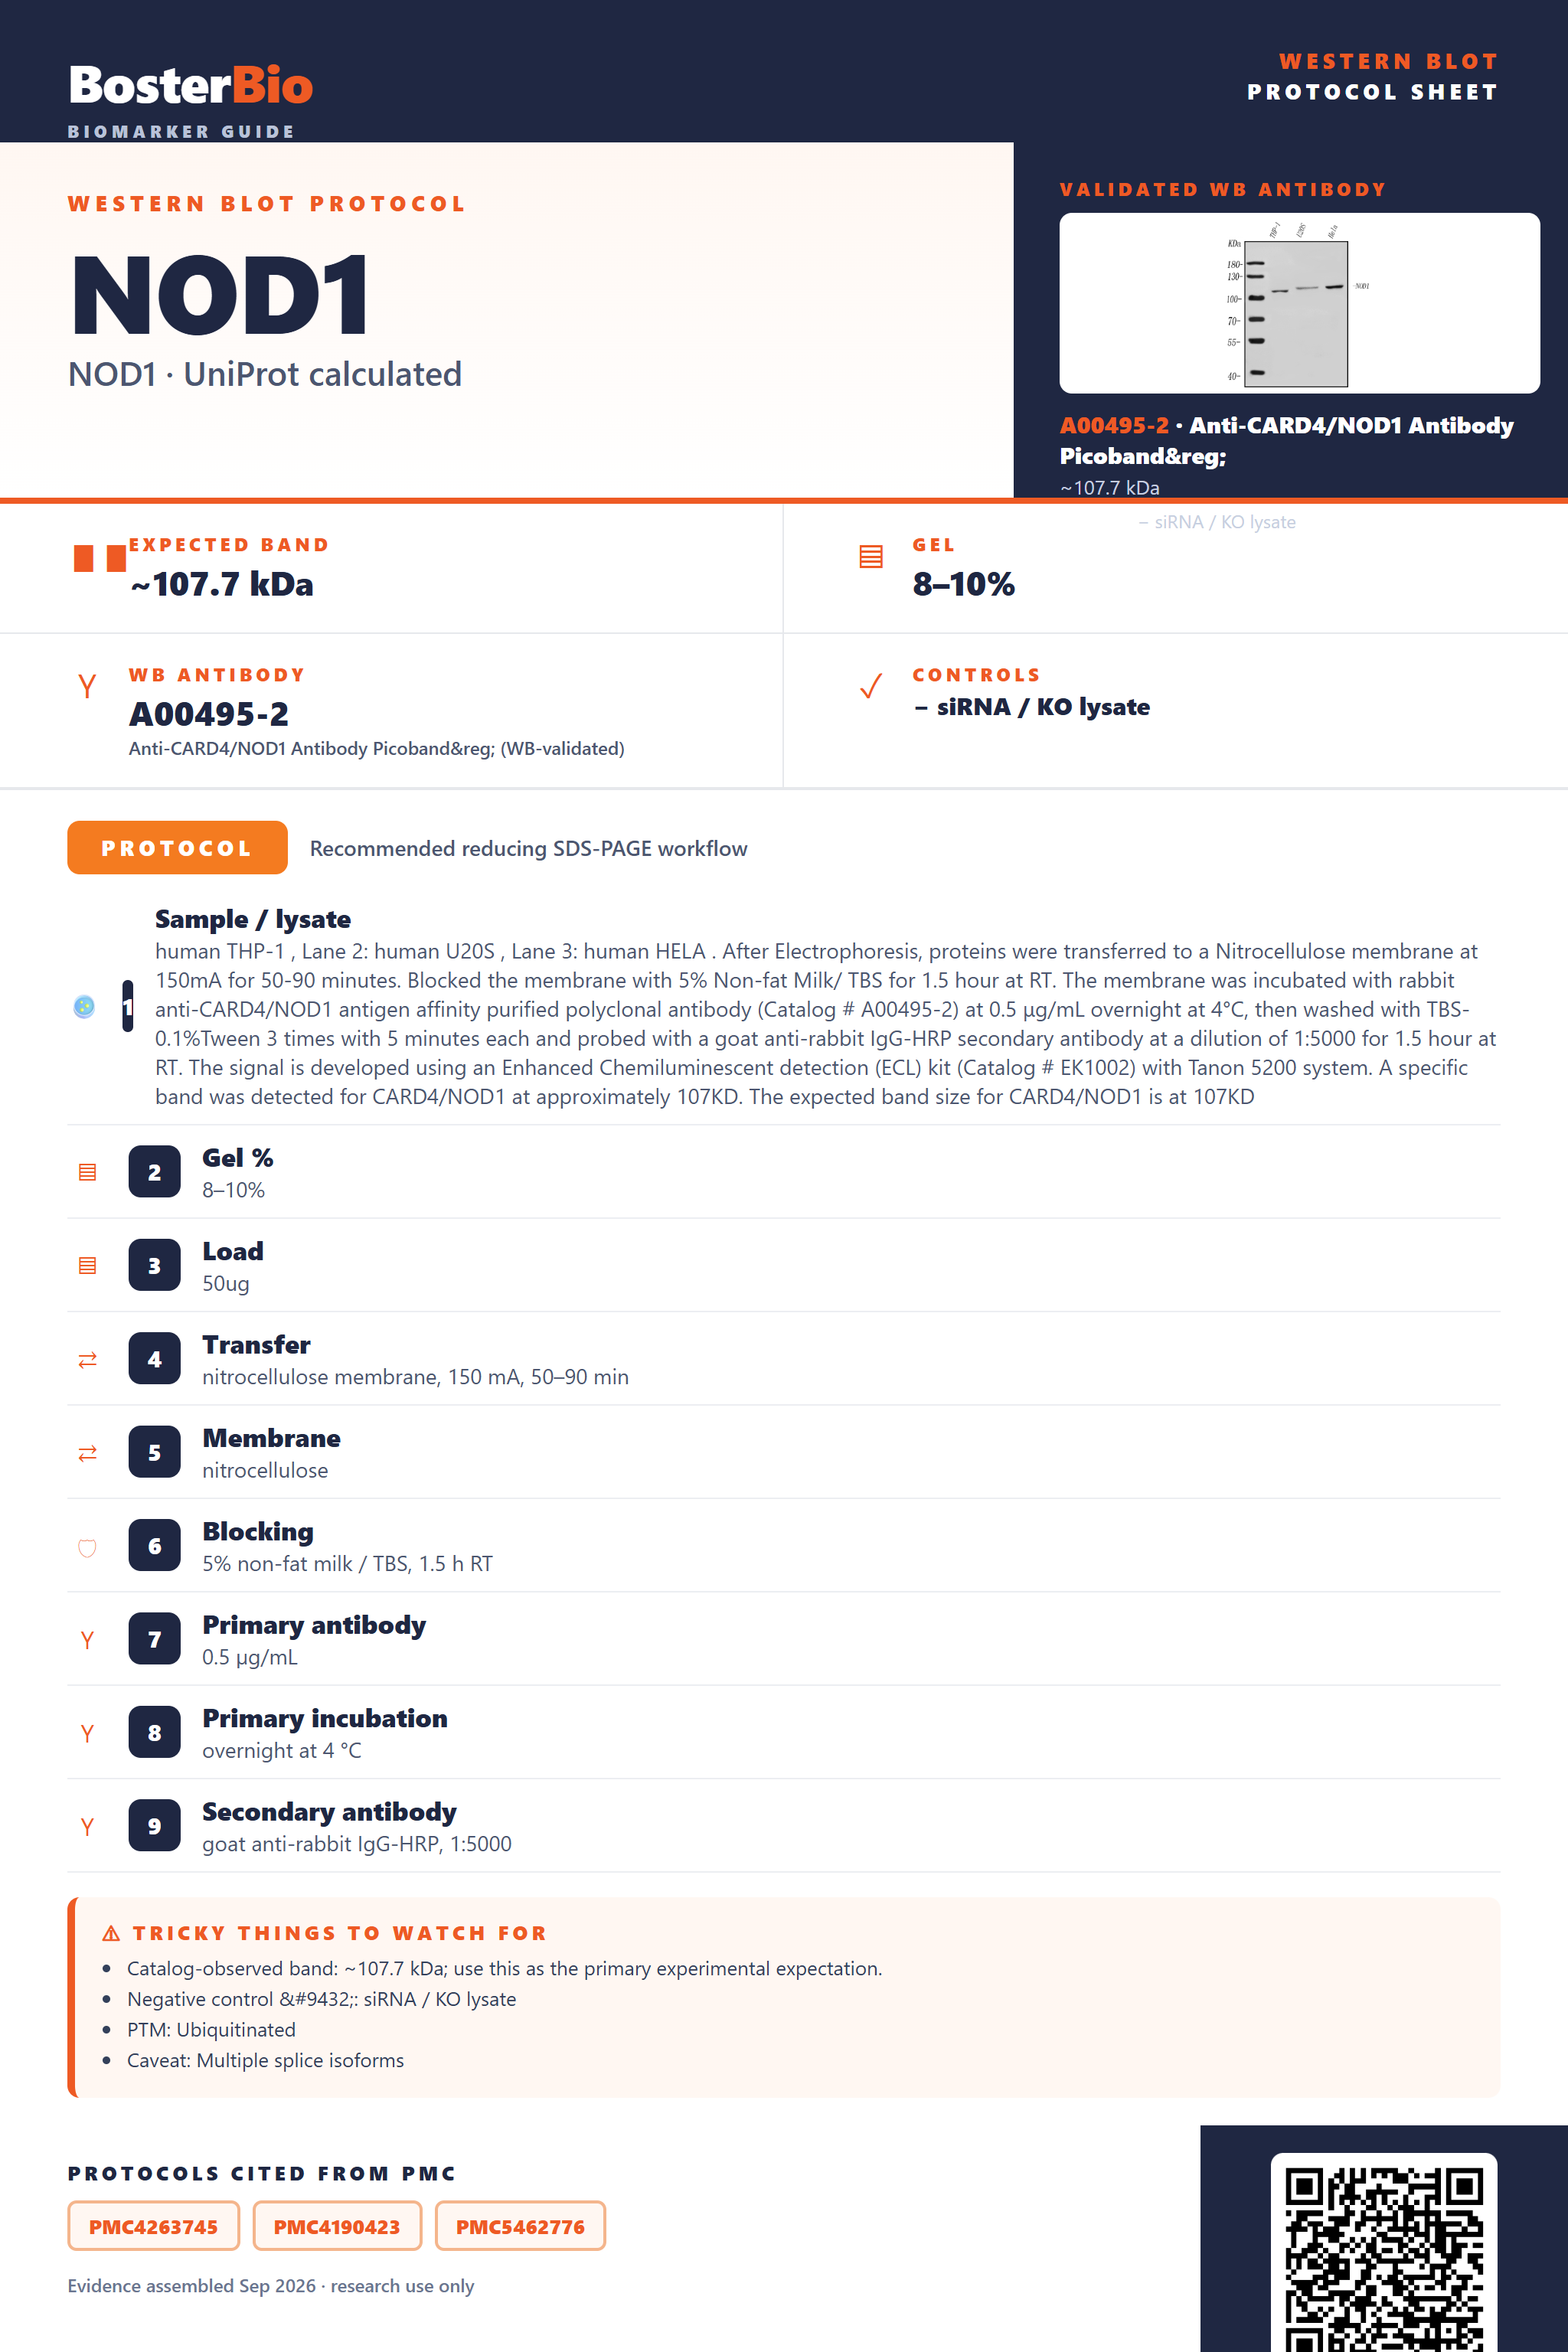
Western blot protocol sheet for NOD1: expected band ~107.7 kDa, antibody A00495-2, and PMC-cited SDS-PAGE protocol steps
NOD1 Western blot protocol sheet — expected band ~107.7 kDa, antibody A00495-2, controls and PMC citations. Open the full NOD1 WB guide →

NOD1 Western Blot Experimental Design Guide

Expected bands, validated protocols, controls and antibodies — the at-a-glance facts below, then the full design guide.

Must know before running
Expected band ~107.7 kDa
Observed band ~107 kDa
Gel 8–10%
Negative control ⓘ siRNA / KO lysate
Important caveats
Reasons your observed band may differ from the expected size.
PTM Ubiquitinated
Caveat Multiple splice isoforms
Regulation IFNγ up
Isoform 3 isoform(s)
Section 1

Real Curated NOD1 Western Blot Protocols

Literature-validated Western blot parameters for NOD1 — gel percentage, transfer, blocking, antibody incubation and detection, extracted from published methods.

Recommended Western blot protocol parameters
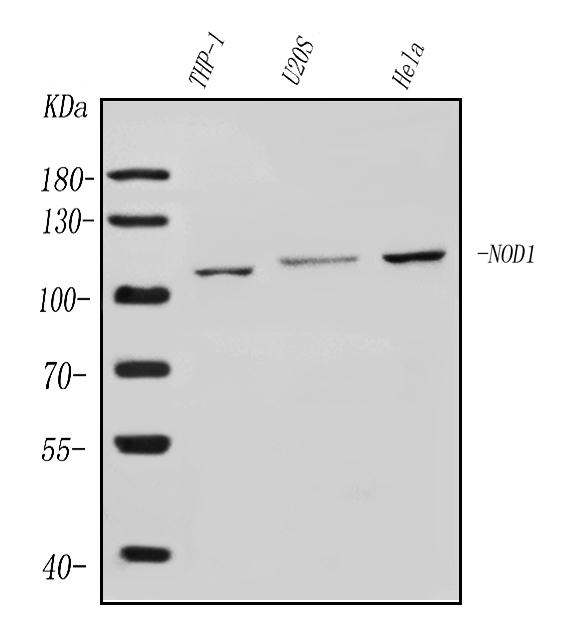
Sample / lysatehuman THP-1 , Lane 2: human U20S , Lane 3: human HELA . After Electrophoresis, proteins were transferred to a Nitrocellulose membrane at 150mA for 50-90 minutes. Blocked the membrane with 5% Non-fat Milk/ TBS for 1.5 hour at RT. The membrane was incubated with rabbit anti-CARD4/NOD1 antigen affinity purified polyclonal antibody (Catalog # A00495-2) at 0.5 μg/mL overnight at 4°C, then washed with TBS-0.1%Tween 3 times with 5 minutes each and probed with a goat anti-rabbit IgG-HRP secondary antibody at a dilution of 1:5000 for 1.5 hour at RT. The signal is developed using an Enhanced Chemiluminescent detection (ECL) kit (Catalog # EK1002) with Tanon 5200 system. A specific band was detected for CARD4/NOD1 at approximately 107KD. The expected band size for CARD4/NOD1 is at 107KD
Gel %8–10%
Load50ug
Transfernitrocellulose membrane, 150 mA, 50–90 min
Membranenitrocellulose
Blocking5% non-fat milk / TBS, 1.5 h RT
Primary antibody0.5 µg/mL
Primary incubationovernight at 4 °C
Secondary antibodygoat anti-rabbit IgG-HRP, 1:5000
WashTBS-0.1% Tween, 3 × 5 min
DetectionECL
Exposure / imagingTanon 5200
Observed band107 kDa
Section 2

What Is the Expected NOD1 Western Blot Band Size?

NOD1's 107.7 kDa predicted mass matches its ~107 kDa observed band, since it lacks glycosylation, cleavage, or disulfide dimerization that would shift migration.

What am I looking at on my blot?
single sharp band near ~107 kDamatches NOD1's predicted 107.7 kDa mass since there is no signal peptide, propeptide, or glycosylation to shift its apparent size
several bands at differing molecular weightsreflects expression of the three annotated NOD1 splice isoforms rather than degradation
band strongly present in whole-cell lysateconsistent with NOD1's cytoplasmic and membrane-associated localization rather than secretion
faint ladder or smear above the main band, especially after ligand stimulationreflects ubiquitin-like conjugation of NOD1 during innate immune signaling activation
high-molecular-weight complex only under native or non-reducing lysisreflects ligand-induced, non-covalent CARD-CARD homooligomerization that dissociates under standard denaturing SDS-PAGE
smaller fragment bands below the main bandmay reflect caspase-mediated cleavage of NOD1 during apoptotic signaling
💡Expected NOD1 appearanceExpect a single band at approximately 107 kDa in whole-cell lysate, matching NOD1's predicted 107.7 kDa mass since it has no signal peptide, glycosylation, or disulfide-linked dimerization to shift its size.
How each factor affects band size
predicted mass from UniProt107.7 kDa full-length protein with no signal peptide or propeptide cleavage, closely matching the ~107 kDa observed band
absence of glycosylation sitesno glyco-associated upward smear, so the band runs close to the predicted mass
named splice isoforms (1, 2, 3)different isoforms can produce additional bands of relatively smaller or larger apparent size than the canonical form
lipid anchor / palmitoylation (membrane lipoprotein)covalent lipid modification anchors NOD1 to the membrane and can alter extraction efficiency and mobility slightly
ubiquitin-like (Ubl) conjugationligand-activated NOD1 can acquire ubiquitin-like modifications, producing a higher-molecular-weight ladder or smear above the main band
non-covalent homooligomerization (no inter-chain disulfide present)ligand-induced CARD-CARD oligomer complexes typically dissociate to the monomer band under standard reducing SDS-PAGE
Why is my band missing or off?
SituationLikely causeNext action
Multiple bandsthe three annotated NOD1 splice isoforms are co-expressedcompare band pattern to isoform-specific transcript data and confirm which isoform the antibody epitope targets
Band higher than expectedincompletely dissociated ligand-induced homooligomer complexes or ubiquitin-like conjugation adding massensure complete denaturation with SDS and reducing agent, and compare unstimulated versus ligand-stimulated lysates
Weak or no signalNOD1 is a low-abundance cytoplasmic and membrane-associated innate immune sensorincrease total protein loading or enrich by immunoprecipitation before blotting
Fragments below expected sizecaspase-mediated cleavage of NOD1 during apoptotic signalinginclude protease and caspase inhibitors in lysis buffer and keep samples cold throughout preparation
Broad smear instead of sharp bandheterogeneous ubiquitin-like conjugation of NOD1 following pathway activationcompare resting versus stimulated lysates and consider a deubiquitinase treatment control
No band in lysatethe palmitoylated, membrane lipid-anchored pool of NOD1 is not solubilized by a mild lysis bufferuse a detergent-based lysis buffer to extract the membrane-associated fraction

Sample controls for NOD1 Western blot

🧪For positive controls for NOD1 in Western blot, you can use HCT116 colon epithelial cells, which endogenously express NOD1 and are a standard model for innate immune signaling studies.
Positive control: HCT116 colon epithelial cells
Negative control: ubiquitously expressed; use siRNA knockdown or KO line
Loading controls: Run GAPDH and β-actin blots alongside a total-protein stain (stain-free gel, Ponceau S, or REVERT) as loading controls.
⚠️Feasibility: NOD1 localizes to the cell membrane and cytoplasm and is broadly expressed across epithelial and immune cell types, so no clean negative tissue is available—confirm specificity with siRNA knockdown or a NOD1-KO line.

Comprehensive Human Protein Atlas IHC scoring per tissue. Rows are taken directly from the HPA tissue chart — click any row's HPA link to view the source.

Positive expression · recommended positive controls

TissueCell typeLevelEvidenceSource

Undetected expression · recommended negative controls

TissueCell typeLevelEvidenceSource
Section 3

Advanced NOD1 Western Blot Tips

Deeper troubleshooting and optimisation questions for NOD1, answered from its protein features.

Does the observed NOD1 band match its predicted mass?
Yes. Predicted mass is 107.7 kDa and the observed band runs at ~107 kDa, an excellent match. NOD1 has no signal peptide, propeptide, or glycosylation sites to add mass, so migration should track close to the calculated molecular weight on a standard SDS-PAGE gel.
Could NOD1 isoforms produce extra bands on blots?
NOD1 has three annotated isoforms from alternative splicing. Antibodies raised against shared regions may detect faint additional bands below the main ~107 kDa species. Confirm isoform identity against reference sequences and note that not all antibodies recognize every splice variant equally.
How does ligand-induced oligomerization affect NOD1 detection?
NOD1 homooligomerizes upon ligand binding and recruits RIPK2 via CARD-CARD interaction. If samples are incompletely denatured or reduced, higher-order oligomeric complexes may appear as bands above 107 kDa. Use strong reducing/denaturing sample buffer and fresh boiling to resolve a clean monomeric band.
Does ubiquitination affect NOD1 Western blot patterns?
NOD1 undergoes ubiquitin-like conjugation as part of RIPK2-dependent innate immune signaling triggered by bacterial peptidoglycan sensing. Ubiquitinated NOD1 species can appear as smeared or higher-MW bands above the 107 kDa monomer, particularly in samples with active pathogen or cytokine stimulation.
What blocking approach suits NOD1 detection?
NOD1 has zero annotated glycosylation sites, so glycoprotein-specific blocking agents are unnecessary. Standard 5% non-fat milk or BSA in TBST is sufficient; BSA is preferable if probing phospho- or Ubl-modified forms, since milk can interfere with modification-specific antibody binding.
What transfer method to use for NOD1 Western blot?
NOD1 is a large (~107 kDa), membrane-associated, palmitoylated protein, so use wet/tank transfer for efficient high-MW protein movement, a lower-percentage gel (6-8%), and extended transfer time. Wet transfer also better preserves lipid-anchored protein transfer efficiency compared to rapid semi-dry systems.
How should NOD1 band intensity be quantitated?
Since NOD1 typically resolves as a single dominant band matching its predicted mass, densitometric quantitation is straightforward. Normalize to total protein stain rather than a single housekeeping gene, since NOD1 expression and activation state can vary with innate immune stimulation.
How to interpret unexpected bands above 107 kDa?
Bands above the ~107 kDa monomer likely reflect ligand-induced homooligomers or Ubl-conjugated species rather than nonspecific binding, given NOD1's known oligomerization and ubiquitination biology. Repeat with fully reducing/denaturing conditions and compare stimulated versus unstimulated lysates to confirm signal-dependent higher-MW species.
Boster reagents

Best NOD1 Western Blot Antibodies

BosterBio's NOD1 antibodies are among the best-performing WB antibodies on the market — well cited, thoroughly validated, and orthogonally cross-validated against negative tissues and complementary methods.

Real WB data Western blot analysis of CARD4/NOD1 using anti-CARD4/NOD1 antibody (A00495-2). Electrophoresis was performed on a 5-20% SDS-PAGE gel at 70V (Stacking gel) / 90V (Resolving gel) for 2-3 hours. The sample well of each lane was loaded with 50ug of sample under reducing conditions. Lane 1: human THP-1 whole cell lysates, Lane 2: human U20S whole cell lysates, Lane 3: human HELA whole cell lysates. After Electrophoresis, proteins were transferred to a Nitrocellulose membrane at 150mA for 50-90 minutes. Blocked the membrane with 5% Non-fat Milk/ TBS for 1.5 hour at RT. The membrane was incubated with rabbit anti-CARD4/NOD1 antigen affinity purified polyclonal antibody (Catalog # A00495-2) at 0.5 μg/mL overnight at 4°C, then washed with TBS-0.1%Tween 3 times with 5 minutes each and probed with a goat anti-rabbit IgG-HRP secondary antibody at a dilution of 1:5000 for 1.5 hour at RT. The signal is developed using an Enhanced Chemiluminescent detection (ECL) kit (Catalog # EK1002) with Tanon 5200 system. A specific band was detected for CARD4/NOD1 at approximately 107KD. The expected band size for CARD4/NOD1 is at 107KD.
Anti-CARD4/NOD1 Antibody Picoband®
Cat # A00495-2
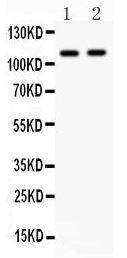
Real WB data Western blot analysis of CARD4 using anti-CARD4 antibody (PB9294). Electrophoresis was performed on a 5-20% SDS-PAGE gel at 70V (Stacking gel) / 90V (Resolving gel) for 2-3 hours. The sample well of each lane was loaded with 50ug of sample under reducing conditions. Lane 1: A549 Whole Cell Lysate, Lane 2: Rat Cardiac Muscle Tissue Lysate. After Electrophoresis, proteins were transferred to a Nitrocellulose membrane at 150mA for 50-90 minutes. Blocked the membrane with 5% Non-fat Milk/ TBS for 1.5 hour at RT. The membrane was incubated with rabbit anti-CARD4 antigen affinity purified polyclonal antibody (Catalog # PB9294) at 0.5 μg/mL overnight at 4°C, then washed with TBS-0.1%Tween 3 times with 5 minutes each and probed with a goat anti-rabbit IgG-HRP secondary antibody at a dilution of 1:10000 for 1.5 hour at RT. The signal is developed using an Enhanced Chemiluminescent detection (ECL) kit (Catalog # EK1002) with Tanon 5200 system. A specific band was detected for CARD4 at approximately 107KD. The expected band size for CARD4 is at 107KD.
Anti-CARD4/NOD1 Antibody Picoband®
Cat # PB9294

Boster's anti-NOD1/CARD4 antibodies are top-performing, extensively cited reagents validated across multiple platforms, with orthogonal confirmation against negative-control tissues and complementary detection methods, giving researchers confident, reproducible Western blot results for NOD1 detection.

Which to pick: Both A00495-2 and PB9294 target CARD4/NOD1 and include real Western blot validation images; choose either for reliable detection, selecting based on your preferred vendor documentation or lot availability since both offer comparable validated WB performance.

Source: BosterBio NOD1 gene-info card — filtered to Western-blot-capable antibodies; each card shows that product's actual WB validation figure.

References

  1. UniProt Consortium. UniProt entry Q9Y239.
  2. Human Protein Atlas. NOD1 tissue expression.