This website uses cookies to ensure you get the best experience on our website.


- Table of Contents
Plan OAS2 staining in paraffin sections using the reported nuclear and cytoplasmic tissue pattern (HPA tissue IHC). The guide covers fixation consistency, antibody dilution of 1:100–1:300 (datasheet), and interpretation in light of interferon-induced expression (UniProt).

Expected localisation, validated protocols, controls and antibodies — the at-a-glance facts below, then the full design guide.
| Expected localisation | Nuclear and cytoplasmic tissue staining (HPA tissue IHC) | |
| Staining pattern | Nuclear and cytoplasmic staining across cell types (HPA tissue IHC) | |
| Antigen retrieval | Citrate pH 6.0 HIER, 95–98 °C, 20 min (rule: cytoplasmic / membrane antigen) | |
| Positive control | Appendix+4 more · see all | |
| Negative control | None in HPA (detected in all 45 tissues); use no-primary + isotype controls |
| Fixation | Keep fixation consistent across paraffin sections (standard IHC practice; not target-specific) | |
| Caveat | Antibody staining and RNA show medium consistency (HPA tissue IHC) | |
| Regulation | Interferon-induced expression (UniProt) | |
| Isoform / epitope | Three isoforms; epitope coverage needs validation (UniProt) |
The catalog antibody’s IHC-P protocol is accompanied by three published OAS2 IHC workflows (PMC10187978; PMC9510761; PMC11483074).
| Sample | Paraffin-embedded human uterus tissue; fixative not specified (datasheet A01878) |
| Fixation | Image fixative and duration unreported (datasheet A01878); verify before use. |
| Sectioning | 4–5 µm sections on charged slides (standard) |
| Deparaffinisation | Xylene, graded ethanol series to water (standard) |
| Antigen retrieval | Heat-induced epitope retrieval in citrate buffer, pH 6.0, 20 min at 95–98 °C (standard rule: cytoplasmic / membrane antigen) |
| Peroxidase block | 3% H2O2, 10 min, room temperature (standard) |
| Blocking | 10% normal serum of the secondary host, 30 min, room temperature (standard) |
| Primary antibody | Rabbit anti-OAS2, 1:100-1:300 (datasheet A01878) |
| Primary incubation | Overnight at 4 °C (standard) |
| Detection | HRP-polymer secondary, DAB chromogen 5–10 min (standard) |
| Counterstain | Hematoxylin, blue, dehydrate and mount (standard) |
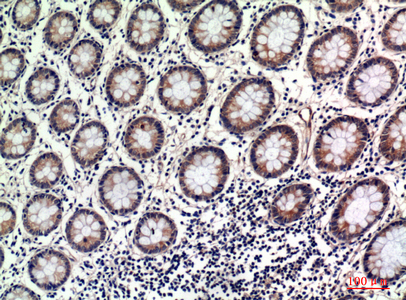
| Expected result | OAS2-positive staining in glandular cells of appendix (HPA tissue IHC: High). HPA tissue profile: General nuclear and cytoplasmic expression. No signal in the no-primary control. |
In paraffin-section IHC, expect OAS2 staining in the cytoplasm, often around the nucleus, with possible nuclear staining (UniProt P29728 localisation; HPA: general nuclear and cytoplasmic expression). High-staining examples include appendix glandular cells, bone-marrow hematopoietic cells and colon endothelial cells (HPA tissue IHC). OAS2 has no transmembrane segment (UniProt P29728 topology). HPA rates its tissue IHC profile Approved, with medium consistency between staining and RNA expression (HPA tissue IHC).
| Cell-associated cytoplasmic staining, sometimes perinuclear, in the expected cells; nuclear staining may accompany it. | This fits the reported cytoplasmic and perinuclear localisation (UniProt P29728 localisation) and the general nuclear and cytoplasmic tissue profile (HPA tissue IHC). Score the cell type and compartment together; the tissue profile does not require every positive cell to show identical nuclear intensity. |
| Staining is confined to luminal material or extracellular space, with no convincing signal inside cells. | That distribution does not match the reported intracellular localisation (UniProt P29728 localisation; HPA tissue IHC). Treat it as a possible artefact and review morphology, reagent controls and whether the signal persists where cells are intact. Do not classify nuclear staining alone as a wrong compartment: HPA reports nuclear expression (HPA tissue IHC). |
| Strong signal appears mainly in an unexpected cell population, while the expected cells are weak. | Compare the stained cells with the specified HPA cell types, rather than judging the whole tissue as positive (HPA tissue IHC). A mismatch warrants checks for antibody cross-reactivity or detection-system activity; HPA's Approved rating has only medium staining–RNA consistency and does not validate every cell on a new slide (HPA tissue IHC). |
| Pale, widespread colour obscures cell boundaries and the intended intracellular pattern. | This is difficult to score as OAS2. In chromogenic IHC, nonspecific antibody binding, incomplete blocking, residual detection activity or overly concentrated reagents can create diffuse background (general IHC practice). Reassess the pattern only after the control and background signal allow individual cells to be identified. |
| No staining is visible in a selected HPA high-staining cell population. | A technical false negative is possible, but an HPA High entry is an observed cell-specific pattern, not a guarantee for every section or antibody (HPA tissue IHC). Confirm that the chosen cells are present, then review the catalog antibody's IHC-P instructions, detection controls and section quality before interpreting absence. |
| Cell choice and scoring | HPA lists High staining in appendix and duodenum glandular cells, bone-marrow hematopoietic cells, caudate glia, cerebellar granular-layer cells, cerebral-cortex and colon endothelium, and cervical squamous epithelium (HPA tissue IHC). Select and score the named cells within the section; neighbouring cells are not interchangeable positive controls. |
| Evidence strength and antibody choice | The tissue profile is Approved with medium staining–RNA consistency (HPA tissue IHC). CAB024984 has IHC Approved status, while HPA003320 has ICC Approved status with no IHC status supplied (HPA antibody records). Those labels support application-specific interpretation; they do not establish identical patterns across antibodies. |
| Intracellular distribution | UniProt places OAS2 in the cytoplasm, perinuclear region and Golgi apparatus membrane and reports no transmembrane segment (UniProt P29728 localisation/topology). HPA describes general nuclear and cytoplasmic tissue staining (HPA tissue IHC). Record those observations separately if nuclear and cytoplasmic scores differ. |
| Isoforms and induction | UniProt lists three isoforms—p71, p69 and isoform 3—and describes OAS2 as interferon-induced (UniProt P29728). The supplied records do not map this antibody's epitope to an isoform or specify an induction state for the HPA sections. Avoid attributing a staining difference to either mechanism without separate evidence. |
| Can the ICC-IF result set the IHC pattern? | HPA reports an approved centrosome location in ICC-IF images from SK-MEL-30 (HPA subcellular ICC-IF). Treat this as an application-specific observation: it does not establish that centrosomes must resolve in chromogenic paraffin-section IHC, whose tissue profile is general nuclear and cytoplasmic (HPA tissue IHC). |
| Situation | Likely cause | Next action |
|---|---|---|
| Expected cells are unstained, but the section has usable morphology. | The named positive cells may be absent from the sampled area, or the IHC procedure may have lost detectable signal; HPA High is cell-specific (HPA tissue IHC). | Verify the cell population on the counterstain and compare a documented positive section. Review the catalog antibody's IHC-P instructions and detection controls before changing conditions (general IHC practice). |
| Both tissue and negative-control areas show broad chromogenic colour. | Background may arise from nonspecific binding or endogenous detection activity, depending on the chromogen system (general IHC practice). | Inspect reagent-omission controls, blocking and wash steps; address endogenous peroxidase if using an HRP system (general IHC practice). Do not assign the broad colour to OAS2. |
| Colour is concentrated in lumens, debris or torn section edges. | Trapped reagent or precipitate can mimic a positive signal (general IHC practice); these sites do not match the reported intracellular distribution (UniProt P29728 localisation). | Compare intact cells away from damaged areas and examine a detection control. Score only interpretable cell-associated staining (general IHC practice). |
| A different cell type dominates the stain in a chosen positive tissue. | The selected region may not contain the HPA-listed positive cells, or the signal may reflect cross-reactivity or background (HPA tissue IHC; general IHC practice). | Identify the named cell population on the counterstain, then compare its signal with a reagent control and a second suitable section. Record the cell-type mismatch rather than calling the tissue uniformly positive. |
| Nuclear signal seems stronger than cytoplasmic signal. | HPA reports general nuclear and cytoplasmic expression, while UniProt also reports cytoplasmic and perinuclear localisation (HPA tissue IHC; UniProt P29728 localisation). | Score nuclear and cytoplasmic compartments separately and check whether the signal stays within intact cells. Nuclear colour alone is insufficient grounds to reject the stain (HPA tissue IHC). |
| A centrosomal punctum is absent from paraffin-section IHC. | The approved centrosome finding comes from ICC-IF, whereas the supplied tissue IHC profile describes general nuclear and cytoplasmic expression (HPA subcellular ICC-IF; HPA tissue IHC). | Judge the paraffin section against its cell-type and intracellular tissue pattern. Do not require a visible centrosomal punctum for an IHC positive call (HPA tissue IHC). |


Comprehensive Human Protein Atlas IHC scoring per tissue (reliability: Approved — Medium consistency between antibody staining and RNA expression data.). Rows are taken directly from the HPA tissue chart — click any row's HPA link to view the source.
| Tissue | Cell type | Level | Evidence | Source |
|---|---|---|---|---|
| Appendix | Glandular cells | High | Protein (IHC) | HPA → |
| Bone marrow | Hematopoietic cells | High | Protein (IHC) | HPA → |
| Caudate | Glial cells | High | Protein (IHC) | HPA → |
| Cerebellum | Cells in granular layer | High | Protein (IHC) | HPA → |
| Cerebral cortex | Endothelial cells | High | Protein (IHC) | HPA → |
| Tissue | Cell type | Level | Evidence | Source |
|---|---|---|---|---|
| None in HPA: OAS2 is detected in all 45 scored tissues. Use a no-primary (secondary-only) and an isotype control instead. | ||||
Troubleshoot OAS2 staining in paraffin section chromogenic IHC using the catalog antibody’s image, the page retrieval setting, and independent localisation evidence.
A01878 is listed for IHC and IF in human, mouse and rat (catalog: applications; reactivity). Its IHC image shows a paraffin-embedded human uterus section (A01878 IHC image caption).
A01878 has an IHC image of paraffin-embedded human uterus at 1:100 (A01878 IHC image caption). IF is listed, but no IF image is supplied (catalog: applications; IF image alts).
Which to pick: Choose A01878 for paraffin-section IHC: its image shows human uterus at 1:100, within the listed 1:100–1:300 IHC range (A01878 IHC image caption; catalog: IHC dilution). For IF, A01878 is listed at 1:50; ICC validation and an IF image are unreported (catalog: applications; IF dilution; IF image alts). A01878 also lists mouse and rat reactivity, though its IHC image shows human tissue; the antibody is rabbit-hosted, clonality is unreported, and the image caption does not specify a fixative (catalog: reactivity; host; clone; A01878 IHC image caption).