This website uses cookies to ensure you get the best experience on our website.


- Table of Contents
Plan OMA1 staining in paraffin sections using kidney tubules as a high-staining reference (HPA tissue IHC). This guide covers fixation consistency, antigen retrieval, chromogenic detection and interpretation of the cytoplasmic tissue pattern (HPA tissue IHC; datasheet A06260).

Expected localisation, validated protocols, controls and antibodies — the at-a-glance facts below, then the full design guide.
| Expected localisation | Cytoplasmic staining (HPA tissue IHC); mitochondrial inner membrane (UniProt) | |
| Staining pattern | Cytoplasmic staining in several tissues (HPA tissue IHC) | |
| Antigen retrieval | EDTA pH 8.0 HIER, heat-mediated (datasheet A06260) | |
| Positive control | Kidney+4 more · see all | |
| Negative control | Adipose tissue+4 more · see all |
| Fixation | Keep fixation consistent across sections (standard IHC practice; not target-specific) | |
| Caveat | Skeletal myocytes undetected despite reported strong expression (HPA tissue IHC; UniProt) | |
| Regulation | Stress activates OMA1; staining effect unknown (UniProt) | |
| Isoform / epitope | 2 isoforms; precursor processing may affect epitopes (UniProt) |
The catalog antibody specifies heat retrieval with EDTA pH 8.0 (datasheet A06260). The published OMA1 IHC protocols below used heart tissue and osteosarcoma specimens (PMC6038665; PMC10102293).
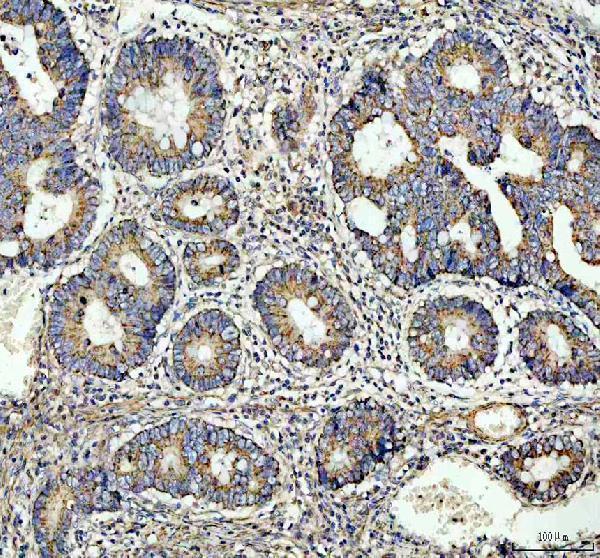
| Sample | Paraffin-embedded human colon cancer tissue; fixative not specified (datasheet A06260) |
| Fixation | Image fixative and duration unreported (datasheet A06260); verify before use. |
| Sectioning | 4–5 µm sections on charged slides (standard) |
| Deparaffinisation | Xylene, graded ethanol series to water (standard) |
| Antigen retrieval | Heat retrieval: EDTA pH 8.0 (datasheet A06260); 20 min, 95–100 °C (standard) |
| Peroxidase block | 3% H2O2, 10 min, room temperature (standard) |
| Blocking | 10% goat serum (datasheet A06260) |
| Primary antibody | Rabbit anti-OMA1, 2-5 μg/ml (datasheet A06260) |
| Primary incubation | Overnight at 4 °C (datasheet A06260) |
| Detection | HRP-conjugated secondary, DAB chromogen (datasheet A06260) |
| Counterstain | Hematoxylin, blue, dehydrate and mount (standard) |
| Expected result | OMA1-positive staining in cells in tubules of kidney (HPA tissue IHC: High). HPA tissue profile: Cytoplasmic expression in several tissues. No signal in the no-primary control. |
OMA1 is an inner mitochondrial membrane protein with a transmembrane segment at residues 196–216 (UniProt Q96E52 topology). In paraffin tissue sections, expect predominantly cytoplasmic staining, strongest in kidney tubule cells and moderate in several epithelial and hematopoietic populations (HPA tissue IHC). HPA rates its tissue staining Approved, with medium consistency between antibody staining and RNA expression; interpret intensity in that context (HPA tissue IHC).
| Kidney tubule cells show strong cytoplasmic chromogen, while nearby cells vary in intensity. | This fits the reported High tubule-cell signal and broader cytoplasmic tissue profile (HPA tissue IHC). The visible cytoplasmic pattern is compatible with mitochondrial OMA1, although chromogenic IHC alone cannot resolve the inner membrane (UniProt Q96E52 localization; standard IHC practice). |
| The apparent positive result is confined to nuclei, with little cytoplasmic staining in a tissue section. | Recheck specificity and morphology: tissue IHC is described as cytoplasmic (HPA tissue IHC). Nuclear staining is not automatically impossible, since HPA also reports approved nucleoplasmic localization in ICC-IF; that observation should not be treated as a tissue IHC pattern (HPA subcellular ICC-IF). |
| Strong staining appears in adipocytes or skeletal-muscle myocytes. | These cell types were Not detected in HPA tissue IHC, so assess cross-reactivity and endogenous detection activity before scoring them positive (HPA tissue IHC; standard IHC practice). Skeletal muscle deserves particular caution because UniProt reports strong tissue expression, creating a source-level discrepancy rather than proof that either result is universal (UniProt Q96E52 tissue specificity). |
| Color spreads evenly across tissue and empty spaces, obscuring cell boundaries. | That distribution does not resemble HPA's cellular, cytoplasmic profile (HPA tissue IHC). Review background controls, blocking, washes and chromogen development as general IHC checks; the supplied sources do not identify an OMA1-specific cause (standard IHC practice). |
| Kidney tubule cells show no convincing signal while the slide's controls are readable. | A negative result conflicts with the reported High tubule-cell staining (HPA tissue IHC). Check staining-run performance and antibody suitability before inferring absence of OMA1; HPA's Approved rating has only medium staining-to-RNA consistency (HPA tissue IHC; standard IHC practice). |
| Compartment and topology | OMA1 is assigned to the mitochondrial inner membrane, with matrix-facing residues 144–195, a membrane segment at 196–216 and an intermembrane-space region from residue 217 onward (UniProt Q96E52 topology). This supports a mitochondrial interpretation of cytoplasmic signal but does not establish where the antibody binds. |
| Cell-specific reference staining | HPA reports High staining in kidney tubule cells and Medium staining in appendix, colon and duodenum glandular cells, among other listed populations (HPA tissue IHC). Compare like cell types when assessing intensity; a whole-organ label can hide differences between cells. |
| Negative-reference limits | HPA lists adipocytes, skeletal-muscle myocytes and several other specified cell types as Not detected (HPA tissue IHC). These are observations for named cells, not a claim that every cell in those organs lacks OMA1. UniProt separately reports strong skeletal-muscle expression (UniProt Q96E52 tissue specificity). |
| Antibody-validation scope | The listed antibody, HPA055120, is Approved for IHC and ICC, while the overall tissue profile has medium staining-to-RNA consistency (HPA antibodies; HPA tissue IHC). The supplied record does not report an Enhanced IHC validation, so an unexpected pattern needs independent review. |
| Processing and isoforms | UniProt records 2 isoforms and a chain beginning at residue 144, with a propeptide at residues 14–143 (UniProt Q96E52 processing and isoforms). The supplied sources do not locate the antibody epitope or show how these forms alter tissue staining; do not assign a specific staining pattern to either form. |
| Situation | Likely cause | Next action |
|---|---|---|
| Kidney tubules are blank or much weaker than expected. | The result disagrees with HPA's High tubule-cell reference, but the source does not identify a target-specific failure mechanism (HPA tissue IHC). | Verify the positive-control section, detection reagents and staining run; then review the antibody's documented IHC conditions (standard IHC practice). Treat any retrieval adjustment as a general optimization, not a proven OMA1 fixation effect. |
| Most tissue compartments show equally strong color. | An indiscriminate pattern is difficult to reconcile with HPA's cell-dependent levels and cytoplasmic profile (HPA tissue IHC). General background or detection activity may contribute (standard IHC practice). | Compare a no-primary control, inspect tissue edges and empty areas, and review blocking, washes and development time (standard IHC practice). Re-score only identifiable cells after background is controlled. |
| The stain is nuclear-only in paraffin tissue. | HPA tissue IHC describes cytoplasmic expression, whereas approved nucleoplasmic localization comes from ICC-IF images (HPA tissue IHC; HPA subcellular ICC-IF). | Check the hematoxylin counterstain and cell boundaries, then compare the IHC pattern with a suitable control (standard IHC practice). Do not transfer an ICC-IF compartment call directly to paraffin-section scoring. |
| Adipocytes or skeletal-muscle myocytes stain strongly. | Both are Not detected in HPA's named-cell tissue observations; UniProt's strong skeletal-muscle expression makes the muscle result especially source-dependent (HPA tissue IHC; UniProt Q96E52 tissue specificity). | Confirm cell identity, examine no-primary background and seek independent specificity evidence before accepting the signal (standard IHC practice). Record the HPA–UniProt discrepancy when interpreting skeletal muscle. |
| Moderate staining in glandular cells is called negative because it is weaker than kidney. | HPA reports Medium glandular-cell staining in appendix, colon and duodenum, versus High staining in kidney tubule cells (HPA tissue IHC). | Score intensity within the identified cell population and compare with its tissue reference under the same staining run (HPA tissue IHC; standard IHC practice). Preserve the distinction between moderate signal and absence. |
| Does an IF/ICC image showing nuclear signal invalidate cytoplasmic IHC? | HPA approves both nucleoplasmic and mitochondrial ICC-IF localization, while its tissue IHC summary says cytoplasmic expression (HPA subcellular ICC-IF; HPA tissue IHC). | Interpret each application against its own HPA observations. For paraffin IHC, assess the cell-specific cytoplasmic pattern; use the separate IF/ICC guide for fluorescence interpretation (HPA tissue IHC; HPA subcellular ICC-IF). |


Comprehensive Human Protein Atlas IHC scoring per tissue (reliability: Approved — Medium consistency between antibody staining and RNA expression data.). Rows are taken directly from the HPA tissue chart — click any row's HPA link to view the source.
| Tissue | Cell type | Level | Evidence | Source |
|---|---|---|---|---|
| Kidney | Cells in tubules | High | Protein (IHC) | HPA → |
| Appendix | Glandular cells | Medium | Protein (IHC) | HPA → |
| Bone marrow | Hematopoietic cells | Medium | Protein (IHC) | HPA → |
| Bronchus | Respiratory epithelial cells | Medium | Protein (IHC) | HPA → |
| Colon | Glandular cells | Medium | Protein (IHC) | HPA → |
| Tissue | Cell type | Level | Evidence | Source |
|---|---|---|---|---|
| Adipose tissue | Adipocytes | Not detected | Protein (IHC) | HPA → |
| Caudate | Glial cells | Not detected | Protein (IHC) | HPA → |
| Cerebellum | Cells in granular layer | Not detected | Protein (IHC) | HPA → |
| Hippocampus | Glial cells | Not detected | Protein (IHC) | HPA → |
| Lymph node | Germinal center cells | Not detected | Protein (IHC) | HPA → |
Troubleshoot OMA1 staining in paraffin sections by checking retrieval, compartment, tissue controls, and scoring before interpreting chromogenic signal.
The catalog antibody has IHC data from human paraffin sections and IF data from human cells; its listed reactivity includes human, mouse, and rat (A06260 catalog; image captions).
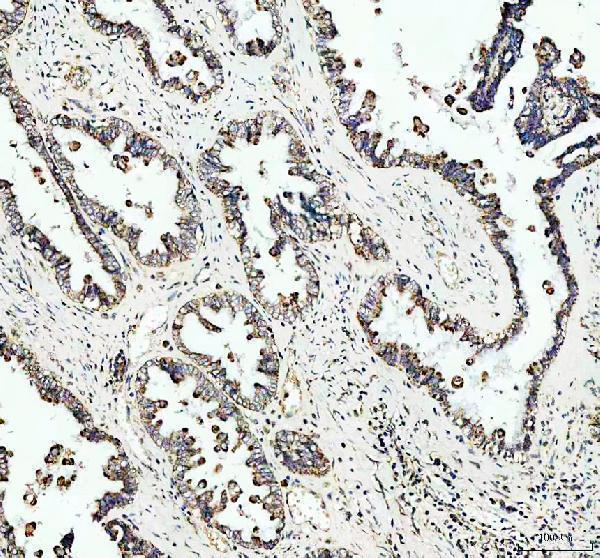
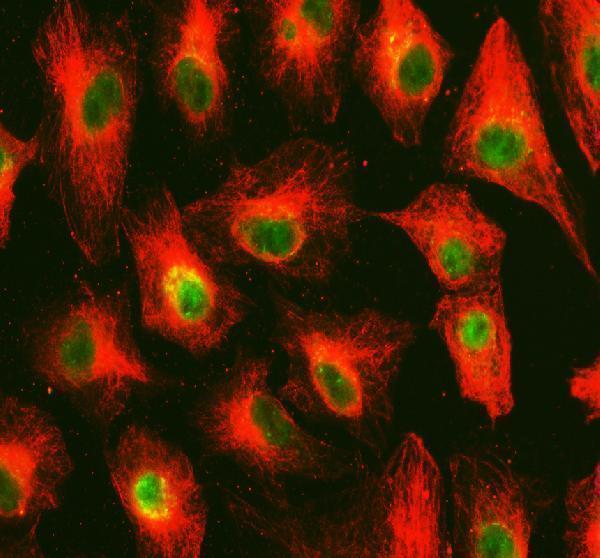
A06260 has IHC images from paraffin sections of human colon and ovarian cancers (A06260 IHC captions). A06260 also has an IF image from A549 cells and lists IHC, IF, and ICC among its applications (A06260 IF caption; catalog applications).
Which to pick: For tissue IHC, choose A06260: its IHC captions document paraffin sections, EDTA retrieval at pH 8.0, and primary antibody at 2 μg/ml (A06260 IHC captions); the fixative is unreported (A06260 IHC captions). For IF/ICC, the same SKU has an A549 cell IF image using 5 μg/ml primary antibody (A06260 IF caption). For mouse or rat samples, A06260 lists reactivity with both species, but the supplied IHC and IF images show human samples; clonality is unreported (A06260 catalog reactivity; image captions; catalog clone field).