This website uses cookies to ensure you get the best experience on our website.


- Table of Contents
Plan OPA1 staining in paraffin sections around the granular cytoplasmic pattern seen in most tissues (HPA tissue IHC). Use the IHC-validated antibody and assess cell-specific signal against the expected tissue pattern (HPA tissue IHC).

Expected localisation, validated protocols, controls and antibodies — the at-a-glance facts below, then the full design guide.
| Expected localisation | Granular cytoplasm (HPA tissue IHC) | |
| Staining pattern | Granular cytoplasmic staining in most tissues (HPA tissue IHC) | |
| Antigen retrieval | EDTA pH 8.0 HIER, heat-mediated (datasheet PB9731) | |
| Positive control | Appendix+4 more · see all | |
| Negative control | Adipose tissue |
| Fixation | Keep fixation consistent across sections. (standard IHC practice; not target-specific) | |
| Caveat | Staining has medium concordance with RNA (HPA tissue IHC) | |
| Regulation | Low tissue specificity (HPA tissue RNA) | |
| Isoform / epitope | Six isoforms; long and cleaved short forms may differ at an unknown epitope (UniProt) |
The catalog antibody has an IHC-P protocol; the published options below report OPA1 staining in heart tissue (PMC9110818) and tissue sections (PMC5555107).
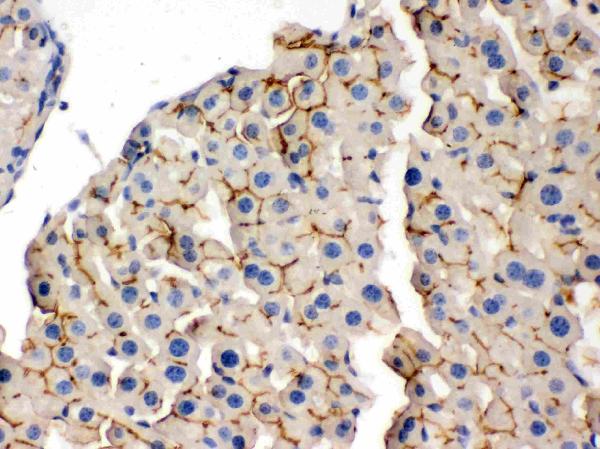
| Sample | Paraffin-embedded Mouse Liver tissue; fixative not specified (datasheet PB9731) |
| Fixation | Image fixative and duration unreported (datasheet PB9731); verify before use. |
| Sectioning | 4–5 µm sections on charged slides (standard) |
| Deparaffinisation | Xylene, graded ethanol series to water (standard) |
| Antigen retrieval | Heat retrieval: EDTA pH 8.0 (datasheet PB9731); 20 min, 95–100 °C (standard) |
| Peroxidase block | 3% H2O2, 10 min, room temperature (standard) |
| Blocking | 10% goat serum (datasheet PB9731) |
| Primary antibody | Rabbit anti-OPA1, 0.5-1μg/ml (datasheet PB9731) |
| Primary incubation | Overnight at 4 °C (datasheet PB9731) |
| Detection | Streptavidin-biotin complex (SABC), DAB chromogen (datasheet PB9731) |
| Counterstain | Hematoxylin, blue, dehydrate and mount (standard) |
| Expected result | OPA1-positive staining in glandular cells of appendix (HPA tissue IHC: High). HPA tissue profile: Cytoplasmic expression with a granular pattern in most tissues. No signal in the no-primary control. |
OPA1 is an inner mitochondrial membrane protein with a form in the intermembrane space (UniProt O60313 topology and processing). In paraffin section IHC, expect granular cytoplasmic staining in many tissues, including strong staining in heart cardiomyocytes and kidney tubular cells (HPA tissue IHC). HPA rates the tissue pattern Supported, with medium consistency between antibody staining and RNA expression (HPA tissue IHC).
| Granular cytoplasmic signal in cardiomyocytes or kidney tubular cells, with limited surrounding background. | This matches HPA's reported High staining in those cells and its granular cytoplasmic pattern across most tissues (HPA tissue IHC). Granules are consistent with mitochondrial localization, although chromogenic IHC does not resolve the inner membrane or intermembrane space (UniProt O60313 topology; general IHC practice). |
| Predominantly nuclear signal in a paraffin section, with little granular cytoplasmic signal. | This does not match HPA's usual tissue IHC pattern; check whether the signal is specific before scoring it as OPA1 (HPA tissue IHC; general IHC practice). Nuclear staining cannot be dismissed solely by location: HPA reports approved nucleoplasmic localization in ICC-IF (HPA subcellular ICC-IF). |
| Strong staining confined to a cell type reported as negative, such as adipocytes. | HPA reports OPA1 as Not detected in adipocytes (HPA tissue IHC). Review cell identification and controls; cross-reactivity or endogenous chromogenic activity can produce apparent positives (general IHC practice). A single unexpected cell population does not establish a new OPA1 tissue pattern. |
| Uniform diffuse color across cells and extracellular areas, without discernible cytoplasmic granules. | This is difficult to reconcile with the reported granular cytoplasmic tissue pattern (HPA tissue IHC). Assess background from nonspecific antibody binding or detection chemistry before interpreting intensity (general IHC practice); diffuse color alone cannot identify which step is responsible. |
| No signal in a section expected to be strongly positive, such as heart cardiomyocytes or kidney tubular cells. | HPA reports High staining in both cell populations (HPA tissue IHC). Check section quality, antibody and detection controls, and the antigen retrieval conditions used for the assay (general IHC practice). Absence of signal alone does not show that OPA1 is absent. |
| Subcellular location | OPA1 has an inner membrane segment and intermembrane space regions (UniProt O60313 topology). At light microscope resolution, interpret the expected tissue IHC signal as cytoplasmic granularity rather than a separately identifiable mitochondrial membrane outline (HPA tissue IHC; general IHC practice). |
| Proteolytic processing | UniProt describes a membrane-tethered long form and a soluble short form in the mitochondrial intermembrane space (UniProt O60313 processing and function). The supplied sources give no antibody epitope, so an IHC stain cannot be assigned to either form from appearance alone. |
| Tissue and cell selection | HPA reports High staining in several glandular cell populations, cardiomyocytes, kidney tubular cells and ovarian follicle cells; adipocytes are Not detected (HPA tissue IHC). HPA also reports low tissue RNA specificity, so choose comparison cells by their reported protein staining level (HPA tissue IHC). |
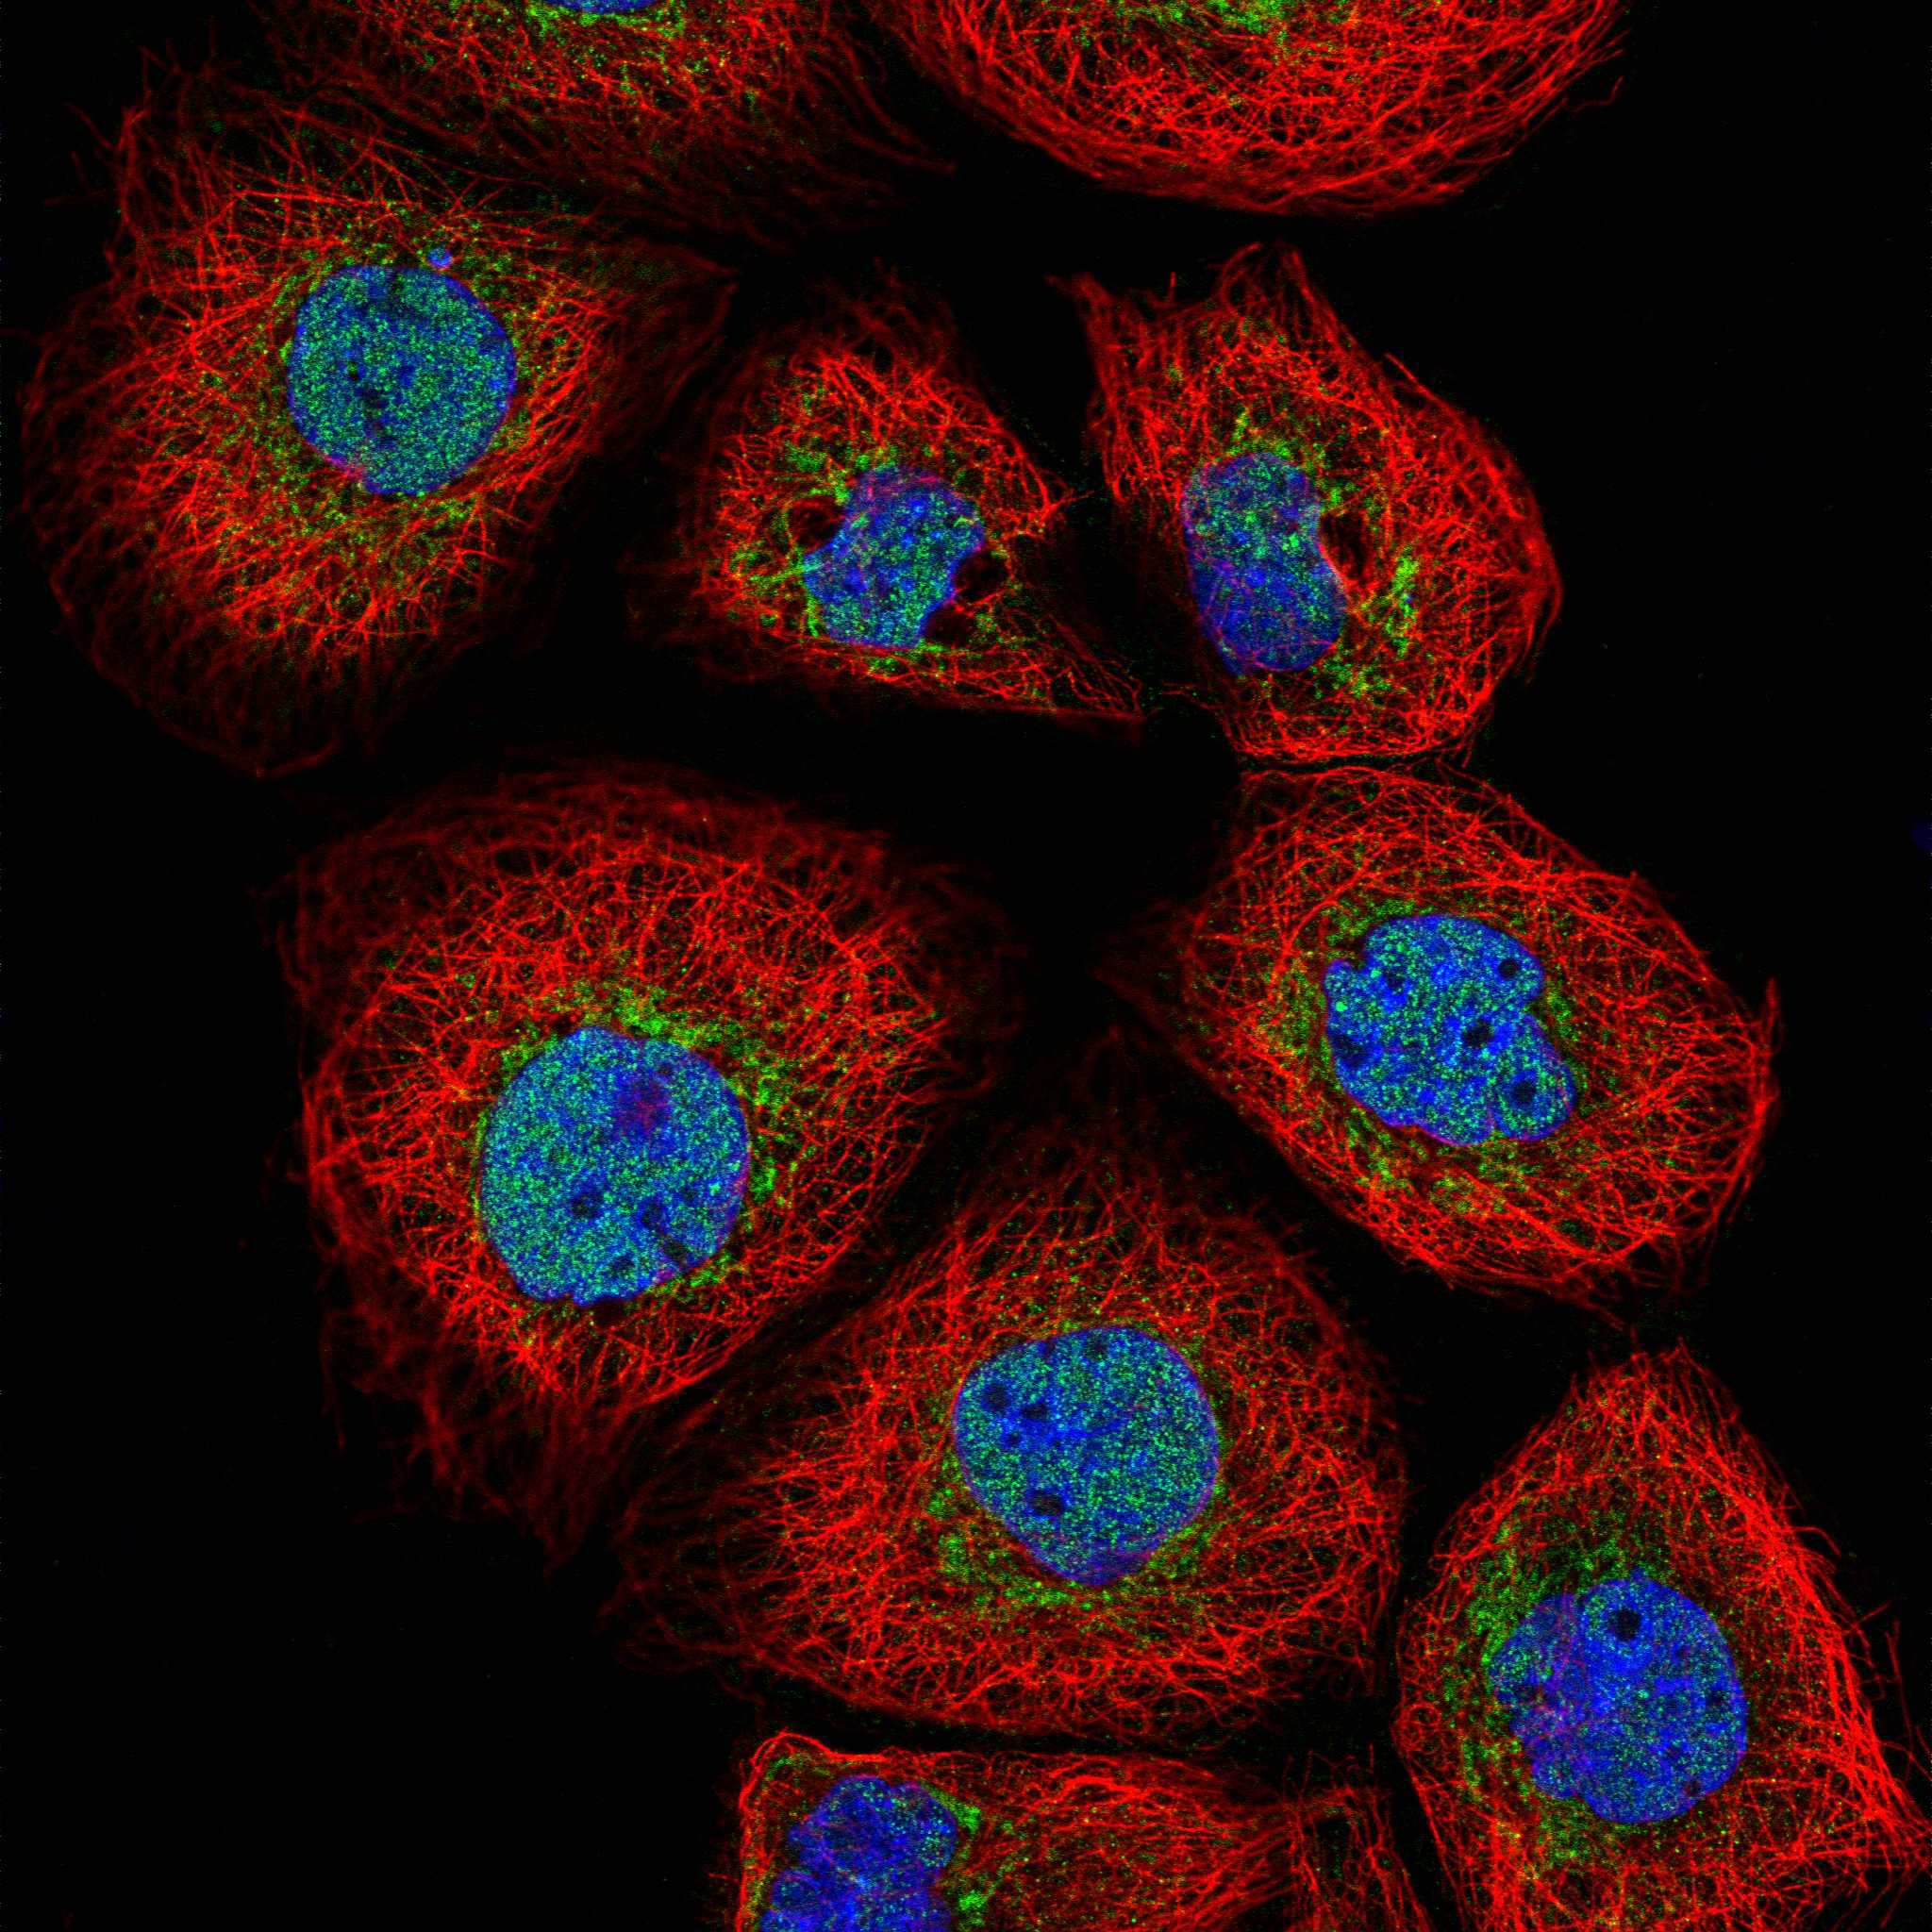
| Assay-specific location evidence | HPA describes granular cytoplasmic tissue IHC, while its ICC-IF summary lists nucleoplasm as approved and mitochondria as supported (HPA tissue IHC; HPA subcellular ICC-IF). Interpret each compartment claim in its assay context; ICC-IF localization does not establish the dominant paraffin section IHC pattern. |
| Situation | Likely cause | Next action |
|---|---|---|
| A known High tissue gives little or no stain. | The result conflicts with HPA's reported High staining in cardiomyocytes and kidney tubular cells; the supplied sources do not identify a target-specific failure mechanism (HPA tissue IHC). | Check section integrity, positive control performance, retrieval settings and detection reagents, then repeat under documented IHC conditions (general IHC practice). Do not infer a target-specific fixation effect from this result. |
| Signal is diffuse across tissue and blank spaces. | The distribution differs from HPA's granular cytoplasmic pattern (HPA tissue IHC). Nonspecific binding or detection background is possible (general IHC practice). | Inspect a no-primary control, review blocking and washing, and check whether the detection chemistry deposits color without primary antibody (general IHC practice). Score cells only after background is controlled. |
| Unexpected cells stain strongly, including adipocytes. | HPA lists adipocytes as Not detected; apparent signal may reflect cell misidentification, cross-reactivity or endogenous chromogenic activity (HPA tissue IHC; general IHC practice). | Compare adjacent morphology and known positive cells; examine a no-primary control and, for enzyme-based detection, an appropriate endogenous activity control (general IHC practice). |
| The section is mainly nuclear rather than granular cytoplasmic. | HPA tissue IHC favors granular cytoplasm, although HPA ICC-IF also reports approved nucleoplasmic localization (HPA tissue IHC; HPA subcellular ICC-IF). | Review morphology, controls and antibody validation before assigning the nuclear signal to OPA1 (general IHC practice). Record the compartment separately from cytoplasmic IHC scoring. |
| Staining is weak in skeletal muscle myocytes or cerebral cortex endothelial cells. | HPA reports Low staining in these cell populations (HPA tissue IHC). A weak result there is less informative about assay performance than a reported High cell population. | Compare with a documented High population, such as heart cardiomyocytes or kidney tubular cells, and assess background before changing assay settings (HPA tissue IHC; general IHC practice). |
| Q: IF/ICC shows nucleoplasmic signal. Is that compatible with OPA1? | A: HPA lists nucleoplasm as approved and mitochondria as supported in ICC-IF, while tissue IHC is described as granular cytoplasmic (HPA subcellular ICC-IF; HPA tissue IHC). | Interpret the IF/ICC result using its own controls and guide; retain granular cytoplasmic staining as the primary paraffin section IHC expectation (HPA tissue IHC; general IHC practice). |
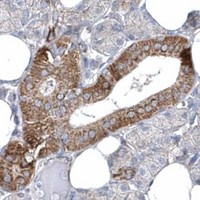
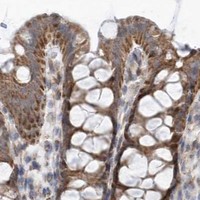
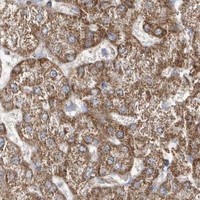

Comprehensive Human Protein Atlas IHC scoring per tissue (reliability: Supported — Medium consistency between antibody staining and RNA expression data.). Rows are taken directly from the HPA tissue chart — click any row's HPA link to view the source.
| Tissue | Cell type | Level | Evidence | Source |
|---|---|---|---|---|
| Appendix | Glandular cells | High | Protein (IHC) | HPA → |
| Duodenum | Glandular cells | High | Protein (IHC) | HPA → |
| Heart muscle | Cardiomyocytes | High | Protein (IHC) | HPA → |
| Kidney | Cells in tubules | High | Protein (IHC) | HPA → |
| Ovary | Follicle cells | High | Protein (IHC) | HPA → |
| Tissue | Cell type | Level | Evidence | Source |
|---|---|---|---|---|
| Adipose tissue | Adipocytes | Not detected | Protein (IHC) | HPA → |
Use the catalog antibody’s paraffin-section result as the starting point, then assess OPA1 staining against its mitochondrial biology and tissue controls.
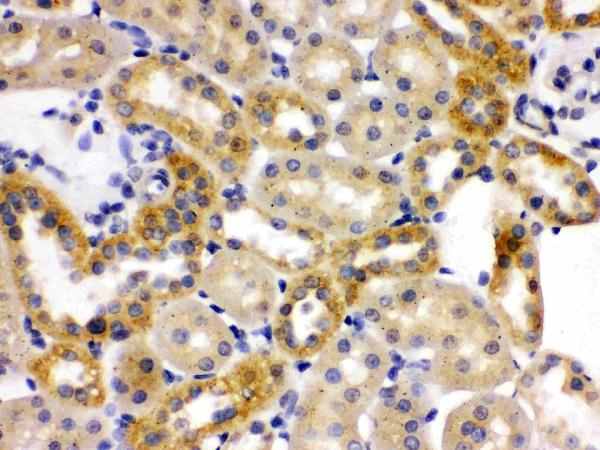
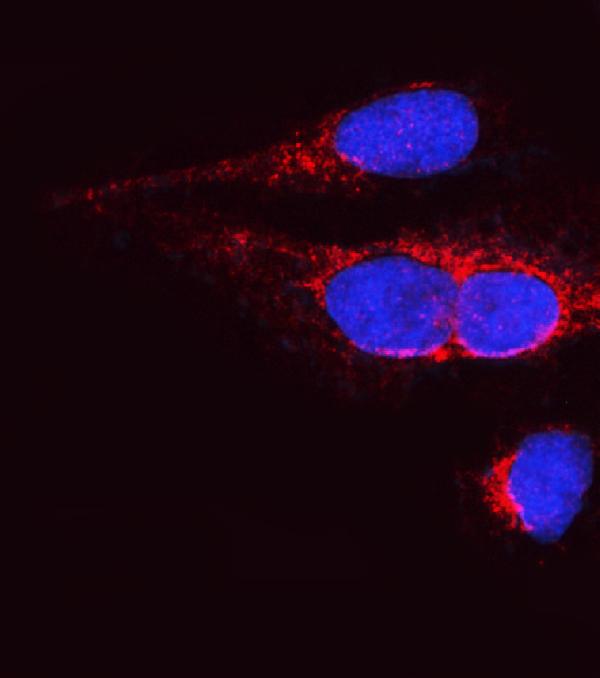
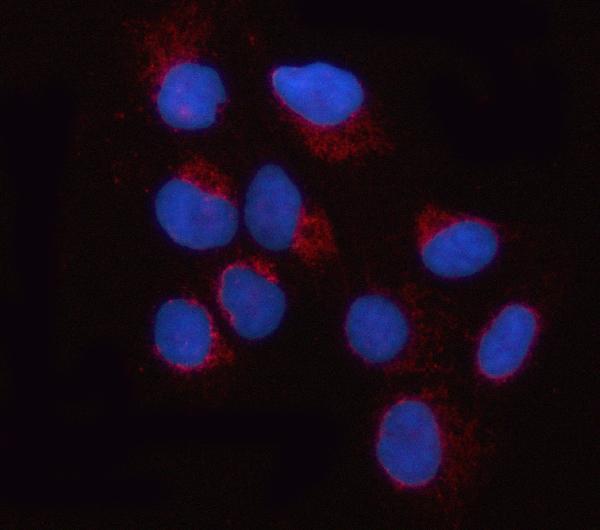
The catalog shows OPA1 IHC in paraffin sections from mouse liver, rat kidney, and human lung cancer (PB9731 image captions), plus IF in U2OS cells (A00508-1 image caption).
PB9731 will render with mouse liver paraffin-section IHC; its other IHC captions show rat kidney and human lung cancer (catalog image captions). A00508-1 will render with IF in U2OS cells and is listed for IF and ICC (catalog image caption; catalog applications).
Which to pick: Choose PB9731 for tissue IHC and cross-species work: its own paraffin-section captions cover mouse, rat, and human samples, using 1 μg/ml primary antibody after EDTA pH 8.0 retrieval (PB9731 image captions). Choose A00508-1 for IF/ICC: its own U2OS image documents IF at 5 μg/ml, and ICC and IF are listed applications (A00508-1 image caption; catalog applications). Neither card reports a clone, and the PB9731 paraffin-section captions do not report a fixative (catalog clone fields; PB9731 image captions).