This website uses cookies to ensure you get the best experience on our website.


- Table of Contents
Source-linked OPRM1 Western blot protocol options, expected-band and isoform facts, troubleshooting for weak or shifted signal, and recommended anti-OPRM1 WB antibodies. Everything you need to plan the experiment before you commit precious samples.

Expected bands, source-linked protocol options, controls and antibodies — the at-a-glance facts below, then the full design guide.
| Expected band | ~44.8 kDa | |
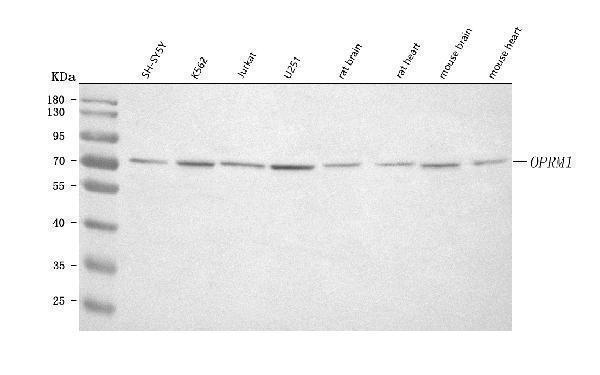
| Observed band | ~70 kDa | |
| Gel | 5–20% (catalog A00737-2) | |
| Positive control | Testis (IHC candidate; verify WB) | |
| Negative control | Adipose tissue (IHC candidate; verify WB) |
| PTM | Glycosylated + Phosphorylated | |
| Caveat | Modification-state controls | |
| Gene-set association | MSigDB C7 membership | |
| Isoform | 18 isoform(s) |
The A00737-2 protocol combines labelled catalog values with standard starting conditions. Published comparisons retain their own sample, reagent and detection scope.
| Sample / lysate | human SH-SY5Y, human K562, human Jurkat, human U251, rat brain, rat heart, mouse brain, mouse heart (catalog A00737-2) |
| Gel % | 5–20% (catalog A00737-2) |
| Load | 30 ug; reducing conditions (catalog A00737-2) |
| Transfer | a nitrocellulose membrane at 150 mA for 50-90 minutes (catalog A00737-2) |
| Membrane | nitrocellulose membrane (catalog A00737-2) |
| Blocking | 5% non-fat milk/TBS for 1.5 hour at RT (catalog A00737-2) |
| Primary antibody | A00737-2 · 0.5 μg/mL (catalog A00737-2) |
| Primary incubation | overnight at 4°C (catalog A00737-2) |
| Secondary antibody | goat anti-rabbit IgG-HRP, 1:5000 (catalog A00737-2) |
| Secondary incubation | 1.5 hour at RT (catalog A00737-2) |
| Wash | TBS-0.1%Tween 3 times with 5 minutes each (catalog A00737-2) |
| Detection | ECL (catalog A00737-2) |
OPRM1 is predicted at 44.8 kDa and observed near 70 kDa in antibody QC; the cause of the difference is not established.
| Band near 70 kDa | Empirical OPRM1 band; confirm identity with appropriate controls |
| Band near 44.8 kDa | Near the predicted mass of the 400-residue sequence |
| Diffuse band | Could reflect variable N-linked glycosylation; the listed sites alone do not establish a smear |
| Several bands at different positions | Could reflect OPRM1 isoforms; their migration differences are not established |
| Band near twice the monomer size | Could reflect an OPRM1 homooligomer if it remains intact during electrophoresis |
| Predicted OPRM1 mass | 44.8 kDa for the supplied sequence; this is not its observed migration |
| N-linked glycosylation at Asn9 and Asn12 | May increase apparent mass if present; the size effect is not supplied |
| N-linked glycosylation at Asn33, Asn40 and Asn48 | May increase apparent mass if present; the size effect is not supplied |
| OPRM1 homooligomer formation | Could yield a higher band if an oligomer survives electrophoresis; no oligomer band is established |
| Splice isoforms 1, 2, 3, 4, 5, 6, 7, 8, 9, 10, 11, 12, 13, 14, 15, 16, 17 and 18 | May differ in size, but individual masses and resolvable band positions are not supplied |
| Situation | Likely cause | Next action |
|---|---|---|
| No band in lysate | OPRM1 is a multipass membrane protein that may be poorly recovered in the lysate | Check membrane-protein extraction and a positive-control lysate |
| Band higher than expected | N-linked glycosylation or an SDS-stable oligomer is possible; neither is established as the cause of the 70 kDa band | Compare glycosidase-treated samples and verify band identity with an independent antibody or OPRM1 loss control |
| Band lower than expected | An OPRM1 isoform or altered glycosylation is possible | Check antibody epitope coverage and verify the band with an OPRM1 loss control |
| Broad smear instead of sharp band | Variation in N-linked glycosylation is possible but not demonstrated | Compare glycosidase-treated and untreated samples and check band specificity |
| Multiple bands | OPRM1 has 18 listed isoforms, though distinct migration is not established | Check isoform coverage of the antibody and compare with an OPRM1 loss control |
| Weak or no signal | Recovery of this multipass membrane receptor may be low | Enrich the membrane fraction and check a positive-control lysate |
Comprehensive Human Protein Atlas IHC scoring per tissue. Rows are taken directly from the HPA tissue chart — click any row's HPA link to view the source.
| Tissue | Cell type | Level | Evidence | Source |
|---|---|---|---|---|
| Testis | elongated or late spermatids | High | Protein (IHC) | HPA → |
| Tissue | Cell type | Level | Evidence | Source |
|---|---|---|---|---|
| Adipose tissue | adipocytes | Not detected | Protein (IHC) | HPA → |
| Adrenal gland | glandular cells | Not detected | Protein (IHC) | HPA → |
| Appendix | glandular cells | Not detected | Protein (IHC) | HPA → |
| Bone marrow | hematopoietic cells | Not detected | Protein (IHC) | HPA → |
| Breast | adipocytes | Not detected | Protein (IHC) | HPA → |
Deeper troubleshooting and optimisation questions for OPRM1, answered from its protein features.
Catalog antibodies with Western blot application and product-specific WB images. Evaluate suitability with the reported sample, controls and experimental conditions.
The catalog reports one anti-OPRM1 antibody for Western blot, A00737-2, with stated human, mouse, and rat reactivity. Its WB image shows a band near 70 kDa across the listed lysates, versus an expected 45 kDa; no orthogonal confirmation is supplied.
Which to pick: A00737-2 is the only listed option. Its WB image includes human cell, rat tissue, and mouse tissue lysates. Check whether the approximately 70 kDa band fits your assay before use, given the stated 45 kDa expected size.