This website uses cookies to ensure you get the best experience on our website.


- Table of Contents
Plan chromogenic PAIP1 IHC in paraffin sections using the catalog antibody at 2–5 μg/ml (datasheet A07792-2). Use cytoplasmic staining in glandular cells or kidney tubules as a reference, and interpret staining cautiously because antibody and RNA data have low consistency (HPA tissue IHC).

Expected localisation, validated protocols, controls and antibodies — the at-a-glance facts below, then the full design guide.
| Expected localisation | General cytoplasmic staining (HPA tissue IHC) | |
| Staining pattern | Cytoplasmic staining in glandular cells and kidney tubules (HPA tissue IHC) | |
| Antigen retrieval | EDTA pH 8.0 HIER, heat-mediated (datasheet A07792-2) | |
| Positive control | Cervix+4 more · see all | |
| Negative control | Bone marrow |
| Fixation | Keep fixation consistent across sections (standard IHC practice; not target-specific) | |
| Caveat | Antibody staining has low consistency with RNA expression (HPA tissue IHC) | |
| Regulation | Low tissue specificity of RNA (HPA tissue RNA) | |
| Isoform / epitope | 3 isoforms; epitope coverage is unknown (UniProt) |
The catalog antibody’s IHC-P protocol is accompanied by published PAIP1 methods for oral squamous cell carcinoma (PMC8841500) and gallbladder cancer (PMC8267329).
| Sample | Paraffin-embedded human ovarian serous adenocarcinoma tissue; fixative not specified (datasheet A07792-2) |
| Fixation | Image fixative and duration unreported (datasheet A07792-2); verify before use. |
| Sectioning | 4–5 µm sections on charged slides (standard) |
| Deparaffinisation | Xylene, graded ethanol series to water (standard) |
| Antigen retrieval | Heat retrieval: EDTA pH 8.0 (datasheet A07792-2); 20 min, 95–100 °C (standard) |
| Peroxidase block | 3% H2O2, 10 min, room temperature (standard) |
| Blocking | 10% goat serum (datasheet A07792-2) |
| Primary antibody | Rabbit anti-PAIP1, 2-5 μg/ml (datasheet A07792-2) |
| Primary incubation | Overnight at 4 °C (datasheet A07792-2) |
| Detection | HRP-conjugated secondary, DAB chromogen (datasheet A07792-2) |
| Counterstain | Hematoxylin, blue, dehydrate and mount (standard) |
| Expected result | PAIP1-positive staining in glandular cells of cervix (HPA tissue IHC: High). HPA tissue profile: General cytoplasmic expression. No signal in the no-primary control. |
PAIP1 is annotated in the cytoplasm and has no transmembrane segment (UniProt Q9H074). In paraffin sections, expect predominantly cytoplasmic staining in glandular cells of cervix, endometrium, parathyroid gland, prostate and stomach, and in kidney tubule cells, where HPA reports high staining (HPA tissue IHC). HPA rates its tissue IHC profile Approved but reports low consistency between antibody staining and RNA expression; interpret intensity alongside controls (HPA tissue IHC).
| Distinct cytoplasmic chromogen in glandular cells or kidney tubule cells, with recognizable cell borders. | This matches the broad cytoplasmic expectation (UniProt Q9H074; HPA tissue IHC). HPA reports high staining in the named glandular tissues and kidney tubules, but its Approved profile has low consistency with RNA expression. Compare cells within the same section before treating intensity as a quantitative measure (HPA tissue IHC; general IHC practice). |
| Predominantly nuclear staining, with little or no cytoplasmic signal in otherwise well-preserved cells. | A nuclear-only pattern conflicts with the annotated cytoplasmic location (UniProt Q9H074) and HPA's general cytoplasmic IHC profile (HPA tissue IHC). Treat it as suspect, then check the counterstain, detection controls and staining in an HPA high-expression tissue. A nuclear signal alone does not establish a new PAIP1 location (general IHC practice). |
| Strong chromogen in hematopoietic cells of bone marrow, while expected glandular or tubule cells are weak. | HPA reports PAIP1 as not detected in bone marrow hematopoietic cells and high in several glandular populations and kidney tubules (HPA tissue IHC). Investigate cross-reactivity or endogenous detection activity using controls. The HPA bone marrow result is a comparison point, not proof that every positive cell is nonspecific (general IHC practice). |
| Diffuse chromogen covers extracellular space, tissue edges or many cell types without clear cytoplasmic boundaries. | This obscures the cell-level cytoplasmic pattern expected for PAIP1 (UniProt Q9H074; HPA tissue IHC). Consider nonspecific detection or uneven staining and review the negative control and tissue morphology (general IHC practice). Do not score diffuse deposit as PAIP1-positive cells merely because a section comes from an HPA high-staining tissue. |
| No cytoplasmic signal in a glandular or kidney tubule population reported as high by HPA. | A negative result differs from the reported pattern (HPA tissue IHC), but cannot by itself distinguish a failed assay from variation in the specimen. Check that the relevant cells are present, then review the IHC-validated antibody, retrieval, detection and positive control under the same run conditions (general IHC practice). |
| Which cells provide an intensity reference? | HPA reports high staining in glandular cells of cervix, endometrium, parathyroid gland, prostate and stomach, and in kidney tubule cells (HPA tissue IHC). Adrenal and appendix glandular cells are medium; several listed epithelial or other populations are low (HPA tissue IHC). Select a reference with the relevant cell population present. |
| How strong is the tissue-pattern evidence? | The tissue IHC profile is Approved, with low consistency between antibody staining and RNA expression (HPA tissue IHC). HPA073653 is Approved for IHC; the supplied antibody record does not label its IHC result Enhanced (HPA antibodies). Use the reported pattern as a guide and assess each run with controls. |
| Does topology predict a membrane-only IHC pattern? | UniProt annotates PAIP1 as cytoplasmic and lists no transmembrane segment (UniProt Q9H074). The IHC tissue profile describes general cytoplasmic expression (HPA tissue IHC). A membrane-only chromogenic pattern would need separate validation; topology alone does not identify an IHC epitope. |
| Can this IHC pattern distinguish isoforms or processing states? | UniProt lists three isoforms, no signal peptide or propeptide, and a chain spanning residues 1–479 (UniProt Q9H074). The supplied sources give no antibody epitope or isoform-specific IHC pattern. Do not assign a stain to one isoform or infer shedding from tissue staining. |
| What should IF/ICC show? | HPA reports enhanced plasma membrane and cytosol localization in ICC-IF images from SiHa, U2OS and HEK293 cells; HPA076187 is Approved for ICC (HPA subcellular; HPA antibodies). That observation belongs to the separate IF/ICC context and does not establish a membrane-only pattern in paraffin IHC. |
| Is PAIP1-specific fixation sensitivity known? | The supplied UniProt and HPA records do not report a PAIP1-specific fixation effect (UniProt Q9H074; HPA tissue IHC). Record the section preparation and apply routine IHC controls, but do not attribute a weak or negative result to PAIP1 epitope masking without separate evidence (general IHC practice). |
| Situation | Likely cause | Next action |
|---|---|---|
| Expected glandular or kidney tubule cells show no signal. | The expected cells may be absent, or an assay step may have failed; HPA reports high staining in these populations (HPA tissue IHC; general IHC practice). | Confirm cell identity on the counterstained section. Review the IHC-validated antibody, retrieval and detection records, and compare a positive tissue processed in the same run (general IHC practice). |
| Staining is mainly nuclear. | The distribution conflicts with cytoplasmic PAIP1 annotation and HPA's general cytoplasmic IHC profile (UniProt Q9H074; HPA tissue IHC). | Recheck cellular boundaries and counterstain, then compare the positive and negative controls. Score nuclear-only staining as unresolved until its specificity is supported (general IHC practice). |
| Bone marrow hematopoietic cells stain strongly. | HPA reports PAIP1 as not detected in that population; cross-reactivity or endogenous detection activity is possible (HPA tissue IHC; general IHC practice). | Inspect a control omitting the primary antibody and review detection blocking. Compare the result with an HPA high-staining glandular or tubule population (general IHC practice; HPA tissue IHC). |
| Diffuse background obscures individual cells. | Nonspecific chromogen or detection background can hide a cytoplasmic pattern (general IHC practice; UniProt Q9H074). | Check the negative control, tissue edges, blocking and wash steps; adjust the general IHC workflow until cell boundaries can be read (general IHC practice). |
| A low-staining tissue looks weaker than a high-staining reference. | This can agree with HPA: cerebellar molecular-layer cells, oral and esophageal squamous cells, epididymal glandular cells, vaginal squamous cells and placental decidual cells are listed as low (HPA tissue IHC). | Score the named cell population rather than the whole tissue, and compare sections stained in the same run before calling assay failure (HPA tissue IHC; general IHC practice). |
| ICC-IF shows a membrane component that is unclear in chromogenic IHC. | HPA reports plasma membrane and cytosol localization in ICC-IF, while its tissue IHC profile is general cytoplasmic expression (HPA subcellular; HPA tissue IHC). | Interpret each application against its own HPA pattern. Use the IHC tissue profile for paraffin-section scoring and the separate IF/ICC guide for fluorescence assessment (HPA tissue IHC; HPA subcellular). |
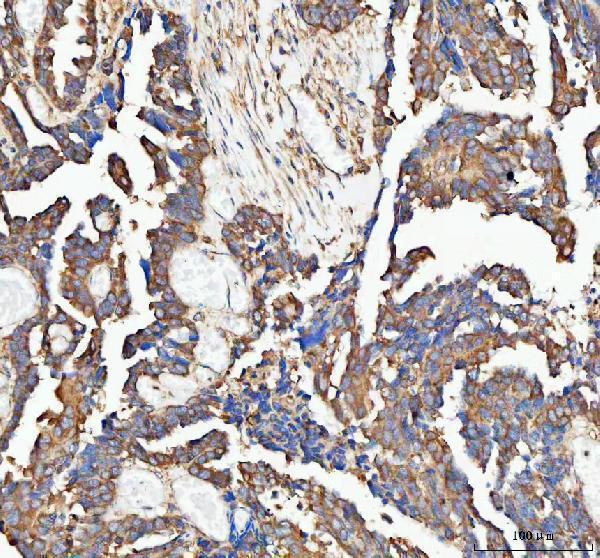
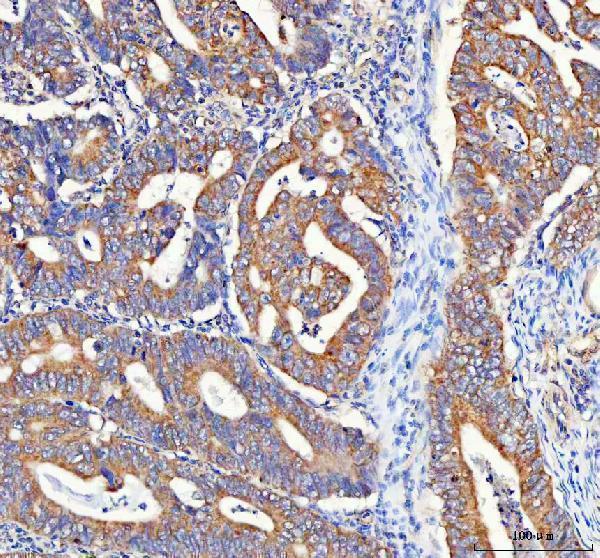
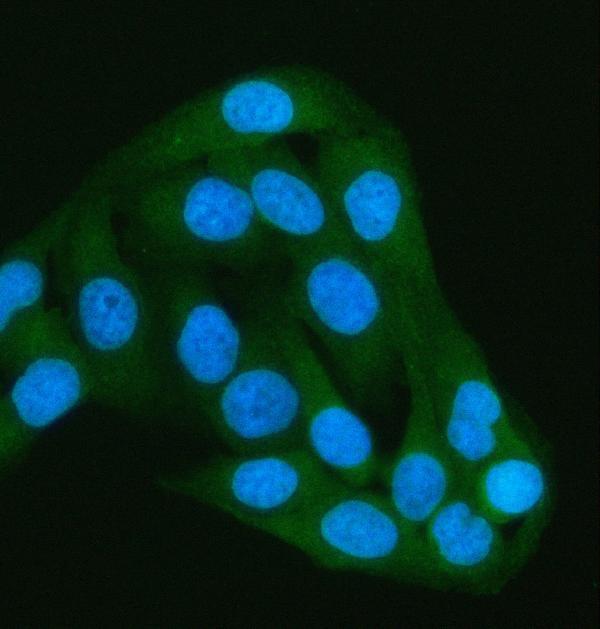


Comprehensive Human Protein Atlas IHC scoring per tissue (reliability: Approved — Low consistency between antibody staining and RNA expression data.). Rows are taken directly from the HPA tissue chart — click any row's HPA link to view the source.
| Tissue | Cell type | Level | Evidence | Source |
|---|---|---|---|---|
| Cervix | Glandular cells | High | Protein (IHC) | HPA → |
| Endometrium | Glandular cells | High | Protein (IHC) | HPA → |
| Kidney | Cells in tubules | High | Protein (IHC) | HPA → |
| Parathyroid gland | Glandular cells | High | Protein (IHC) | HPA → |
| Prostate | Glandular cells | High | Protein (IHC) | HPA → |
| Tissue | Cell type | Level | Evidence | Source |
|---|---|---|---|---|
| Bone marrow | Hematopoietic cells | Not detected | Protein (IHC) | HPA → |
Troubleshoot PAIP1 staining in paraffin sections by checking retrieval, cytoplasmic localisation, cell identity and controls before comparing signal across samples.
A07792-2 has human IHC images from paraffin sections of ovarian serous adenocarcinoma and rectum adenocarcinoma, plus an IF image from HELA cells (catalog image captions).
A07792-2 is the sole listed SKU; its IHC images show human paraffin-embedded ovarian serous adenocarcinoma and rectum adenocarcinoma sections (catalog IHC image captions). Its IF image shows HELA cells, and its listed applications include IHC, ICC, and IF (catalog IF image caption; catalog applications).
Which to pick: Choose A07792-2 for human paraffin-section chromogenic IHC: its ovarian-section caption documents EDTA retrieval at pH 8.0, 2 μg/ml primary antibody, and HRP/DAB detection (A07792-2 IHC image caption). For human IF/ICC, the same SKU lists both applications and shows HELA-cell IF at 5 μg/ml (catalog applications; A07792-2 IF image caption). No cross-species choice is supported: A07792-2 lists human reactivity only, has no clone designation, and its paraffin-section captions do not report the fixative (catalog reactivity and clone field; A07792-2 IHC image captions).