This website uses cookies to ensure you get the best experience on our website.


- Table of Contents
Plan PGAM1 chromogenic IHC in paraffin sections using cytoplasmic staining in most tissues as the expected pattern (HPA tissue IHC). Use kidney tubules as a high-staining reference (HPA tissue IHC), start the catalog antibody at 2–5 μg/ml (datasheet: A04470-2), and assess possible cross-gene staining (HPA tissue IHC).

Expected localisation, validated protocols, controls and antibodies — the at-a-glance facts below, then the full design guide.
| Expected localisation | Cytoplasmic staining in most tissues (HPA tissue IHC) | |
| Staining pattern | Cytoplasmic signal in most tissues; high in kidney tubules (HPA tissue IHC) | |
| Antigen retrieval | EDTA pH 8.0 HIER, heat-mediated (datasheet A04470-2) | |
| Positive control | Kidney+4 more · see all | |
| Negative control | Adipose tissue+4 more · see all |
| Fixation | Matched tissue-IHC evidence does not establish the fixation claim. Validate the specimen-specific method before use. (selected-SKU IHC image A04470-2) | |
| Caveat | Possible cross-gene antibody staining (HPA tissue IHC) | |
| Regulation | No expression regulator specified (UniProt) | |
| Isoform / epitope | 0 isoforms annotated; chain spans residues 2–254 (UniProt) |
The catalog antibody protocol uses heat retrieval in EDTA pH 8.0 (datasheet A04470-2). Four published PGAM1 IHC protocols provide sample specific comparisons (PMC5958715; PMC2873438; PMC5858104; PMC5559954).
| Sample | Paraffin-embedded human testis cancer tissue; fixative not specified (datasheet A04470-2) |
| Fixation | Image fixative and duration unreported (datasheet A04470-2); verify before use. |
| Sectioning | 4–5 µm sections on charged slides (standard) |
| Deparaffinisation | Xylene, graded ethanol series to water (standard) |
| Antigen retrieval | Heat retrieval: EDTA pH 8.0 (datasheet A04470-2); 20 min, 95–100 °C (standard) |
| Peroxidase block | 3% H2O2, 10 min, room temperature (standard) |
| Blocking | 10% goat serum (datasheet A04470-2) |
| Primary antibody | Rabbit anti-PGAM1, 2-5 μg/ml (datasheet A04470-2) |
| Primary incubation | Overnight at 4 °C (datasheet A04470-2) |
| Detection | HRP-conjugated secondary, DAB chromogen (datasheet A04470-2) |
| Counterstain | Hematoxylin, blue, dehydrate and mount (standard) |
| Expected result | PGAM1-positive staining in cells in tubules of kidney (HPA tissue IHC: High). HPA tissue profile: Cytoplasmic expression in most tissues. No signal in the no-primary control. |
In paraffin-section IHC, expect predominantly cytoplasmic PGAM1 staining, with strong staining in kidney tubule cells and moderate staining in selected glandular, respiratory epithelial, and neural compartments (HPA tissue IHC). PGAM1 has no transmembrane segment (UniProt P18669 topology). Treat this pattern as a guide: HPA rates the tissue IHC profile Approved, with medium consistency against RNA data, pending external verification, and a warning that the antibody may target proteins from more than one gene (HPA tissue IHC).
| Strong cytoplasmic staining in kidney tubule cells, with tissue structure still visible. | This matches the clearest listed positive reference: kidney tubule cells stain High (HPA tissue IHC). Judge staining within tubule cells, rather than treating color anywhere in the section as a positive result. The HPA profile carries a multi-gene targeting caution (HPA tissue IHC). |
| Moderate cytoplasmic staining in adrenal glandular cells, bronchial respiratory epithelial cells, or cerebellar granular-layer cells. | These cell populations are listed at Medium intensity (HPA tissue IHC). A lighter result than kidney tubules can therefore fit the reported tissue pattern. Compare the stained cell population and compartment as well as intensity; HPA describes cytoplasmic expression in most tissues (HPA tissue IHC). |
| A nuclear-only or sharply membrane-restricted IHC pattern, without the expected cytoplasmic staining. | This departs from the reported tissue IHC profile and warrants a compartment check before scoring the slide positive (HPA tissue IHC; UniProt P18669 topology). Nuclear signal alone is not proof of an artefact across applications: HPA reports approved nucleoplasmic localization in ICC-IF, with a multi-gene antibody caution (HPA subcellular ICC-IF). |
| Strong color in skeletal muscle myocytes or adipocytes, or similar color across unrelated cell types. | Those cell types are listed as Not detected in the sampled HPA tissue IHC views (HPA tissue IHC). Check for cross-reactivity or nonspecific chromogen deposition before assigning PGAM1 positivity. Endogenous detection activity is another general chromogenic-IHC possibility; the slide pattern alone cannot identify which cause applies. |
| Hazy, diffuse color across tissue and empty areas, or no staining in kidney tubule cells. | Diffuse color that ignores cell boundaries is unsuitable for compartment scoring. An unstained known-positive population conflicts with the High kidney-tubule reference (HPA tissue IHC). Review assay controls and staining conditions before interpreting other tissues as negative; one failed positive control cannot establish their PGAM1 status. |
| Tissue and cell type | Intensity is cell-specific: kidney tubule cells are High; several glandular, respiratory epithelial, and neural populations are Medium; skeletal muscle myocytes and adipocytes are Not detected (HPA tissue IHC). Use the sampled cell population when choosing comparison fields. |
| IHC evidence strength | The tissue profile is Approved but has medium staining-to-RNA consistency, is pending external verification, and warns of proteins from more than one gene being targeted (HPA tissue IHC). Treat an unexpected positive as provisional until independently checked. |
| Protein topology | PGAM1 has no annotated transmembrane segment or signal peptide (UniProt P18669 topology and processing). This is compatible with the reported cytoplasmic tissue IHC profile (HPA tissue IHC); topology alone does not validate an individual stained structure. |
| IF/ICC question: should nuclear fluorescence be expected? | HPA reports mainly nucleoplasmic localization and additional mid-piece localization in ICC-IF, both marked approved, while cautioning that antibodies may target proteins from multiple genes (HPA subcellular ICC-IF). Interpret that IF observation within its own application; the tissue IHC profile is cytoplasmic (HPA tissue IHC). |
| Situation | Likely cause | Next action |
|---|---|---|
| Kidney tubule cells are unstained. | The positive reference has failed: these cells are High in HPA tissue IHC. The image alone does not identify the failed assay step. | Check a known-positive section, reagent delivery, retrieval conditions, antibody dilution, and detection controls using the IHC-validated antibody’s documented procedure. Restore the positive-control signal before scoring study sections as negative. |
| Color is widespread, including cell types listed as Not detected. | Nonspecific binding, cross-reactivity, or endogenous chromogenic detection activity are possible general IHC causes. HPA also warns that its staining antibody may target proteins from more than one gene (HPA tissue IHC). | Compare the no-primary and detection controls, review blocking and washing, and assess whether staining follows cells rather than tissue edges or deposits. Confirm unexpected cell-type positives independently before reporting PGAM1 expression. |
| A slide is predominantly nuclear or membrane-stained. | That pattern does not match HPA’s cytoplasmic tissue IHC profile (HPA tissue IHC). Approved nucleoplasmic ICC-IF staining exists, so compartment findings depend on the application (HPA subcellular ICC-IF). | Inspect matched controls and morphology, then compare cytoplasmic staining in kidney tubule cells (HPA tissue IHC). If nuclear-only IHC persists, describe the observed pattern without assigning it to PGAM1 on compartment alone. |
| Only weak, hazy color is visible throughout the section. | Diffuse background can obscure cellular staining in chromogenic IHC; its presence does not establish PGAM1 localization. HPA’s reference pattern is cytoplasmic in most tissues (HPA tissue IHC). | Review no-primary control, wash and blocking steps, chromogen development, and counterstain. Score only signal with recognizable cell boundaries; reassess the section after background is controlled. |
| Skeletal muscle myocytes stain strongly. | HPA lists skeletal muscle myocytes as Not detected, and UniProt reports PGAM1 as not found in muscle (HPA tissue IHC; UniProt P18669 tissue specificity). Strong staining there is an unexpected result. | Check cell identity, background controls, and antibody specificity before calling the myocytes PGAM1-positive. Compare the same run with kidney tubules as the HPA High positive reference (HPA tissue IHC). |
| IF/ICC shows nucleoplasmic signal while tissue IHC appears cytoplasmic. | HPA reports approved nucleoplasmic ICC-IF localization and a cytoplasmic tissue IHC profile; both carry an antibody multi-gene caution (HPA subcellular ICC-IF; HPA tissue IHC). | Record the application and compartment with each image. Use the tissue IHC pattern to interpret paraffin sections, and assess IF/ICC in its separate guide; do not force the two images into one compartment call. |
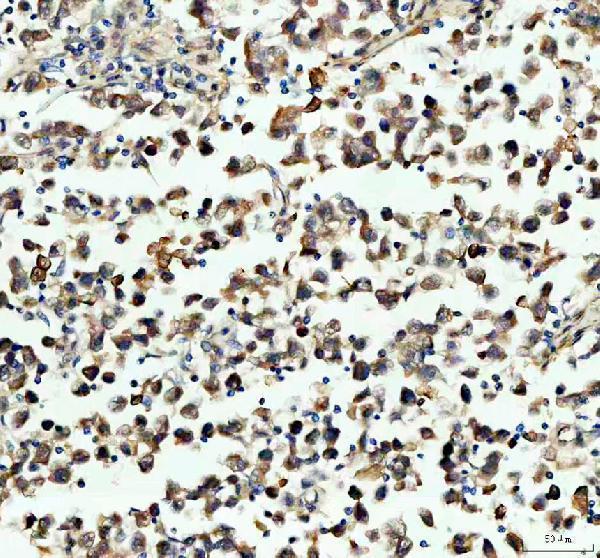
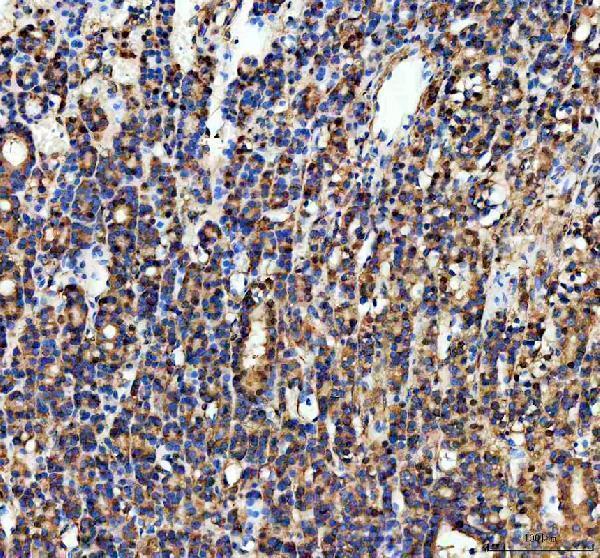
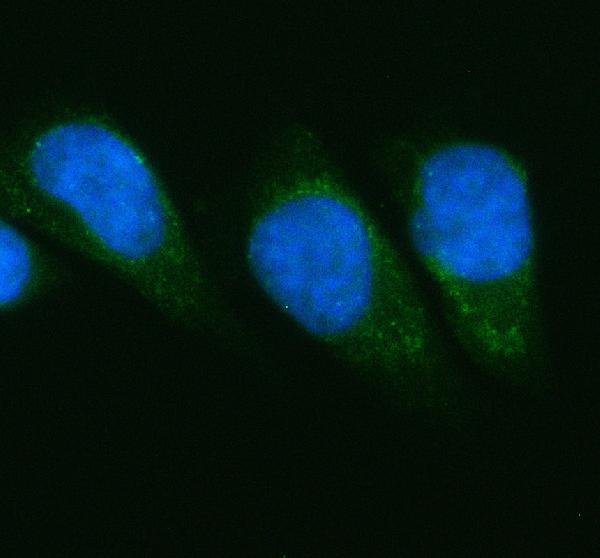


Comprehensive Human Protein Atlas IHC scoring per tissue (reliability: Approved — Medium consistency between antibody staining and RNA expression data. Pending external verification. Caution, targets protein from more than one gene.). Rows are taken directly from the HPA tissue chart — click any row's HPA link to view the source.
| Tissue | Cell type | Level | Evidence | Source |
|---|---|---|---|---|
| Kidney | Cells in tubules | High | Protein (IHC) | HPA → |
| Adrenal gland | Glandular cells | Medium | Protein (IHC) | HPA → |
| Bronchus | Respiratory epithelial cells | Medium | Protein (IHC) | HPA → |
| Cerebellum | Cells in granular layer | Medium | Protein (IHC) | HPA → |
| Cerebral cortex | Neuropil | Medium | Protein (IHC) | HPA → |
| Tissue | Cell type | Level | Evidence | Source |
|---|---|---|---|---|
| Adipose tissue | Adipocytes | Not detected | Protein (IHC) | HPA → |
| Bone marrow | Hematopoietic cells | Not detected | Protein (IHC) | HPA → |
| Breast | Adipocytes | Not detected | Protein (IHC) | HPA → |
| Duodenum | Glandular cells | Not detected | Protein (IHC) | HPA → |
| Skeletal muscle | Myocytes | Not detected | Protein (IHC) | HPA → |
Troubleshoot PGAM1 staining in paraffin sections by checking retrieval, compartment, controls, and scoring before interpreting differences between specimens.
A04470-2 has IHC data from human paraffin sections and IF/ICC data from HeLa cells (catalog image captions). The catalog lists Human, Mouse, and Rat reactivity (catalog: reactivity).
A04470-2 was demonstrated by IHC on paraffin sections of human testis cancer and thyroid cancer tissue (A04470-2 IHC captions). Its IF image shows HeLa cells, and its listed applications include IF and ICC (A04470-2 IF caption; catalog: applications).
Which to pick: Choose A04470-2 for chromogenic tissue IHC: its paraffin-section captions specify EDTA retrieval at pH 8.0, 2 μg/ml primary antibody, and HRP/DAB detection (A04470-2 IHC captions). The same SKU is the IF/ICC choice based on its HeLa-cell IF image and listed 5 μg/ml IF concentration (A04470-2 IF caption; catalog: IF dilution). For cross-species work, the catalog lists Human, Mouse, and Rat reactivity, while the supplied images document human material; the IHC captions do not report the fixative (catalog: reactivity; A04470-2 image captions).