This website uses cookies to ensure you get the best experience on our website.


- Table of Contents
Source-linked PRSS1 Western blot protocol options, expected-band and isoform facts, troubleshooting for weak or shifted signal, and recommended anti-PRSS1 WB antibodies. Everything you need to plan the experiment before you commit precious samples.

Expected bands, source-linked protocol options, controls and antibodies — the at-a-glance facts below, then the full design guide.
| Expected band | ~26.6 kDa | |
| Gel | 12–15% (standard starting point) | |
| Positive control | Duodenum (IHC candidate; verify WB) +2 more | |
| Negative control | Adipose tissue (IHC candidate; verify WB) |
| PTM | Cleaved | |
| Caveat | Zymogen activation controls | |
| Gene-set association | MSigDB C7 membership | |
| Isoform | 1 isoform(s) |
The A01637 protocol combines labelled catalog values with standard starting conditions. Published comparisons retain their own sample, reagent and detection scope.
| Sample / lysate | lysate from 293 cells, (catalog A01637) |
| Gel % | 12–15% (standard starting point) |
| Load | 20–30 µg total protein per lane; optimize for abundance (standard starting point) |
| Transfer | Short semi-dry transfer; verify retention (standard starting point) |
| Membrane | 0.45 µm PVDF (standard starting point) |
| Blocking | 5% milk or 5% BSA in TBST (standard starting point) |
| Primary antibody | A01637; use the WB datasheet starting dilution (standard starting point) |
| Primary incubation | Overnight at 4 °C (standard starting point) |
| Secondary antibody | Species-matched HRP conjugate at validated dilution (standard starting point) |
| Secondary incubation | 1 h at room temperature (standard starting point) |
| Wash | 3 × 5 min in TBST (standard starting point) |
| Detection | ECL; bracket exposures to avoid saturation (standard starting point) |
PRSS1 has a predicted 26.6 kDa precursor; secretion and cleavage may affect detection or size, but no empirical migration is supplied.
| Band near 26.6 kDa | consistent with the predicted full-length precursor; confirm identity with controls |
| Band below 26.6 kDa | could reflect signal-peptide or propeptide cleavage |
| Little or no band in whole-cell lysate | consistent with secretion into the extracellular space |
| Two bands near the expected size | could reflect precursor and processed forms; confirm their identities |
| UniProt predicted mass | 26.6 kDa for the full-length precursor |
| Signal peptide at residues 1–15 | cleavage can make the secreted form smaller than the precursor |
| Propeptide at residues 16–23 | cleavage can make the active form smaller than the precursor |
| Sulfotyrosine at residue 154 | a modification is annotated, but a visible size shift is not established |
| Situation | Likely cause | Next action |
|---|---|---|
| No band in lysate | PRSS1 is secreted | probe conditioned medium alongside lysate |
| Band lower than expected | signal-peptide or propeptide cleavage may reduce size | compare precursor and processed-form controls |
| Band higher than expected | retention of the signal peptide or propeptide could increase size relative to a processed form | compare with a full-length precursor control |
| Multiple bands | precursor and processed forms may coexist | check band identity with epitope information and appropriate controls |
| Weak or no signal | secretion may leave little PRSS1 in lysate | test conditioned medium and a positive control |
| Fragments below expected size | proteolysis may generate fragments | use protease inhibitors during preparation and confirm identity with an independent antibody |
Comprehensive Human Protein Atlas IHC scoring per tissue. Rows are taken directly from the HPA tissue chart — click any row's HPA link to view the source.
| Tissue | Cell type | Level | Evidence | Source |
|---|---|---|---|---|
| Duodenum | paneth cells | High | Protein (IHC) | HPA → |
| Pancreas | exocrine glandular cells | High | Protein (IHC) | HPA → |
| Small intestine | paneth cells | High | Protein (IHC) | HPA → |
| Tissue | Cell type | Level | Evidence | Source |
|---|---|---|---|---|
| Adipose tissue | adipocytes | Not detected | Protein (IHC) | HPA → |
| Adrenal gland | glandular cells | Not detected | Protein (IHC) | HPA → |
| Appendix | endocrine cells | Not detected | Protein (IHC) | HPA → |
| Bone marrow | hematopoietic cells | Not detected | Protein (IHC) | HPA → |
| Breast | adipocytes | Not detected | Protein (IHC) | HPA → |
Deeper troubleshooting and optimisation questions for PRSS1, answered from its protein features.
Catalog antibodies with Western blot application and product-specific WB images. Evaluate suitability with the reported sample, controls and experimental conditions.
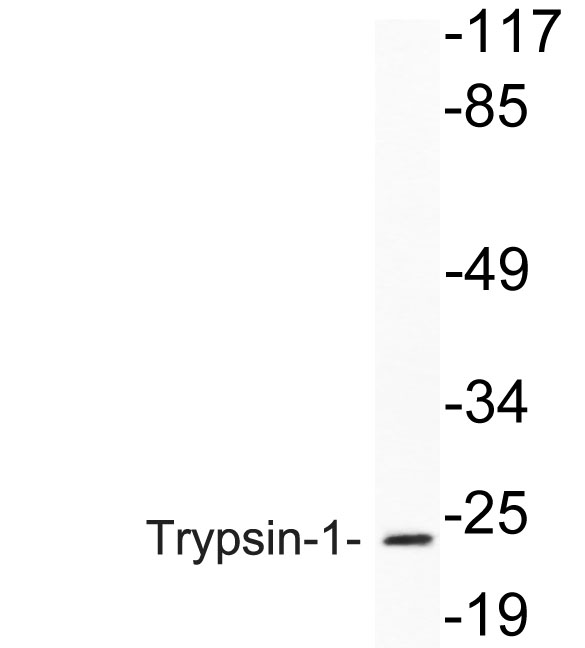
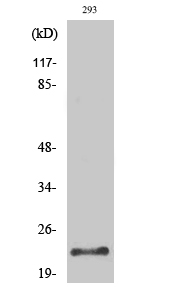
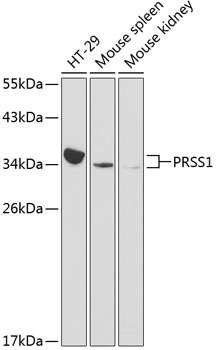
The catalog reports two anti-PRSS1 antibodies with WB images. A01637’s caption reports 293-cell lysate; A01637-1’s caption identifies a WB analysis but gives no sample. These captions provide limited validation detail.
Which to pick: Choose A01637 for reported Human or Rat reactivity and a WB image using 293-cell lysate. Choose A01637-1 for reported Human or Mouse reactivity; its WB image caption does not identify the sample.