PSAT1 / Phosphoserine aminotransferase · IHC design guide

Design Immunohistochemistry for PSAT1

Plan PSAT1 staining in paraffin sections using the IHC-validated antibody at 0.5–1 μg/ml (datasheet PB10086). Compare cell-specific cytoplasmic staining in exocrine pancreas and renal tubules, and score those populations separately (HPA tissue IHC).

Evidence assembled Oct 2026 · For research use; verify linked source records and product datasheet before use
Immunohistochemistry protocol sheet for PSAT1 (IHC for PSAT1): expected localisation Predominantly cytoplasmic in tissue sections (HPA tissue IHC), antibody PB10086, validated IHC image, and IHC protocol steps
Printable PSAT1 IHC protocol sheet — expected localisation Predominantly cytoplasmic in tissue sections (HPA tissue IHC), antibody PB10086, controls and protocol steps. Open the full PSAT1 IHC guide →

PSAT1 Immunohistochemistry Experimental Design Guide

Expected localisation, validated protocols, controls and antibodies — the at-a-glance facts below, then the full design guide.

Must know before staining
Expected localisation Predominantly cytoplasmic in tissue sections (HPA tissue IHC)
Staining pattern Exocrine pancreas, renal tubules and CNS: cytoplasmic staining (HPA tissue IHC)
Antigen retrieval EDTA pH 8.0 HIER, heat-mediated (datasheet PB10086)
Positive control ⓘ Cerebellum+4 more · see all
Negative control ⓘ Adipose tissue+4 more · see all
Important caveats
Reasons your staining may differ from the expected pattern.
Fixation Matched tissue-IHC evidence does not establish the fixation claim. Validate the specimen-specific method before use. (selected-SKU IHC image PB10086)
Caveat Whole-section scores can obscure cell-specific signal (HPA tissue IHC)
Regulation Expression regulation is not established (UniProt)
Isoform / epitope 2 isoforms; epitope differences are unreported (UniProt)
Section 1

Recommended PSAT1 IHC & IF Protocols

The catalog antibody protocol uses EDTA retrieval (datasheet: PB10086). Four published PSAT1 IHC protocols below provide tissue specific methods and scoring details (PMC4911876; PMC5755227; PMC11352415; PMC5721480).

Recommended immunohistochemistry (IHC-P) protocol parameters
SampleParaffin-embedded mouse liver tissue; fixative not specified (datasheet PB10086)
FixationImage fixative and duration unreported (datasheet PB10086); verify before use.
Sectioning4–5 µm sections on charged slides (standard)
DeparaffinisationXylene, graded ethanol series to water (standard)
Antigen retrievalHeat retrieval: EDTA pH 8.0 (datasheet PB10086); 20 min, 95–100 °C (standard)
Peroxidase block3% H2O2, 10 min, room temperature (standard)
Blocking10% goat serum (datasheet PB10086)
Primary antibodyRabbit anti-PSAT1, 0.5-1μg/ml (datasheet PB10086)
Primary incubationOvernight at 4 °C (datasheet PB10086)
DetectionStreptavidin-biotin complex (SABC), DAB chromogen (datasheet PB10086)
CounterstainHematoxylin, blue, dehydrate and mount (standard)
Expected resultPSAT1-positive staining in bergmann glia - cytoplasm/membrane of cerebellum (HPA tissue IHC: High). HPA tissue profile: Cytoplasmic expression most abundant in exocrine pancreas, renal tubules and the CNS. No signal in the no-primary control.
💡Decision noteStart with heat mediated EDTA pH 8.0 for the catalog antibody (datasheet: PB10086); evaluate published citrate pH 6.0 conditions when adapting other antibodies (PMC5755227; PMC5721480).
Section 2

What Is the Expected PSAT1 Staining Pattern?

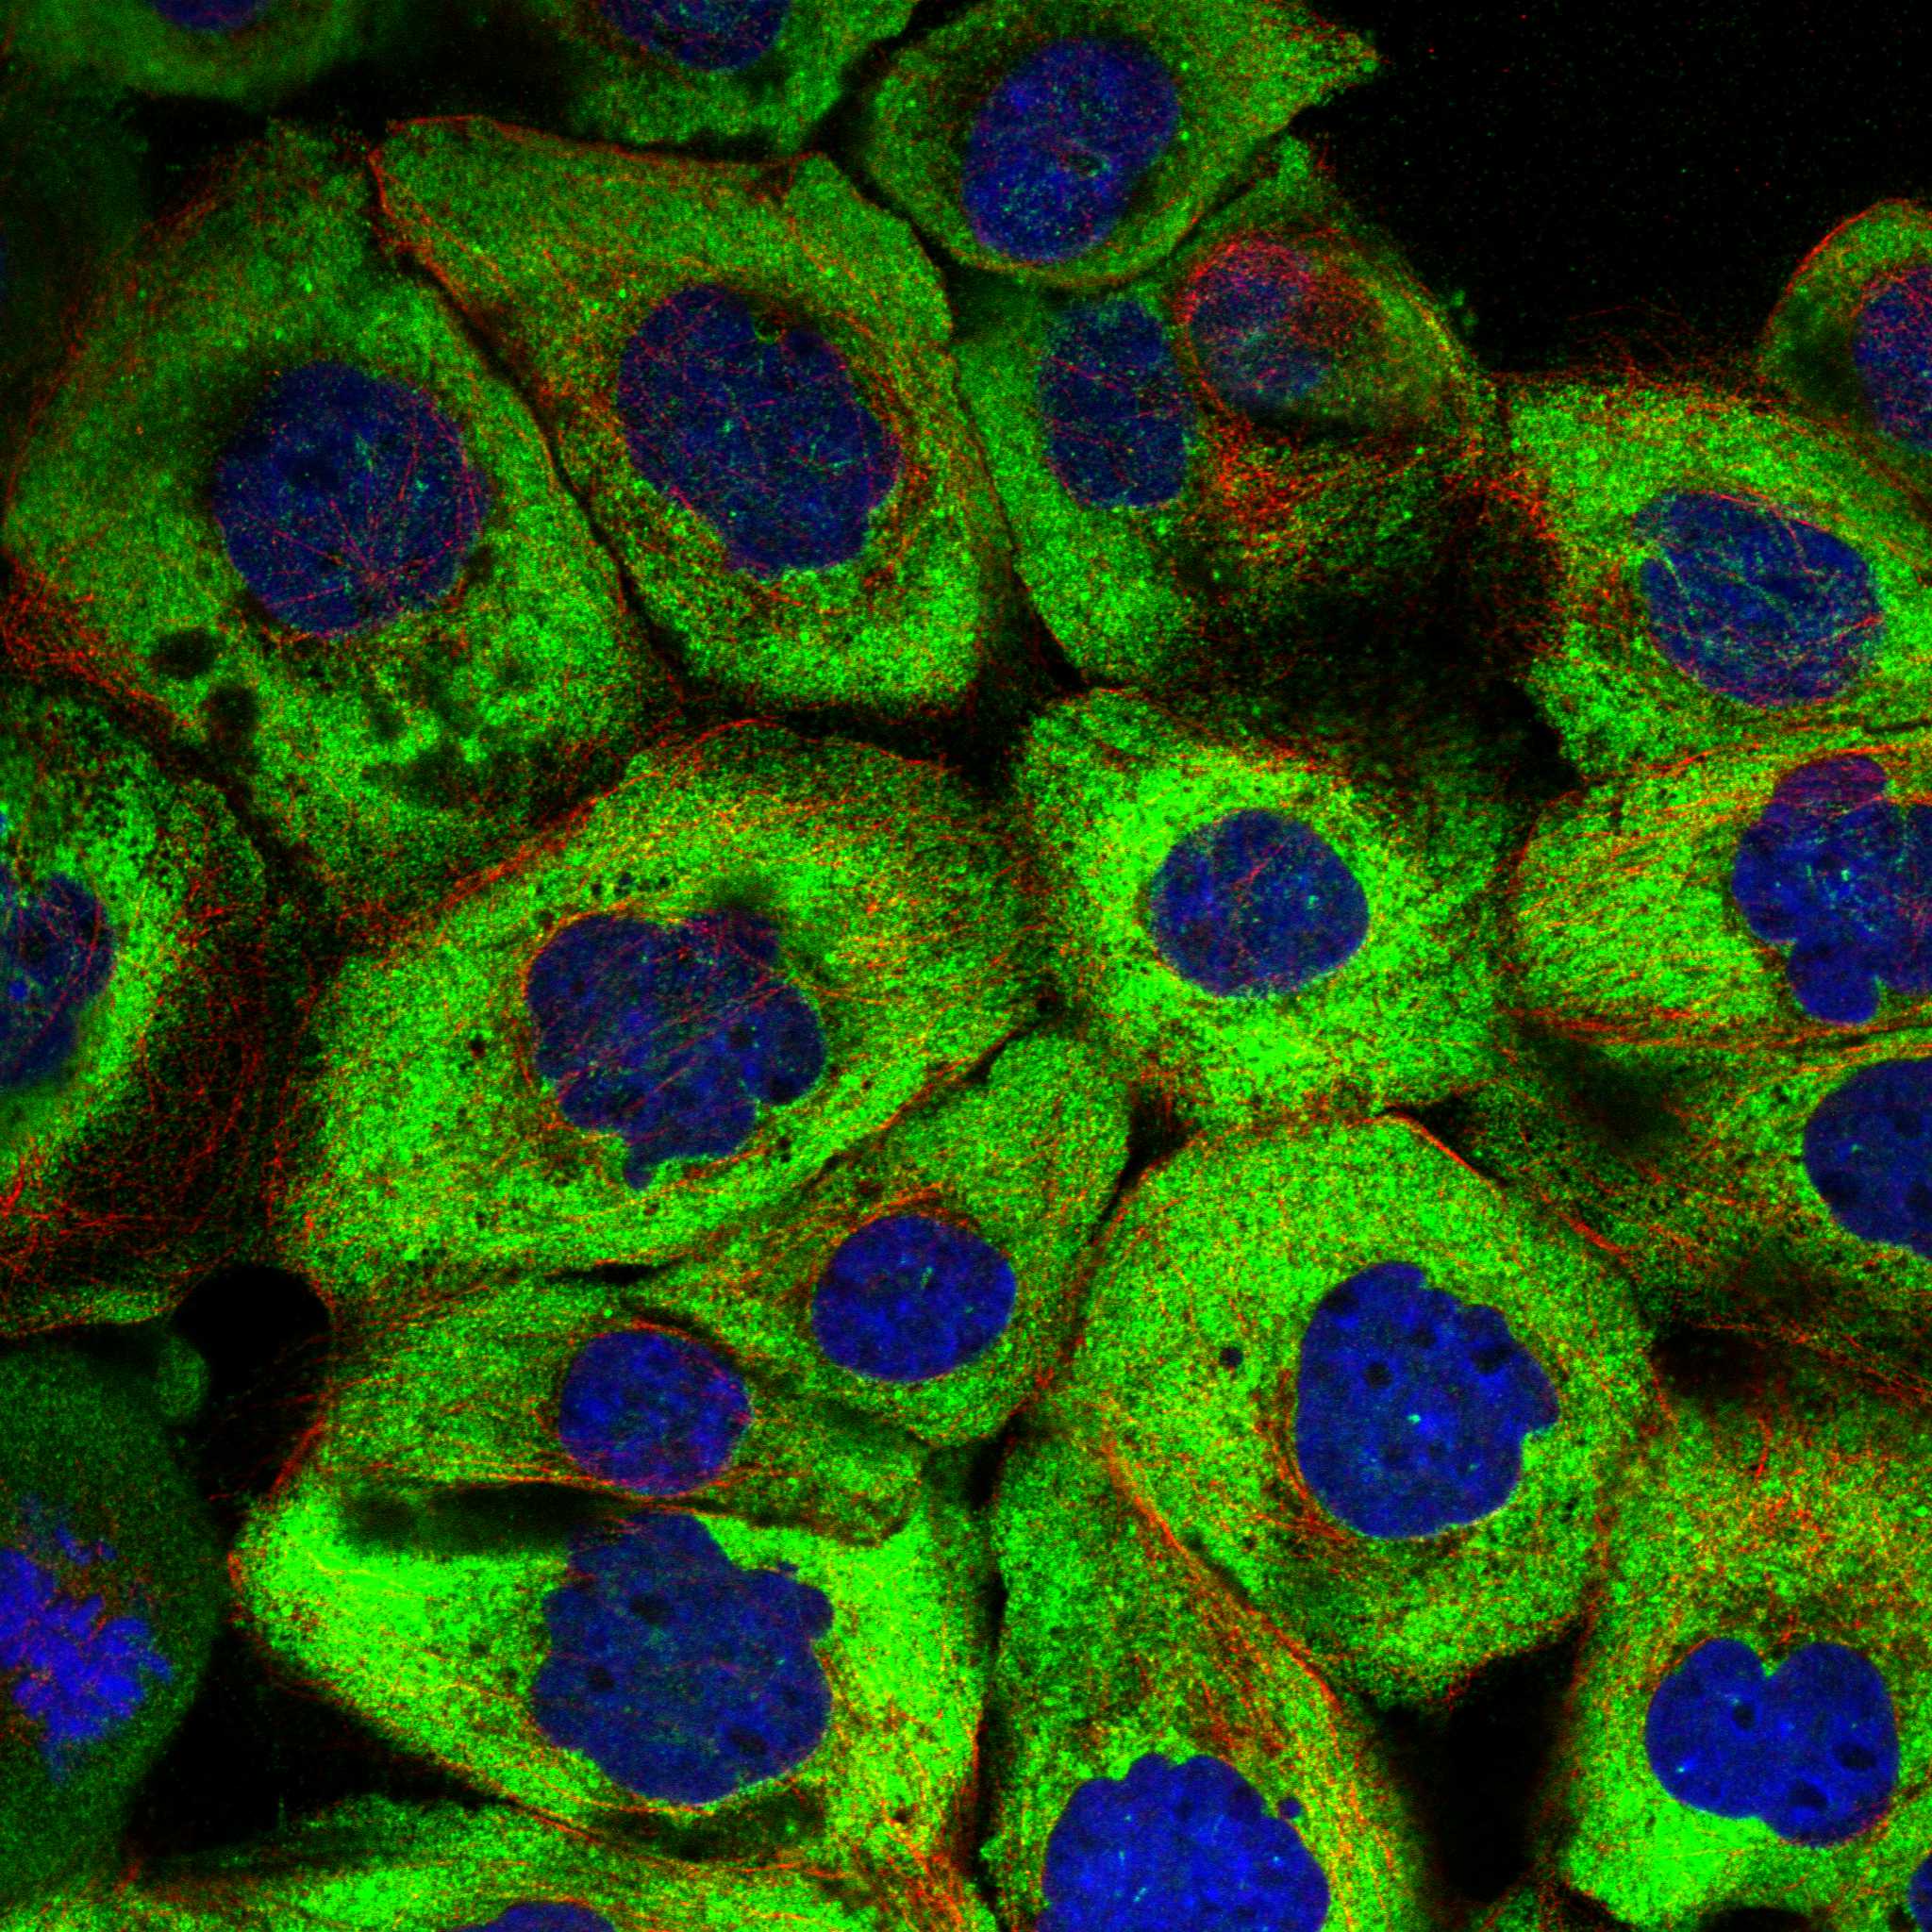
PSAT1 staining should be predominantly cytoplasmic, especially in pancreatic exocrine glandular cells, renal proximal tubules and CNS cells (HPA tissue IHC: Enhanced). HPA reports high staining in Bergmann glia, including cytoplasm/membrane, and high staining in endometrial ciliated epithelial cells (HPA tissue IHC). Cytosolic localization is independently supported by ICC-IF (HPA subcellular: enhanced); PSAT1 has no transmembrane segment (UniProt Q9Y617 topology).

What am I looking at on my slide?
Strong cytoplasmic staining in pancreatic exocrine glandular cells or renal proximal tubule cell bodies.This matches two high-staining cell populations (HPA tissue IHC: High). Score the named cells rather than treating an entire tissue section as uniformly positive (HPA tissue IHC).
Cytoplasmic staining in Bergmann glia, with some membrane-associated appearance.This is compatible with the reported cerebellar pattern (HPA tissue IHC: Bergmann glia, High, cytoplasm/membrane). Membrane-edge signal here alone does not establish a transmembrane protein (UniProt Q9Y617 topology).
Predominantly nuclear or extracellular staining replaces the expected cytoplasmic pattern.Treat it as a localization mismatch requiring investigation (HPA subcellular: Cytosol; HPA tissue IHC: cytoplasmic profile). Review morphology and controls before assigning it to PSAT1; neither source establishes nuclear or extracellular localization.
Strong staining in adipocytes or appendix glandular cells.These cells were reported as not detected (HPA tissue IHC). Check cell identity, nonspecific antibody binding and detection-system activity; an unexpected positive is not, by itself, proof of cross-reactivity (general IHC practice).
Uniform haze across cells, stroma and blank areas, or no staining in a known-positive control.Haze that ignores cell boundaries is difficult to score as PSAT1; absent control staining makes a negative test section uninterpretable (general IHC practice). Compare the expected high-staining cell populations with the matched control (HPA tissue IHC: High).
💡Expected PSAT1 appearanceCall a section positive when the expected cells show clearly stronger cytoplasmic staining—such as pancreatic exocrine cells or renal proximal tubules (HPA tissue IHC: High); nuclear-dominant, extracellular or uniform cell-independent color warrants investigation (HPA subcellular: Cytosol; general IHC practice).
How each factor affects the staining
Cell population and tissue choicePancreatic exocrine cells and renal proximal tubules provide high-staining comparators; adipocytes and appendix glandular cells are reported as not detected (HPA tissue IHC). Use cell-level comparisons because a tissue label alone does not specify every cell's result.
Intracellular distributionICC-IF places PSAT1 in the cytosol (HPA subcellular: enhanced), and UniProt lists no transmembrane segment (UniProt Q9Y617 topology). HPA also records cytoplasm/membrane staining in Bergmann glia (HPA tissue IHC); preserve that observed nuance when scoring.
Antibody evidenceHPA lists enhanced IHC validation for CAB014882 and CAB040567; CAB040567 also has supported ICC validation (HPA antibodies). Those statuses support their reported applications but do not validate an unlisted antibody or determine its dilution.
IF/ICC Q&A: Where should fluorescence appear?Predominantly in the cytosol (HPA subcellular: Cytosol, enhanced). HPA lists ICC-IF images from A-431, U-251MG, U2OS, Hep-G2 and SK-MEL-30 (HPA subcellular); that evidence does not supply an IF protocol for this IHC guide.
Why is my staining missing, weak or wrong?
SituationLikely causeNext action
No staining in pancreatic exocrine cells or renal proximal tubules.These are high-staining populations (HPA tissue IHC: High); the result may reflect a failed run, unsuitable detection settings or a sample-specific difference (general IHC practice).Inspect the matched positive control, section integrity, reagent steps and detection performance; optimize retrieval only as a general IHC workflow variable, without assuming PSAT1-specific fixation sensitivity.
The test section is negative, but its positive control stains as expected.PSAT1 staining varies by cell population (HPA tissue IHC); a negative area may contain cells with lower or undetected staining.Identify the cells being scored and compare them with HPA's cell-specific profile; record the finding as sample-specific rather than declaring assay failure (HPA tissue IHC; general IHC practice).
Nuclei dominate the staining while cytoplasm is faint.Nuclear-dominant signal conflicts with the reported cytosolic location (HPA subcellular: enhanced) and cytoplasmic tissue profile (HPA tissue IHC).Recheck counterstain and morphology, then compare a matched positive control and detection controls before interpreting nuclear color as target signal (general IHC practice).
Unexpected strong color appears in adipocytes or appendix glandular cells.Both cell populations are listed as not detected (HPA tissue IHC). Nonspecific binding or endogenous detection activity is possible, but the image alone cannot distinguish them (general IHC practice).Confirm cell identity and examine appropriate antibody-omission and detection controls; assess any residual staining before changing the PSAT1 interpretation (general IHC practice).
Diffuse color obscures cell boundaries throughout the section.Background can arise from blocking, washing or detection conditions (general IHC practice); HPA's cell-specific PSAT1 profile does not explain uniform color (HPA tissue IHC).Check a detection control, review wash and blocking conditions, and score only when cellular staining can be separated from background (general IHC practice).
Bergmann glia show a membrane-edge component.HPA explicitly records cytoplasm/membrane staining in these cells (HPA tissue IHC: Bergmann glia, High), although PSAT1 has no transmembrane segment (UniProt Q9Y617 topology).Assess whether cytoplasmic staining accompanies the edge signal and whether the pattern follows Bergmann glial morphology; do not classify that component alone as an artifact (HPA tissue IHC; general IHC practice).

Sample controls for PSAT1 IHC & IF

🧪Run kidney first: proximal tubule cell bodies should stain (HPA: High in kidney proximal tubules). Use adipose tissue as the negative comparison (HPA: Not detected in adipocytes); cells on the kidney slide without specific PSAT1 staining should show only background chromogen, without proximal-tubule-like cell-body signal (standard IHC practice).
Positive control tissue: Cerebellum (Bergmann glia - cytoplasm/membrane, HPA High)
Negative control tissue: Adipose tissue (HPA Not detected)
ICC-IF cell lines (HPA subcellular resource): HPA ICC-IF images show PSAT1 in A-431, U-251MG, U2OS, Hep-G2, SK-MEL-30, with annotated localisation: Cytosol (enhanced) (HPA subcellular).
Technical controls: Include no-primary (secondary-only) and concentration-matched rabbit isotype controls, plus PSAT1-knockout tissue if available or an immunizing-peptide block if the peptide is available (standard IHC practice; selected-SKU caption: rabbit primary antibody). For kidney sections, block endogenous peroxidase and check endogenous biotin when using the caption’s streptavidin–biotin/DAB detection system (standard IHC practice; selected-SKU caption: SABC with DAB).
⚠️Feasibility: A target-specific fixation window or fixation effect is unreported, and the selected-SKU paraffin-section caption does not state the fixative (selected-SKU caption: fixative not stated). Heat retrieval in EDTA at pH 8.0 was used for the reported mouse liver paraffin-section staining, but whether PSAT1 staining requires that retrieval condition is unreported (selected-SKU caption: EDTA pH 8.0). The supplied evidence does not establish that frozen sections or IF are easier than paraffin IHC; kidney staining with biotin-based detection needs attention to endogenous biotin (HPA: kidney proximal tubules High; selected-SKU caption: SABC with DAB; standard IHC practice).

HPA tissue IHC evidence for PSAT1

Comprehensive Human Protein Atlas IHC scoring per tissue (reliability: Enhanced — High consistency between antibody staining and RNA expression data.). Rows are taken directly from the HPA tissue chart — click any row's HPA link to view the source.

Positive expression · recommended positive controls

TissueCell typeLevelEvidenceSource
Cerebellum Bergmann glia - cytoplasm/membrane High Protein (IHC) HPA →
Endometrium Ciliated epithelial cells High Protein (IHC) HPA →
Kidney Proximal tubules (cell body) High Protein (IHC) HPA →
Pancreas Exocrine glandular cells High Protein (IHC) HPA →
Adrenal gland Glandular cells Medium Protein (IHC) HPA →

Undetected expression · recommended negative controls

TissueCell typeLevelEvidenceSource
Adipose tissue Adipocytes Not detected Protein (IHC) HPA →
Appendix Glandular cells Not detected Protein (IHC) HPA →
Breast Adipocytes Not detected Protein (IHC) HPA →
Bronchus Respiratory epithelial cells Not detected Protein (IHC) HPA →
Cervix Glandular cells Not detected Protein (IHC) HPA →
Section 3

Advanced PSAT1 IHC Tips

Troubleshoot chromogenic PSAT1 staining in paraffin sections using the catalog antibody’s tissue example and independent expression patterns as reference points.

What retrieval should I try first when PSAT1 staining is weak?
Use heat-mediated antigen retrieval in EDTA at pH 8.0 before chromogenic PSAT1 IHC (datasheet PB10086). The paraffin-section example paired this retrieval with 1 μg/ml primary antibody overnight at 4°C and DAB development (caption PB10086). Check a known positive region, such as renal proximal tubule cell bodies, while keeping section thickness, heating time, cooling, and detection consistent across slides (HPA tissue IHC; standard IHC practice). If staining remains weak, assess another retrieval buffer as a documented fallback on paired sections, including a no-primary control to reveal nonspecific chromogen deposition (standard IHC practice).
Could fixation explain weak or uneven PSAT1 staining?
The selected paraffin-section caption does not report its fixative, so PSAT1-specific fixation sensitivity is unknown for this antibody (caption PB10086). Record fixative, fixation duration, tissue thickness, and time before processing for each specimen, because variation in these conditions can change antigen accessibility in IHC (standard IHC practice). Compare adjacent sections processed under matched conditions before changing retrieval or primary-antibody concentration; use the documented EDTA pH 8.0 retrieval as the reference condition (datasheet PB10086; standard IHC practice). Do not attribute staining differences to PSAT1 acetylation or pyridoxal-phosphate binding without direct fixation evidence for those effects (UniProt Q9Y617 modified residues).
Where should convincing PSAT1 staining appear within cells and tissues?
Look principally for cytoplasmic staining in tissue sections, with strong examples in exocrine pancreatic cells and renal proximal tubule cell bodies (HPA tissue IHC). Independent cell imaging places PSAT1 in the cytosol, while the selected antibody shows staining in a paraffin-embedded mouse liver section (HPA subcellular; caption PB10086). Evaluate the cell body separately from nuclei and tissue borders, and compare the pattern with matched morphology and a no-primary control (standard IHC practice). Because UniProt does not annotate a PSAT1 subcellular location, treat a predominantly nuclear or sharply membranous DAB pattern as a finding requiring independent validation (UniProt Q9Y617; HPA subcellular).
Can this stain distinguish PSAT1 isoforms or modified epitopes?
PSAT1 has 2 listed isoforms, but the supplied IHC caption does not identify the antibody epitope or establish isoform specificity (UniProt Q9Y617 isoforms; caption PB10086). Its annotated protein chain spans residues 1–370, with no signal peptide, propeptide, or transmembrane segment reported (UniProt Q9Y617 processing and topology). Annotated modifications include acetylated lysines and pyridoxal-phosphate-bound lysine 200; their effects on this antibody’s staining have not been established (UniProt Q9Y617 modified residues; caption PB10086). Interpret DAB intensity as antibody-reactive PSAT1 signal until epitope mapping or an independent isoform-specific method supports a narrower claim (standard IHC practice).
How should I assess PSAT1 in a companion multiplex IF experiment?
Use this page’s chromogenic tissue result only as an IHC reference; the selected paraffin-section caption supplies no IF fixation or permeabilisation conditions (caption PB10086). For a companion IF experiment, pair PSAT1 with a marker identifying the expected cell population, such as renal proximal tubule cells, and assess cytosolic overlap within correctly identified cells (HPA tissue IHC; HPA subcellular). Choose a fluorophore channel with low background in the specimen and include single-channel and no-primary controls to assess autofluorescence and spectral bleed-through (standard IF practice). Since PSAT1 has no annotated transmembrane segment and is observed in the cytosol, permeabilise appropriately for intracellular antigen access, then verify morphology and signal retention empirically (UniProt Q9Y617 topology; HPA subcellular; standard IF practice).
How can I separate PSAT1 signal from chromogenic background?
Start by comparing the stained section with a no-primary control and inspect whether DAB follows cellular morphology or appears diffusely across tissue and slide edges (standard IHC practice). The selected example used 10% goat serum blocking, a biotinylated secondary antibody, a streptavidin-biotin complex, and DAB detection (caption PB10086). Include an appropriate endogenous peroxidase block and assess detection-reagent background, especially when interpreting weak staining with this chromogenic workflow (standard IHC practice). If background persists, titrate primary antibody around the documented 1 μg/ml condition while keeping retrieval at EDTA pH 8.0 and processing matched controls together (caption PB10086; datasheet PB10086; standard IHC practice).
How should I score PSAT1 across heterogeneous tissue sections? ⚠ ANSWER MARKED FOR VERIFICATION
Define the cell population and cytoplasmic region before scoring, because HPA reports PSAT1 abundance in specific compartments including renal proximal tubule cell bodies and exocrine pancreatic cells (HPA tissue IHC). For chromogenic IHC, report the percentage of positive target cells and an intensity-weighted H-score, using the same scoring thresholds and DAB development conditions across specimens (standard IHC practice). Normalise positive-cell counts or stained area to the number of eligible cells or the measured viable tissue area, rather than the whole slide (standard IHC practice). Exclude folds, necrosis, and tissue edges by prespecified rules, and document retrieval at EDTA pH 8.0 when comparing batches (datasheet PB10086; standard IHC practice).
What would make an apparent PSAT1-positive result doubtful?
A credible positive should follow cellular cytoplasm in an expected population, such as exocrine pancreatic cells or renal proximal tubule cell bodies (HPA tissue IHC). Predominantly nuclear staining conflicts with the independently observed cytosolic location and merits confirmation with controls or another assay (HPA subcellular; standard IHC practice). Treat signal restricted to section edges, necrotic zones, or areas positive in the no-primary control as possible processing or detection artefact (standard IHC practice). Because the selected workflow uses DAB after a biotin-based detection sequence, check endogenous enzyme and detection-reagent background before interpreting faint brown deposits as altered PSAT1 expression (caption PB10086; standard IHC practice).
Boster reagents

Best PSAT1 / Phosphoserine aminotransferase IHC Antibodies

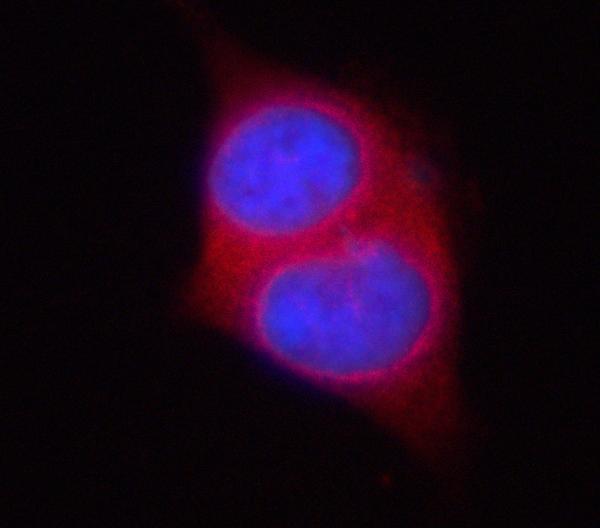
Anti-PSAT1 antibodies have IHC images from paraffin sections of mouse and rat liver and human mammary cancer, plus an IF image from PC-3 cells (catalog image captions).

Real IHC data IHC analysis of PSAT1 using anti-PSAT1 antibody (PB10086). PSAT1 was detected in a paraffin-embedded section of mouse liver tissue. Heat mediated antigen retrieval was performed in EDTA buffer (pH 8.0, epitope retrieval solution). The tissue section was blocked with 10% goat serum. The tissue section was then incubated with 1 μg/ml rabbit anti-PSAT1 Antibody PB10086) overnight at 4°C. Biotinylated goat anti-rabbit IgG was used as secondary antibody and incubated for 30 minutes at 37°C. The tissue section was developed using Strepavidin-Biotin-Complex (SABC) (Catalog # SA1022) with DAB as the chromogen.
Anti-Phosphoserine Aminotransferase/PSAT1 Antibody ®
Cat # PB10086
Real IF data IF analysis of PSAT1 using anti-PSAT1 antibody (A06277). PSAT1 was detected in an immunocytochemical section of PC-3 cells. Enzyme antigen retrieval was performed using IHC enzyme antigen retrieval reagent (AR0022) for 15 mins. The cells were blocked with 10% goat serum. And then incubated with 5 μg/mL rabbit anti-PSAT1 Antibody (A06277) overnight at 4°C. Cy3 Conjugated Goat Anti-Rabbit IgG (BA1032) was used as secondary antibody at 1:500 dilution and incubated for 30 minutes at 37°C. The section was counterstained with DAPI. Visualize using a fluorescence microscope and filter sets appropriate for the label used.
Anti-PSAT1 Antibody ®
Cat # A06277

PB10086 supports IHC in paraffin sections, with images from mouse and rat liver and human mammary cancer (PB10086 image captions). A06277 supports IF/ICC, with an IF image from PC-3 cells (A06277 applications and image caption).

Which to pick: Choose PB10086 for tissue IHC: its paraffin-section images use heat retrieval, and the fixative is unreported (PB10086 image captions). Choose A06277 for IF/ICC; its cell image uses enzyme retrieval, and it has no listed IHC application (A06277 image caption and applications). Both list human, mouse and rat reactivity, but PB10086 has IHC images from all three species; clonality is unreported for both (catalog reactivity, PB10086 image captions, catalog clone fields).

Each figure is that product's own IHC / IF validation image from its datasheet.

References

  1. UniProt Consortium. UniProt entry Q9Y617 (SERC_HUMAN, Phosphoserine aminotransferase).
  2. Human Protein Atlas. PSAT1 tissue IHC expression (reliability: Enhanced).
  3. Human Protein Atlas. PSAT1 subcellular location (ICC-IF): Localized to the cytosol..
  4. Human Protein Atlas. PSAT1 antibody validation summary (3 antibodies).
  5. Overexpression of the PSAT1 Gene in Nasopharyngeal Carcinoma Is an Indicator of Poor Prognosis. Journal of Cancer 2016 — PMC4911876.
  6. Identification and validation of PSAT1 as a potential prognostic factor for predicting clinical outcomes in patients with colorectal carcinoma. Oncology letters 2017 — PMC5755227.
  7. PSAT1 Promotes Metastasis via p-AKT/SP1/ITGA2 Axis in Estrogen Receptor-Negative Breast Cancer Cell. Biomolecules 2024 — PMC11352415.
  8. PSAT1 is regulated by ATF4 and enhances cell proliferation via the GSK3β/β-catenin/cyclin D1 signaling pathway in ER-negative breast cancer. Journal of experimental & clinical cancer research : CR 2017 — PMC5721480.
  9. PubMed PMID:12633500 — UniProt-cited evidence.
  10. PubMed PMID:15164053 — UniProt-cited evidence.
  11. PubMed PMID:15489334 — UniProt-cited evidence.