PSMB1 / Proteasome subunit beta type-1 · Western blot design guide

Design a Western Blot for PSMB1

Source-linked PSMB1 Western blot protocol options, expected-band and isoform facts, troubleshooting for weak or shifted signal, and recommended anti-PSMB1 WB antibodies. Everything you need to plan the experiment before you commit precious samples.

Evidence assembled September 2026 · For research use; verify linked source records and product datasheet before use
Western blot protocol sheet for PSMB1: expected band ~26.5 kDa, hero antibody A06891, catalog values and labelled standard workflow; separate PMC comparisons on the guide
Printable PSMB1 Western blot protocol sheet — expected band ~26.5 kDa, antibody A06891, controls and PMC citations. Open the full PSMB1 WB guide →

PSMB1 Western Blot Experimental Design Guide

Expected bands, source-linked protocol options, controls and antibodies — the at-a-glance facts below, then the full design guide.

Must know before running
Expected band ~26.5 kDa
Gel 12–15% (standard starting point)
Positive control ⓘ Adrenal gland (IHC candidate; verify WB) +4 more
Negative control ⓘ Suggested KO / knockdown lysate
Important caveats
Reasons your observed band may differ from the expected size.
PTM Glycosylated + Phosphorylated
Caveat Precursor processing
Gene-set association MSigDB C7 membership
Isoform 1 isoform(s)
Section 1

Source-Linked PSMB1 Western Blot Protocol Options

The A06891 protocol combines labelled catalog values with standard starting conditions. Published comparisons retain their own sample, reagent and detection scope.

Recommended Western blot protocol parameters
Sample / lysateextracts of various cell lines, (catalog A06891)
Gel %12–15% (standard starting point)
Load20–30 µg total protein per lane; optimize for abundance (standard starting point)
TransferShort semi-dry transfer; verify retention (standard starting point)
Membrane0.45 µm PVDF (standard starting point)
BlockingBlocking buffer: 3% nonfat dry milk in TBST (catalog A06891)
Primary antibodyA06891 · 1:1000 (catalog A06891)
Primary incubationOvernight at 4 °C (standard starting point)
Secondary antibodyGoat Anti-Rabbit IgG, 1:10000 (catalog A06891)
Secondary incubation1 h at room temperature (standard starting point)
Wash3 × 5 min in TBST (standard starting point)
DetectionECL (catalog A06891)
Section 2

What Is the Expected PSMB1 Western Blot Band Size?

PSMB1 has a predicted 26.5 kDa precursor; propeptide cleavage and O-linked GlcNAc are annotated, but their effects on observed migration are not established.

What am I looking at on my blot?
Band near 26.5 kDaconsistent with the predicted PSMB1 precursor; confirm identity with an antibody control
Band below 26.5 kDacould reflect removal of the 1..28 propeptide
Single band without a resolved glycosylated formO-linked GlcNAc is annotated at Ser58 and Ser209, but visible separation is not established
Bands in cytoplasmic and nuclear fractionsconsistent with PSMB1 localization in both compartments
💡Expected PSMB1 appearanceThe predicted 26.5 kDa mass describes the precursor; cleavage of its 1..28 propeptide may yield a smaller band, but no empirical band size or demonstrated migration effect is supplied, so confirm band identity experimentally.
How each factor affects band size
Predicted precursor mass26.5 kDa is the sequence-based reference, not a measured band position
Propeptide at residues 1..28cleavage can make the mature protein smaller than the precursor
O-linked GlcNAc at Ser58a modification site is annotated, but a visible shift is not established
O-linked GlcNAc at Ser209a modification site is annotated, but a visible shift is not established
Why is my band missing or off?
SituationLikely causeNext action
Band higher than expecteduncleaved precursor may run above a processed speciescheck precursor and mature forms with an independent PSMB1 antibody
Band lower than expectedremoval of the 1..28 propeptide may reduce sizeconfirm the band with PSMB1 depletion and an independent antibody
Multiple bandsprecursor and processed PSMB1 may coexist; other bands may be nonspecificcompare reducing blots after PSMB1 depletion
Weak or no signalPSMB1 may be distributed between cytoplasm and nucleuscheck matched fractions and whole-cell lysate with loading controls
Fragments below expected sizeadditional breakdown is not explained by the annotated propeptide aloneprepare lysate with protease inhibitors and verify fragments by PSMB1 depletion

Sample controls for PSMB1 Western blot

🧪HPA-IHC candidate guidance (verify in WB): For positive controls for PSMB1 in Western blot, you can use adrenal gland lysate, which shows high HPA expression.
Positive control: Adrenal gland (IHC candidate; verify WB)
Negative control: Suggested KO / knockdown lysate
Loading controls: Run GAPDH, β-actin, and a total-protein stain such as Ponceau alongside.
⚠️Feasibility: HPA reports low expression even in the weakest tissues listed, so use siRNA knockdown or a KO line for a clean negative control.

HPA tissue expression evidence for PSMB1

Comprehensive Human Protein Atlas IHC scoring per tissue. Rows are taken directly from the HPA tissue chart — click any row's HPA link to view the source.

Higher expression tissues · candidate positive controls from IHC

TissueCell typeLevelEvidenceSource
Adrenal gland glandular cells High Protein (IHC) HPA →
Appendix glandular cells High Protein (IHC) HPA →
Bronchus respiratory epithelial cells High Protein (IHC) HPA →
Colon glandular cells High Protein (IHC) HPA →
Duodenum glandular cells High Protein (IHC) HPA →

Lower expression tissues · IHC evidence, not confirmed WB-negative controls

TissueCell typeLevelEvidenceSource
Adipose tissue adipocytes Low Protein (IHC) HPA →
Heart muscle cardiomyocytes Low Protein (IHC) HPA →
Skeletal muscle myocytes Low Protein (IHC) HPA →
Smooth muscle smooth muscle cells Low Protein (IHC) HPA →
Bone marrow hematopoietic cells Medium Protein (IHC) HPA →
Section 3

Advanced PSMB1 Western Blot Tips

Deeper troubleshooting and optimisation questions for PSMB1, answered from its protein features.

How should PSMB1 band migration be interpreted?
Band shift · Use the separately labelled calculated mass and catalog-observed evidence above. A sequence annotation does not establish an observed migration shift. Verify target identity with orthogonal controls.
Could extra PSMB1 bands represent isoforms?
Isoforms · The supplied record lists one isoform and no alternative sequence. Do not assign extra bands to splice isoforms from this evidence alone; compare them with the expected precursor and processed forms and verify antibody specificity.
Which phosphorylation sites matter when interpreting PSMB1 bands?
PTM · UniProt lists phosphoserine at positions 62, 68, and 162, and phosphotyrosine at 150. These are coordinates in the supplied 241-residue sequence; antibody or paper numbering may differ. Phosphorylation is a plausible variable to investigate, but listed sites do not establish a visible shift.

UniProt lists O-linked GlcNAc at serines 58 and 209, using coordinates in the supplied sequence. Consider these sites when investigating migration differences, but their presence alone does not establish a visible shift or explain a particular band.

UniProt lists N-acetylmethionine at position 1 and N6-acetyllysine at position 204. Position 1 lies within the annotated propeptide at positions 1–28, so an assay for that N-terminal modification may distinguish precursor from processed protein. All positions use the supplied UniProt sequence numbering.
Does this guide establish induction of PSMB1?
Induction · No general induction response is established by this guide. A pathway or gene-set association is not evidence of induction in a particular specimen. Verify the relevant treatment and control in a target-specific experiment.
How should transfer be checked for PSMB1?
Transfer · Standard workflow guidance: verify transfer efficiency for the intended target size before interpreting a weak signal. Use total-protein assessment and optimize transfer for the membrane, gel and apparatus; the labelled catalog values take precedence.
How should blocking be optimized?
Blocking · Standard workflow guidance: follow the A06891 datasheet where specified. Otherwise compare 5% milk or 5% BSA in TBST; for a phospho-specific assay start with BSA. Optimize background and specific signal with matched controls.
How should nuclear and cytoplasmic PSMB1 signals be quantified?
Quantitation · PSMB1 is listed in both cytoplasm and nucleus, with nuclear translocation following interaction with AKIRIN2 and IPO9. Quantify each fraction with appropriate fraction loading controls and assess their relative distribution; a stronger nuclear signal need not mean more total PSMB1.
Why might PSMB1 migrate below its predicted 26.5 kDa mass?
Interpretation · The 26.5 kDa prediction is for the 241-residue sequence, which includes a propeptide at UniProt positions 1–28. Processing could yield a smaller mature protein. No observed band mass is supplied, so the size difference cannot be confirmed here.

Compare its size with the 26.5 kDa full-length prediction and account for the propeptide at UniProt positions 1–28. Check antibody specificity and whether the band changes with sample preparation. The listed phosphorylation, O-GlcNAc, and acetylation sites suggest variables to investigate, but none proves the identity of an unexpected band.
Boster reagents

PSMB1 Western Blot Antibodies

Catalog antibodies with Western blot application and product-specific WB images. Evaluate suitability with the reported sample, controls and experimental conditions.

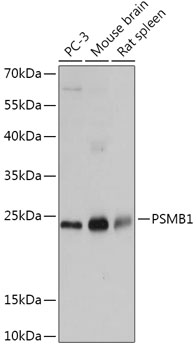
Real WB data Western blot analysis of extracts of various cell lines, using PSMB1 antibody at 1:1000 dilution. Secondary antibody: HRP Goat Anti-Rabbit IgG at 1:10000 dilution. Lysates/proteins: 25ug per lane. Blocking buffer: 3% nonfat dry milk in TBST. Detection: ECL Basic Kit . Exposure time: 1s.
Anti-Proteasome subunit beta type-1 PSMB1 Antibody
Cat # A06891

the supplier A06891 is listed for human, mouse, and rat PSMB1 and has a Western blot image using cell-line extracts at 1:1000 dilution and 25 µg per lane. The caption does not identify the cell lines or their species.

Which to pick: A06891 is the only listed option. It has a WB image; check that its stated human, mouse, or rat reactivity fits your sample. The image caption does not establish which species were tested.

Source: BosterBio PSMB1 gene-info card — filtered to Western-blot-capable antibodies; each card shows that product's actual WB validation figure.