PSMD14 / Ubiquitin C-terminal hydrolase PSMD14 · Western blot design guide

Design a Western Blot for PSMD14

Source-linked PSMD14 Western blot protocol options, expected-band and isoform facts, troubleshooting for weak or shifted signal, and recommended anti-PSMD14 WB antibodies. Everything you need to plan the experiment before you commit precious samples.

Evidence assembled September 2026 · For research use; verify linked source records and product datasheet before use
Western blot protocol sheet for PSMD14: expected band ~34.6 kDa, hero antibody M06584, catalog values and labelled standard workflow; separate PMC comparisons on the guide
Printable PSMD14 Western blot protocol sheet — expected band ~34.6 kDa, antibody M06584, controls and PMC citations. Open the full PSMD14 WB guide →

PSMD14 Western Blot Experimental Design Guide

Expected bands, source-linked protocol options, controls and antibodies — the at-a-glance facts below, then the full design guide.

Must know before running
Expected band ~34.6 kDa
Observed band ~35 kDa
Gel 10% (catalog M06584)
Positive control ⓘ Adipose tissue (IHC candidate; verify WB) +4 more
Negative control ⓘ Fallopian tube (IHC candidate; verify WB)
Important caveats
Reasons your observed band may differ from the expected size.
PTM Phosphorylated
Caveat Phosphorylation-state controls
Gene-set association MSigDB Hallmark membership
Isoform 1 isoform(s)
Section 1

Source-Linked PSMD14 Western Blot Protocol Options

The M06584 protocol combines labelled catalog values with standard starting conditions. Published comparisons retain their own sample, reagent and detection scope.

Recommended Western blot protocol parameters
Sample / lysatehuman 293T, human Hela, human Jurkat, human HT1080, rat heart, rat skeletal muscle, mouse heart, mouse skeletal muscle (catalog M06584)
Gel %10% (catalog M06584)
Load30 ug; reducing conditions (catalog M06584)
Transfera nitrocellulose membrane at 150 mA for 50-90 minutes (catalog M06584)
Membranenitrocellulose membrane (catalog M06584)
Blocking5% non-fat milk/TBS for 1.5 hour at RT (catalog M06584)
Primary antibodyM06584 · 1:500 (catalog M06584)
Primary incubationovernight at 4°C (catalog M06584)
Secondary antibodygoat anti-rabbit IgG-HRP, 1:5000 (catalog M06584)
Secondary incubation1.5 hour at RT (catalog M06584)
WashTBS-0.1%Tween 3 times with 5 minutes each (catalog M06584)
DetectionECL (catalog M06584)
Section 2

What Is the Expected PSMD14 Western Blot Band Size?

PSMD14 is predicted at 34.6 kDa and observed at ~35 kDa; the small difference has no established cause in the supplied features.

What am I looking at on my blot?
Single band at ~35 kDaMatches the empirical PSMD14 band near its 34.6 kDa predicted mass; confirm identity with a PSMD14 control
Slight mobility variation near 35 kDaPhosphorylation at Ser150, Ser224, or Thr266 could affect migration, but no shift is established
Nearby doublet around 35 kDaDifferent phosphorylation states are possible, but their resolution as separate bands is unproven
High molecular weight signal under native conditionsCould reflect PSMD14 within the proteasome regulatory particle; complex migration is not established for this blot
💡Expected PSMD14 appearancePSMD14 has a predicted mass of 34.6 kDa and an empirical band at ~35 kDa in reducing whole-cell blots; verify band identity with a PSMD14 depletion or independent antibody control.
How each factor affects band size
Predicted PSMD14 mass34.6 kDa predicted; the observed band is ~35 kDa
Phosphoserine at Ser150Could alter mobility slightly; a visible shift is not established
Phosphoserine at Ser224Could alter mobility slightly; a visible shift is not established
Phosphothreonine at Thr266Could alter mobility slightly; a visible shift is not established
Why is my band missing or off?
SituationLikely causeNext action
Band higher than expectedPhosphorylation could affect mobility, but a large shift has no established feature-based explanationCompare with the ~35 kDa reference band and verify identity by PSMD14 depletion
Band lower than expectedPossible degradation or an unrelated antibody-reactive protein; no cleavage feature is listedUse fresh lysate with protease inhibitors and verify identity by PSMD14 depletion
Multiple bandsDifferent phosphorylation states are possible, but distinct bands are unprovenCompare phosphatase-treated and untreated lysates, then confirm candidate bands by PSMD14 depletion
Weak or no signalPSMD14 detection or sample preparation may be inadequateCheck loading and transfer, then run a lysate known to show the ~35 kDa band
Fragments below expected sizePossible sample degradation; no precursor cleavage is listedPrepare fresh lysate with protease inhibitors and check whether the fragments track with PSMD14 depletion

Sample controls for PSMD14 Western blot

🧪HPA-IHC candidate guidance (verify in WB): For positive controls for PSMD14 in Western blot, you can use adipose tissue, which HPA scores as medium expression.
Positive control: Adipose tissue (IHC candidate; verify WB)
Negative control: Fallopian tube (IHC candidate; verify WB)
Loading controls: Run GAPDH, β-actin, and a total-protein stain alongside the samples.
⚠️Feasibility: HPA reports medium expression in the positive tissue and no detection in fallopian tube, so verify the contrast in your samples.

HPA tissue expression evidence for PSMD14

Comprehensive Human Protein Atlas IHC scoring per tissue. Rows are taken directly from the HPA tissue chart — click any row's HPA link to view the source.

Higher expression tissues · candidate positive controls from IHC

TissueCell typeLevelEvidenceSource
Adipose tissue adipocytes Medium Protein (IHC) HPA →
Adrenal gland glandular cells Medium Protein (IHC) HPA →
Appendix glandular cells Medium Protein (IHC) HPA →
Bone marrow hematopoietic cells Medium Protein (IHC) HPA →
Caudate neuronal cells Medium Protein (IHC) HPA →

Lower expression tissues · IHC evidence, not confirmed WB-negative controls

TissueCell typeLevelEvidenceSource
Fallopian tube glandular cells Not detected Protein (IHC) HPA →
Lymph node germinal center cells Not detected Protein (IHC) HPA →
Prostate glandular cells Not detected Protein (IHC) HPA →
Salivary gland glandular cells Not detected Protein (IHC) HPA →
Smooth muscle smooth muscle cells Not detected Protein (IHC) HPA →
Section 3

Advanced PSMD14 Western Blot Tips

Deeper troubleshooting and optimisation questions for PSMD14, answered from its protein features.

How should PSMD14 band migration be interpreted?
Band shift · Use the separately labelled calculated mass and catalog-observed evidence above. A sequence annotation does not establish an observed migration shift. Verify target identity with orthogonal controls.
Are multiple PSMD14 isoforms expected?
Isoforms · The supplied UniProt record lists one isoform and no alternative sequence. Do not assign additional bands to documented PSMD14 isoforms on this evidence.
Could phosphorylation explain a shifted PSMD14 band?
PTM · UniProt lists phosphoserine at positions 150 and 224 and phosphothreonine at position 266. These are UniProt coordinates; antibody or paper numbering may differ. Site presence alone does not establish a visible shift or explain a mass difference.

No glycosylation sites are listed, and the glycosylation count is zero. The supplied features therefore do not support glycosylation as an explanation for a higher band.
Does this guide establish induction of PSMD14?
Induction · No general induction response is established by this guide. A pathway or gene-set association is not evidence of induction in a particular specimen. Verify the relevant treatment and control in a target-specific experiment.
How should transfer be checked for PSMD14?
Transfer · Standard workflow guidance: verify transfer efficiency for the intended target size before interpreting a weak signal. Use total-protein assessment and optimize transfer for the membrane, gel and apparatus; the labelled catalog values take precedence.
How should blocking be optimized?
Blocking · Standard workflow guidance: follow the M06584 datasheet where specified. Otherwise compare 5% milk or 5% BSA in TBST; for a phospho-specific assay start with BSA. Optimize background and specific signal with matched controls.
How should PSMD14 be quantified across samples?
Quantitation · Quantify the band near 35 kDa consistently across samples, using the same band boundaries and a validated loading normalization. PSMD14 is a component of the 19S proteasome regulatory particle, so a change in its band intensity alone does not establish a change in whole-proteasome activity.
How does the observed PSMD14 band compare with its predicted mass?
Interpretation · The observed band near 35 kDa is close to the predicted 34.6 kDa. This agreement supports the assignment, but apparent mass alone does not establish band identity.

Check whether the expected band near 35 kDa is present before assigning other bands. The record documents one isoform, three phosphorylation sites, and membership in the 19S regulatory particle; none of these features alone identifies an unexpected band.
Boster reagents

PSMD14 Western Blot Antibodies

Catalog antibodies with Western blot application and product-specific WB images. Evaluate suitability with the reported sample, controls and experimental conditions.

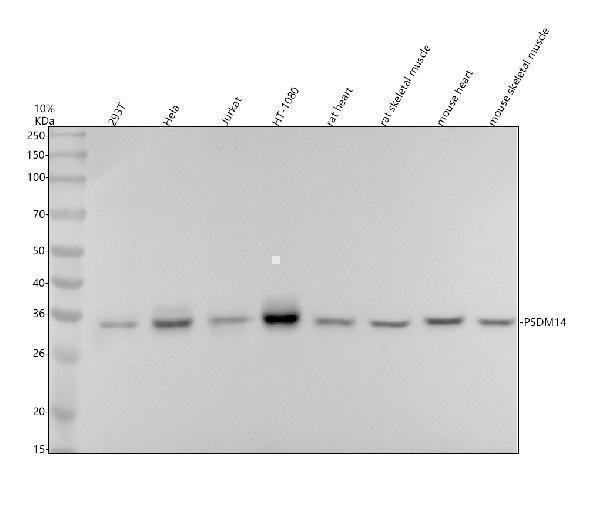
Real WB data Western blot analysis of PSDM14 using anti-PSDM14 antibody (M06584). Electrophoresis was performed on a 10% SDS-PAGE gel at 80V (Stacking gel) / 120V (Resolving gel) for 2 hours. The sample well of each lane was loaded with 30 ug of sample under reducing conditions. Lane 1: human 293T whole cell lysates, Lane 2: human Hela whole cell lysates, Lane 3: human Jurkat whole cell lysates, Lane 4: human HT1080 whole cell lysates, Lane 5: rat heart tissue lysates, Lane 6: rat skeletal muscle tissue lysates, Lane 7: mouse heart tissue lysates, Lane 8: mouse skeletal muscle tissue lysates. After electrophoresis, proteins were transferred to a nitrocellulose membrane at 150 mA for 50-90 minutes. Blocked the membrane with 5% non-fat milk/TBS for 1.5 hour at RT. The membrane was incubated with rabbit anti-PSDM14 antigen affinity purified monoclonal antibody (M06584) at 1:500 overnight at 4°C, then washed with TBS-0.1%Tween 3 times with 5 minutes each and probed with a goat anti-rabbit IgG-HRP secondary antibody at a dilution of 1:5000 for 1.5 hour at RT. The signal is developed using an ECL Plus Western Blotting Substrate (Catalog # AR1196-200) with Tanon 5200 system. A specific band was detected for PSDM14 at approximately 35 kDa. The expected band size for PSDM14 is at 35 kDa.
Anti-PSMD14 Rabbit Monoclonal Antibody
Cat # M06584
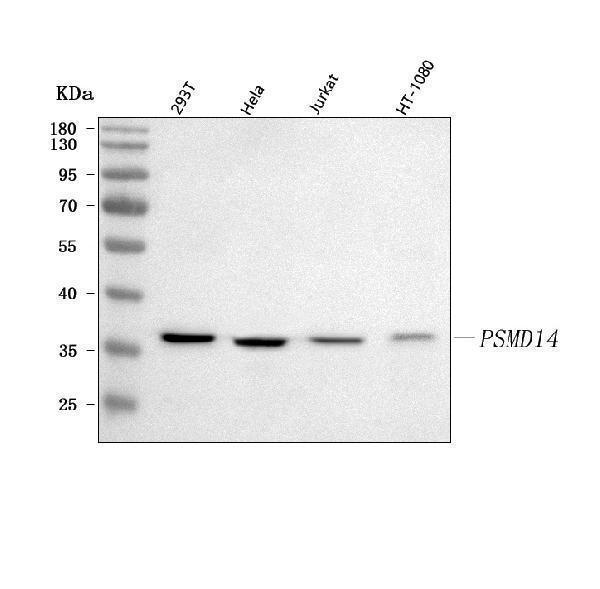
Real WB data Western blot analysis of POH1/PSMD14 using anti-POH1/PSMD14 antibody (A06584-1). Electrophoresis was performed on a 5-20% SDS-PAGE gel at 70V (Stacking gel) / 90V (Resolving gel) for 2-3 hours. The sample well of each lane was loaded with 30 ug of sample under reducing conditions. Lane 1: human 293T whole cell lysates, Lane 2: human Hela whole cell lysates, Lane 3: human Jurkat whole cell lysates, Lane 4: human HT-1080 whole cell lysates. After electrophoresis, proteins were transferred to a nitrocellulose membrane at 150 mA for 50-90 minutes. Blocked the membrane with 5% non-fat milk/TBS for 1.5 hour at RT. The membrane was incubated with rabbit anti-POH1/PSMD14 antigen affinity purified polyclonal antibody (Catalog # A06584-1) at 0.5 μg/mL overnight at 4°C, then washed with TBS-0.1%Tween 3 times with 5 minutes each and probed with a goat anti-rabbit IgG-HRP secondary antibody at a dilution of 1:5000 for 1.5 hour at RT. The signal is developed using an Enhanced Chemiluminescent detection (ECL) kit (Catalog # EK1002) with Tanon 5200 system. A specific band was detected for POH1/PSMD14 at approximately 36 kDa. The expected band size for POH1/PSMD14 is at 35 kDa.
Anti-POH1/PSMD14 Antibody Picoband®
Cat # A06584-1

Two the supplier anti-PSMD14 antibodies have WB images. M06584 shows an approximately 35 kDa band in human cell and rat and mouse tissue lysates; A06584-1 shows an approximately 36 kDa band in human cell lysates. Neither image provides independent specificity validation.

Which to pick: For rat or mouse tissue lysates, M06584 has directly shown WB examples. For human cell lysates, both have images; use the reported starting conditions: M06584 at 1:500 or A06584-1 at 0.5 μg/mL.

Source: BosterBio PSMD14 gene-info card — filtered to Western-blot-capable antibodies; each card shows that product's actual WB validation figure.