PTCD3 / Small ribosomal subunit protein mS39 · IHC design guide

Design Immunohistochemistry for PTCD3

Plan PTCD3 chromogenic IHC on paraffin sections using the documented catalog antibody workflow (datasheet A10795-1). Assess granular cytoplasmic staining by cell type, using high-staining colon glandular cells and low-staining heart cardiomyocytes as tissue references (HPA tissue IHC).

Evidence assembled Oct 2026 · For research use; verify linked source records and product datasheet before use
Immunohistochemistry protocol sheet for PTCD3 (IHC for PTCD3): expected localisation Granular cytoplasm observed (HPA tissue IHC); mitochondria expected (UniProt), antibody A10795-1, validated IHC image, and IHC protocol steps
Printable PTCD3 IHC protocol sheet — expected localisation Granular cytoplasm observed (HPA tissue IHC); mitochondria expected (UniProt), antibody A10795-1, controls and protocol steps. Open the full PTCD3 IHC guide →

PTCD3 Immunohistochemistry Experimental Design Guide

Expected localisation, validated protocols, controls and antibodies — the at-a-glance facts below, then the full design guide.

Must know before staining
Expected localisation Granular cytoplasm observed (HPA tissue IHC); mitochondria expected (UniProt)
Staining pattern General granular cytoplasmic staining in tissue cells (HPA tissue IHC)
Antigen retrieval EDTA pH 8.0 HIER, heat-mediated (datasheet A10795-1)
Positive control ⓘ Appendix+4 more · see all
Negative control ⓘ Adipose tissue+1 more · see all
Important caveats
Reasons your staining may differ from the expected pattern.
Fixation Matched tissue-IHC evidence does not establish the fixation claim. Validate the specimen-specific method before use. (selected-SKU IHC image A10795-1)
Caveat Staining and RNA show medium consistency; verify the pattern (HPA tissue IHC)
Regulation Tissue abundance varies (UniProt)
Isoform / epitope 2 isoforms; mature chain spans aa 38–689; epitopes unmapped (UniProt)
Section 1

Recommended PTCD3 IHC & IF Protocols

The catalog antibody uses heat-mediated EDTA retrieval at pH 8.0 (datasheet A10795-1); one published PTCD3 IHC study stained human and mouse prostate tissue (PMC6131642).

Recommended immunohistochemistry (IHC-P) protocol parameters
SampleParaffin-embedded human colon cancer tissue; fixative not specified (datasheet A10795-1)
FixationImage fixative and duration unreported (datasheet A10795-1); verify before use.
Sectioning4–5 µm sections on charged slides (standard)
DeparaffinisationXylene, graded ethanol series to water (standard)
Antigen retrievalHeat retrieval: EDTA pH 8.0 (datasheet A10795-1); 20 min, 95–100 °C (standard)
Peroxidase block3% H2O2, 10 min, room temperature (standard)
Blocking10% goat serum (datasheet A10795-1)
Primary antibodyRabbit anti-PTCD3, 2-5 μg/ml (datasheet A10795-1)
Primary incubationOvernight at 4 °C (datasheet A10795-1)
DetectionHRP-conjugated secondary, DAB chromogen (datasheet A10795-1)
CounterstainHematoxylin, blue, dehydrate and mount (standard)
Expected resultPTCD3-positive staining in glandular cells of appendix (HPA tissue IHC: High). HPA tissue profile: General granular cytoplasmic expression. No signal in the no-primary control.
💡Decision noteStart with EDTA at pH 8.0 for the catalog antibody (datasheet A10795-1). The published human tissue microarray used brief proteolytic digestion (PMC6131642).
Section 2

What Is the Expected PTCD3 Staining Pattern?

PTCD3 is a mitochondrial small-ribosomal-subunit protein with no annotated transmembrane segment (UniProt Q96EY7). In paraffin-section IHC, expect granular cytoplasmic staining rather than a membrane outline (HPA: general granular cytoplasmic expression; UniProt Q96EY7 topology). Strong staining is documented in selected glandular, epithelial, tubular and Purkinje cells (HPA tissue IHC). HPA rates the tissue pattern Supported, with medium antibody–RNA consistency and external verification pending (HPA tissue IHC).

What am I looking at on my slide?
Granular cytoplasmic signal in kidney tubule cells, intestinal glandular cells or cerebellar Purkinje cells.This fits the reported compartment and high-staining cell types (HPA tissue IHC). Judge the pattern within each cell type; adjacent tissue components need not share its intensity. The mitochondrial assignment supports the interpretation, although chromogenic IHC alone does not prove organelle colocalisation (UniProt Q96EY7; HPA subcellular ICC-IF).
Predominantly nuclear staining or a crisp cell-surface outline, with little granular cytoplasmic signal.Treat this as a compartment mismatch requiring review, rather than established PTCD3 localisation (HPA tissue IHC; HPA subcellular ICC-IF; UniProt Q96EY7 topology). Check the control slide and staining distribution before attributing the signal to PTCD3 (general IHC practice).
Strong staining confined to adipocytes or soft-tissue fibroblasts while expected positive cells remain unstained.Those cell types were reported as not detected (HPA tissue IHC). Consider antibody cross-reactivity or endogenous chromogenic activity, then investigate with staining controls (general IHC practice). A negative HPA observation is a comparison point, not proof that every specimen of that cell type must be blank (HPA tissue IHC).
Uniform haze, extracellular colour or widespread staining that obscures cell boundaries.Diffuse signal is difficult to reconcile with the reported granular cytoplasmic pattern (HPA tissue IHC). Review blocking, washing and chromogen development, and compare a no-primary control (general IHC practice). Do not score haze as positive cellular PTCD3 staining.
No convincing signal in an expected positive cell population on the same run.First check that the chosen tissue actually contains the documented cell type: for example, kidney tubule cells or colonic glandular cells were High (HPA tissue IHC). Review antibody and detection controls and the documented IHC-P workflow (general IHC practice); absence of signal alone cannot establish biological absence.
💡Expected PTCD3 appearanceCall a section positive when the documented cell type shows convincing granular cytoplasmic staining, potentially strong in HPA High populations; isolated nuclear, membrane-outline or diffuse colour is suspect (HPA tissue IHC; UniProt Q96EY7 topology).
How each factor affects the staining
Cell type and tissue selectionHigh staining is reported in kidney tubules, intestinal glandular cells, esophageal squamous cells and Purkinje cells; adipocytes and soft-tissue fibroblasts were not detected (HPA tissue IHC). Compare like cell types when selecting controls.
Mitochondrial location and topologyPTCD3 belongs to the mitochondrial small ribosomal subunit and has no annotated transmembrane segment (UniProt Q96EY7). HPA describes granular cytoplasmic IHC and enhanced mitochondrial ICC-IF localisation; use those observations to assess compartment agreement (HPA tissue IHC; HPA subcellular ICC-IF).
Processing and isoformsUniProt records a 38–689 mature chain and two isoforms, without an annotated propeptide or transmembrane segment (UniProt Q96EY7). These annotations do not identify the antibody epitope or establish an isoform-specific IHC pattern; avoid inferring one.
Strength of tissue evidenceThe tissue IHC assessment is Supported, with medium consistency against RNA data and external verification pending (HPA tissue IHC). HPA reports low RNA tissue specificity, so one apparently weak or strong section should be interpreted alongside cell identity and controls (HPA tissue IHC).
IF/ICC: what localisation should appear?Mainly mitochondrial fluorescence is reported, with enhanced mitochondrial localisation in HPA ICC-IF images (HPA subcellular ICC-IF). This supports a compartment check; it does not supply an IF protocol or make IHC chromogen granules proof of mitochondrial colocalisation.
Why is my staining missing, weak or wrong?
SituationLikely causeNext action
A kidney section appears negative.The assessed area may lack interpretable tubule cells, or the staining run may have failed; tubule cells were High in the reference profile (HPA tissue IHC; general IHC practice).Find intact tubules, compare a known-positive control stained in the same run, and review the documented IHC-P workflow and detection controls (general IHC practice).
Heart muscle is weak despite UniProt describing abundant PTCD3 there.Protein abundance and visible IHC intensity are different readouts: HPA reports low staining in cardiomyocytes (UniProt Q96EY7 tissue specificity; HPA tissue IHC).Use a documented HPA High cell population as the stronger staining reference; record the cardiomyocyte result by cell type without assuming technical failure (HPA tissue IHC; general IHC practice).
Only nuclei or cell borders stain strongly.That pattern conflicts with granular cytoplasmic IHC and mitochondrial ICC-IF localisation (HPA tissue IHC; HPA subcellular ICC-IF).Compare the same-run positive and no-primary controls, then reassess staining localisation before calling it PTCD3 positive (general IHC practice).
Adipocytes or soft-tissue fibroblasts stain strongly.HPA recorded PTCD3 as not detected in those cell types; cross-reactivity or endogenous detection activity is possible (HPA tissue IHC; general IHC practice).Inspect a no-primary control for detection background and compare the suspect staining with a documented positive cell population (general IHC practice; HPA tissue IHC).
Granular signal is buried under diffuse colour.Excess background can prevent assessment of the reported granular cytoplasmic pattern (HPA tissue IHC; general IHC practice).Check no-primary and positive controls; review blocking, washes and chromogen development according to the validated IHC-P workflow (general IHC practice).
Two sections give different apparent positive rates.Scoring unlike cell populations can create disagreement: the HPA tissue profile includes High, Low and not-detected cell types (HPA tissue IHC).Score the same identified cell type in comparable areas, recording intensity and the fraction of cells with convincing granular cytoplasmic signal (HPA tissue IHC; general IHC practice).

Sample controls for PTCD3 IHC & IF

🧪Run colon first and assess its glandular cells for PTCD3 staining (HPA: High in colon glandular cells). Use adipose tissue adipocytes as the negative tissue (HPA: Not detected in adipocytes); on the colon slide, adjacent nonglandular cells should provide a background comparison, though their PTCD3 status is not established by the supplied HPA rows.
Positive control tissue: Appendix (Glandular cells, HPA High)
Negative control tissue: Adipose tissue (HPA Not detected)
ICC-IF cell lines (HPA subcellular resource): HPA ICC-IF images show PTCD3 in A-431, U-251MG, U2OS, with annotated localisation: Mitochondria (enhanced) (HPA subcellular).
Technical controls: Include a no-primary (secondary-only) control, a concentration-matched rabbit IgG isotype control, and PTCD3-knockout material as a biological negative (selected-SKU caption: rabbit primary; standard IHC practice). Quench endogenous peroxidase and check for luminal background in colon sections before interpreting DAB staining (selected-SKU caption: HRP/DAB detection; standard IHC practice).
⚠️Feasibility: No target-specific fixation window or fixation effect is reported, and the selected-SKU paraffin-section caption does not state the fixative (selected-SKU caption). The demonstrated IHC procedure uses heat retrieval in EDTA at pH 8.0, followed by 2 μg/ml primary antibody overnight at 4°C (selected-SKU caption). HPA shows mitochondrial ICC-IF localization in A-431, U-251MG and U2OS cells, but the supplied evidence does not establish that IF or frozen sections are easier than paraffin IHC (HPA: subcellular ICC-IF images; selected-SKU caption: paraffin section).

HPA tissue IHC evidence for PTCD3

Comprehensive Human Protein Atlas IHC scoring per tissue (reliability: Supported — Medium consistency between antibody staining and RNA expression data. Pending external verification.). Rows are taken directly from the HPA tissue chart — click any row's HPA link to view the source.

Positive expression · recommended positive controls

TissueCell typeLevelEvidenceSource
Appendix Glandular cells High Protein (IHC) HPA →
Cerebellum Purkinje cells High Protein (IHC) HPA →
Colon Glandular cells High Protein (IHC) HPA →
Duodenum Glandular cells High Protein (IHC) HPA →
Esophagus Squamous epithelial cells High Protein (IHC) HPA →

Undetected expression · recommended negative controls

TissueCell typeLevelEvidenceSource
Adipose tissue Adipocytes Not detected Protein (IHC) HPA →
Soft tissue Fibroblasts Not detected Protein (IHC) HPA →
Section 3

Advanced PTCD3 IHC Tips

Troubleshoot PTCD3 chromogenic IHC by checking retrieval, compartment, controls and scoring before interpreting staining intensity.

What retrieval should I try first when PTCD3 staining is weak?
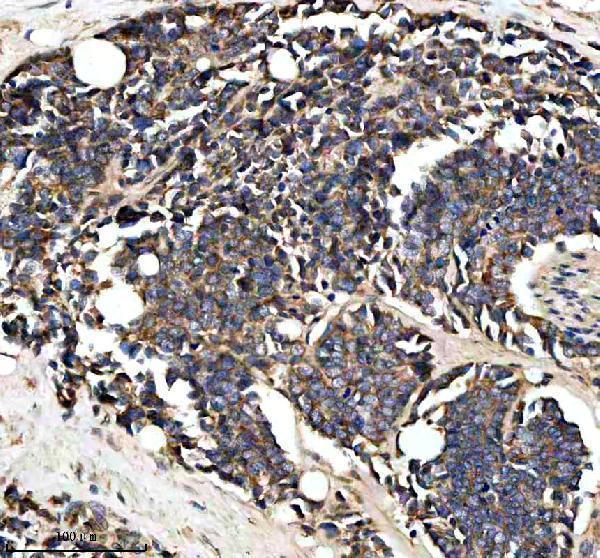
Start with heat-mediated antigen retrieval in EDTA at pH 8.0 (datasheet A10795-1). The catalog antibody detected PTCD3 in a paraffin-embedded human colon cancer section after this retrieval, followed by 2 μg/ml primary antibody overnight at 4°C (caption A10795-1). If staining remains weak, compare retrieval duration on adjacent sections while keeping antibody concentration and DAB development constant (standard IHC practice). Include a colon glandular-cell reference section, where staining is reported as high, to distinguish retrieval failure from a low-expression specimen (HPA: colon glandular cells High). Excessive heating can damage morphology and complicate granular cytoplasmic scoring (standard IHC practice).
How should I troubleshoot PTCD3 staining across differently fixed specimens?
The selected tissue caption identifies a paraffin-embedded section but does not state its fixative, so PTCD3-specific fixation sensitivity is unknown (caption A10795-1). Record each specimen’s fixative and fixation time, then compare similarly processed sections using the same EDTA pH 8.0 retrieval and 2 μg/ml primary concentration (datasheet A10795-1; standard IHC practice). Check whether morphology and a reference specimen remain interpretable before attributing weaker signal to PTCD3 abundance (standard IHC practice). If fixation varies between groups, analyse those groups separately or validate a common workflow on matched material first (standard IHC practice). Do not infer fixation tolerance from tissue expression patterns (HPA: tissue IHC profile).
Which staining pattern supports PTCD3 localisation in paraffin sections?
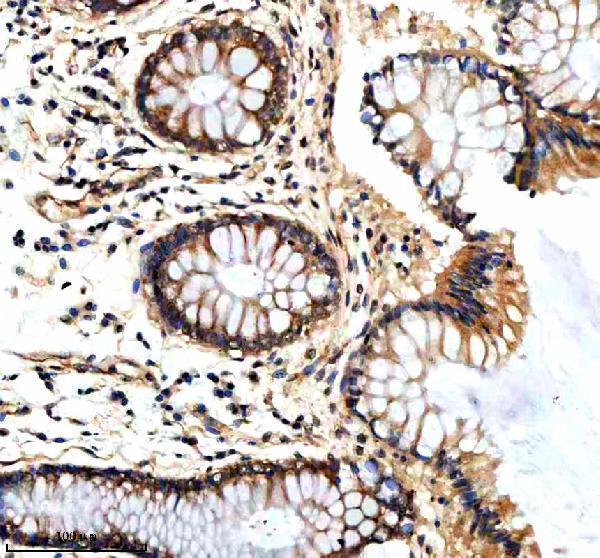
Expect granular cytoplasmic staining in tissue IHC, consistent with PTCD3’s mitochondrial localisation (HPA: general granular cytoplasmic expression; UniProt Q96EY7: mitochondrion). In colon, evaluate glandular cells as a useful reference population because HPA reports high staining there (HPA: colon glandular cells High). Compare granules with preserved cytoplasmic morphology and, where feasible, a mitochondrial marker on a serial section (standard IHC practice). Diffuse nuclear staining alone does not match the reported location and warrants a review of background, counterstain and antibody controls (HPA: mitochondrial location; standard IHC practice). Keep DAB development comparable across slides before judging subtle differences in granular intensity (standard IHC practice).
Could isoforms or epitope accessibility explain discordant PTCD3 staining?
PTCD3 has 2 reported isoforms, but the supplied caption does not identify the antibody epitope or establish recognition of both (UniProt Q96EY7: isoforms 1 and 2; caption A10795-1). Its annotated mature chain spans residues 38–689, and an N6-acetyllysine is reported at residue 126 (UniProt Q96EY7: processing; modified residues). Without an epitope map, do not assign weak staining to cleavage, acetylation or isoform exclusion (standard interpretation practice). Compare the antibody’s stated immunogen or epitope, if available, with isoform sequences before making that claim (standard validation practice). Meanwhile, hold retrieval at EDTA pH 8.0 and compare matched sections for technical variability (datasheet A10795-1; standard IHC practice).
How can IF help resolve an ambiguous PTCD3 IHC pattern?
Use IF as a complementary localisation check when granular DAB staining is difficult to assign to cells or compartments (standard microscopy practice). Multiplex PTCD3 with a marker for the expected cell type, such as a glandular epithelial marker in colon, and assess overlap with a mitochondrial marker (HPA: colon glandular cells High; HPA: mitochondria enhanced). Select spectrally separated fluorophores after checking tissue autofluorescence and single-label controls (standard IF practice). PTCD3 lacks an annotated transmembrane segment, but its antibody epitope’s membrane-facing side is unspecified; test permeabilisation sufficient to expose the epitope without disrupting mitochondrial morphology (UniProt Q96EY7: topology; standard IF practice). Compare IF findings with IHC on matched material, rather than treating fluorescence intensity as a DAB score (standard microscopy practice).
What controls distinguish PTCD3 signal from chromogenic background?
The selected caption used 10% goat serum blocking, an anti-rabbit peroxidase secondary and DAB detection (caption A10795-1). Add a no-primary control and check endogenous peroxidase blocking before attributing brown deposits to PTCD3 (standard IHC practice). Inspect folds, section edges, pigment and necrotic areas separately, because deposits there can mimic granular cytoplasmic signal (standard IHC practice). If diffuse staining persists, compare cleaner sections under the same EDTA pH 8.0 retrieval and shorten DAB development consistently across the batch (datasheet A10795-1; standard IHC practice). A credible tissue pattern should retain cellular boundaries and agree with the reported cytoplasmic distribution (HPA: general granular cytoplasmic expression).
How should I score heterogeneous PTCD3 staining in tissue sections? ⚠ ANSWER MARKED FOR VERIFICATION
Define the cell population and exclude folds, necrosis and poorly preserved regions before scoring (standard IHC practice). For glandular epithelium, record the percentage of positive cells and intensity categories, then calculate an H-score consistently across sections (standard IHC scoring practice). If analysing sparse positive cells, report positive-cell density per mm² alongside the area assessed (standard IHC scoring practice). Normalise comparisons to the same tissue compartment, viable cell count or sampled area, rather than whole-section DAB coverage (standard IHC practice). Use matched retrieval and development conditions; the documented starting conditions are EDTA pH 8.0 and 2 μg/ml primary antibody overnight at 4°C (datasheet A10795-1; caption A10795-1).
When is PTCD3 staining convincing rather than an artefact?
A convincing result shows granular cytoplasmic staining in intact cells, consistent with mitochondrial PTCD3 and the reported tissue pattern (UniProt Q96EY7: mitochondrion; HPA: general granular cytoplasmic expression). Colon glandular cells offer a reported high-staining comparison, whereas adipocytes are reported as not detected (HPA: colon glandular cells High; HPA: adipocytes Not detected). Treat isolated nuclear signal, edge staining and deposits in necrotic tissue cautiously, and review no-primary and endogenous-peroxidase controls (HPA: mitochondrial location; standard IHC practice). The HPA tissue-IHC reliability is Supported with medium staining-to-RNA consistency and pending external verification, so morphology alone does not establish antibody specificity (HPA: reliability description). Confirm disputed findings with an independent antibody or orthogonal assay where available (standard validation practice).
Boster reagents

Best PTCD3 / Small ribosomal subunit protein mS39 IHC Antibodies

A10795-1 has IHC images from paraffin sections of human colon cancer and colon, mouse brain, and rat brain (catalog IHC captions). No IF images are supplied (catalog IF image list).

Real IHC data IHC analysis of PTCD3 using anti-PTCD3 antibody (A10795-1). PTCD3 was detected in a paraffin-embedded section of human colon cancer tissue. Heat mediated antigen retrieval was performed in EDTA buffer (pH 8.0, epitope retrieval solution). The tissue section was blocked with 10% goat serum. The tissue section was then incubated with 2 μg/ml rabbit anti-PTCD3 Antibody (A10795-1) overnight at 4°C. Peroxidase Conjugated Goat Anti-rabbit IgG was used as secondary antibody and incubated for 30 minutes at 37°C. The tissue section was developed using HRP Conjugated Rabbit IgG Super Vision Assay Kit (Catalog # SV0002) with DAB as the chromogen.
Anti-PTCD3 Antibody ®
Cat # A10795-1

A10795-1 is listed for IHC in human, mouse, and rat samples (catalog applications and reactivity). Its IHC captions document paraffin sections of human colon cancer and colon, mouse brain, and rat brain (catalog IHC captions).

Which to pick: Choose A10795-1 for paraffin-section IHC: its captions show 2 μg/ml primary antibody after heat retrieval in EDTA, pH 8.0 (catalog IHC captions). The same SKU is listed as reactive with human, mouse, and rat, with an IHC dilution of 2–5 μg/ml (catalog reactivity and dilution). No IF/ICC validation or IF dilution is supplied, so there is no IF/ICC pick here (catalog applications and IF image list); the paraffin captions do not report the fixative (catalog IHC captions).

Each figure is that product's own IHC / IF validation image from its datasheet.