This website uses cookies to ensure you get the best experience on our website.


- Table of Contents
Plan chromogenic IHC-P for PTER using cytoplasmic staining in glandular and kidney tubular cells as a reference (HPA tissue IHC). The catalog antibody starts at 2.5 μg/mL and has IHC validation in mouse kidney (datasheet); validate staining in your chosen tissue because antibody–RNA concordance is low (HPA tissue IHC).

Expected localisation, validated protocols, controls and antibodies — the at-a-glance facts below, then the full design guide.
| Expected localisation | Cytoplasmic tissue staining (HPA tissue IHC) | |
| Staining pattern | Cytoplasmic staining in glandular and kidney tubular cells (HPA tissue IHC) | |
| Antigen retrieval | Citrate pH 6.0 HIER, 95–98 °C, 20 min (rule: cytoplasmic / membrane antigen) | |
| Positive control | Colon+4 more · see all | |
| Negative control | Adipose tissue+4 more · see all |
| Fixation | Keep fixation consistent across paraffin sections (standard IHC practice; not target-specific) | |
| Caveat | Low antibody–RNA concordance warrants validation (HPA tissue IHC) | |
| Regulation | Expression regulation is unreported (UniProt) | |
| Isoform / epitope | 2 isoforms; epitope coverage needs checking (UniProt) |
The catalog antibody’s IHC-P protocol is accompanied by one published PTER staining protocol for renal tissue (PMC4012828).
| Sample | Tissue sections; selected-image fixative not specified (standard IHC workflow) |
| Fixation | Image fixative and duration unreported (datasheet A08763); verify before use. |
| Sectioning | 4–5 µm sections on charged slides (standard) |
| Deparaffinisation | Xylene, graded ethanol series to water (standard) |
| Antigen retrieval | Heat-induced epitope retrieval in citrate buffer, pH 6.0, 20 min at 95–98 °C (standard rule: cytoplasmic / membrane antigen) |
| Peroxidase block | 3% H2O2, 10 min, room temperature (standard) |
| Blocking | 10% normal serum of the secondary host, 30 min, room temperature (standard) |
| Primary antibody | Rabbit anti-PTER, 2.5 μg/mL (datasheet A08763) |
| Primary incubation | Overnight at 4 °C (standard) |
| Detection | HRP-polymer secondary, DAB chromogen 5–10 min (standard) |
| Counterstain | Hematoxylin, blue, dehydrate and mount (standard) |
| Expected result | PTER-positive staining in glandular cells of colon (HPA tissue IHC: High). HPA tissue profile: Cytoplasmic expression in most tissues. No signal in the no-primary control. |
PTER is annotated as cytosolic, with no transmembrane segment (UniProt Q96BW5). In tissue IHC, expect cytoplasmic staining, especially in glandular cells and kidney tubule cells recorded as High (HPA: tissue IHC). Treat intensity as a guide: HPA rates its tissue IHC Approved but reports low consistency between staining and RNA expression, pending external verification (HPA: tissue IHC reliability).
| Clear cytoplasmic stain in colon glandular cells or kidney tubule cells. | This matches the recorded High staining in those cells (HPA: colon and kidney tissue IHC) and PTER's cytosolic annotation (UniProt Q96BW5). Compare the cells with surrounding structures and the counterstain before scoring; a brown deposit across the whole section is less informative than a cell-resolved pattern (general IHC practice). |
| Predominantly membranous or luminal staining, with little cytoplasmic signal. | That compartment is inconsistent with the reported tissue pattern (HPA: cytoplasmic expression in most tissues) and with the lack of a transmembrane segment (UniProt Q96BW5 topology). Consider an artefact and review the antibody controls and detection conditions before assigning it to PTER. Nuclear signal needs separate interpretation because ICC-IF reports it (HPA: subcellular). |
| Strong staining in adipocytes or skeletal myocytes. | Those cells are recorded as Not detected (HPA: adipose tissue and skeletal muscle IHC). Cross-reactivity or endogenous chromogenic activity is possible, especially if the deposit also appears in a no-primary control (general IHC practice). This discrepancy is a reason to check specificity, not proof that the biological sample lacks PTER. |
| Diffuse brown background obscures cell boundaries. | The distribution cannot be scored reliably as cytoplasmic PTER staining (general IHC practice; HPA: tissue IHC pattern). Check a no-primary section for detection-system background, then inspect blocking, washes and antibody dilution as general IHC variables. Do not use background intensity to rank tissues against HPA's cell-specific levels. |
| No stain in colon glandular cells or kidney tubule cells. | That differs from the recorded High staining (HPA: colon and kidney tissue IHC), but one blank section does not establish PTER absence. Check that the intended cells are present, then verify the catalog antibody's IHC-P procedure and detection controls (general IHC practice). HPA reports low staining-to-RNA consistency, so treat any single-tissue comparison cautiously (HPA: reliability). |
| Tissue and cell selection | Colon glandular cells and kidney tubule cells offer recorded High IHC examples; adipocytes and skeletal myocytes are recorded as Not detected (HPA: tissue IHC). Score the named cell population rather than assigning one result to every cell in a section (general IHC practice). |
| Strength of the reference pattern | HPA calls its tissue IHC Approved while noting low consistency with RNA and pending external verification (HPA: reliability). Its listed antibodies are IHC Approved, with no IHC Enhanced status supplied (HPA: antibody validation). Use the pattern as a comparator, not a definitive tissue-wide cutoff. |
| Compartment and molecular form | PTER is annotated as cytosolic, with no signal peptide or transmembrane segment; the annotated chain spans residues 1–349 (UniProt Q96BW5). Two isoforms are listed, but the supplied record does not map antibody epitopes to them (UniProt Q96BW5). These facts support a cytoplasmic expectation without predicting isoform-specific IHC staining. |
| IF/ICC Q: How should nuclear signal be read? | A: HPA reports an approved mainly nucleoplasmic ICC-IF location, with additional cytosol (HPA: subcellular), whereas UniProt annotates cytosol (UniProt Q96BW5). Record the assay and compartment when comparing images; ICC-IF nuclear staining alone does not establish the expected pattern in paraffin tissue IHC. |
| Situation | Likely cause | Next action |
|---|---|---|
| Positive-control tissue is blank. | The expected cells may be absent from the section, or the IHC workflow may have failed; High staining is reported for colon glandular and kidney tubule cells (HPA: tissue IHC). | Locate those cells on the counterstained section, verify the catalog antibody's IHC-P procedure, and check that the detection control developed (general IHC practice). |
| All tissue structures stain brown. | Diffuse deposit may reflect detection-system background rather than the cell-resolved cytoplasmic pattern (general IHC practice; HPA: tissue IHC pattern). | Review a no-primary section. If it also stains, check endogenous chromogenic activity and blocking; if it is clear, review antibody dilution and washes (general IHC practice). |
| Adipocytes or skeletal myocytes appear strongly positive. | This conflicts with their Not detected HPA entries; cross-reactivity or endogenous detection activity are possible explanations (HPA: adipose tissue and skeletal muscle IHC; general IHC practice). | Compare a no-primary section and a section containing a recorded High cell population before interpreting the unexpected stain as PTER (general IHC practice; HPA: tissue IHC). |
| Signal is confined to membranes or luminal material. | That distribution does not match HPA's mainly cytoplasmic tissue pattern or UniProt's cytosolic, nonmembrane annotation (HPA: tissue IHC; UniProt Q96BW5 topology). | Inspect cell outlines and counterstain, compare the no-primary control, and rescore only convincing intracellular signal (general IHC practice). |
| Nuclear staining appears in an IF/ICC image. | Nucleoplasm is HPA's approved main ICC-IF location, alongside cytosol; the tissue IHC summary is cytoplasmic (HPA: subcellular; HPA: tissue IHC). | Document the assay and compare each result with its own HPA reference. Do not transfer an ICC-IF compartment call directly to paraffin-section IHC. |
| The observed tissue ranking differs from HPA. | HPA reports low consistency between antibody staining and RNA expression, pending external verification (HPA: tissue IHC reliability). | Record cell type, compartment, intensity and controls for each section; repeat a discrepant IHC observation before treating the HPA ranking as a firm cutoff (general IHC practice; HPA: reliability). |


Comprehensive Human Protein Atlas IHC scoring per tissue (reliability: Approved — Low consistency between antibody staining and RNA expression data. Pending external verification.). Rows are taken directly from the HPA tissue chart — click any row's HPA link to view the source.
| Tissue | Cell type | Level | Evidence | Source |
|---|---|---|---|---|
| Colon | Glandular cells | High | Protein (IHC) | HPA → |
| Fallopian tube | Glandular cells | High | Protein (IHC) | HPA → |
| Gallbladder | Glandular cells | High | Protein (IHC) | HPA → |
| Kidney | Cells in tubules | High | Protein (IHC) | HPA → |
| Pancreas | Exocrine glandular cells | High | Protein (IHC) | HPA → |
| Tissue | Cell type | Level | Evidence | Source |
|---|---|---|---|---|
| Adipose tissue | Adipocytes | Not detected | Protein (IHC) | HPA → |
| Bone marrow | Hematopoietic cells | Not detected | Protein (IHC) | HPA → |
| Ovary | Ovarian stroma cells | Not detected | Protein (IHC) | HPA → |
| Skeletal muscle | Myocytes | Not detected | Protein (IHC) | HPA → |
| Smooth muscle | Smooth muscle cells | Not detected | Protein (IHC) | HPA → |
Troubleshoot PTER staining in paraffin sections by checking retrieval, controls, cellular distribution, and scoring before interpreting chromogenic signal.
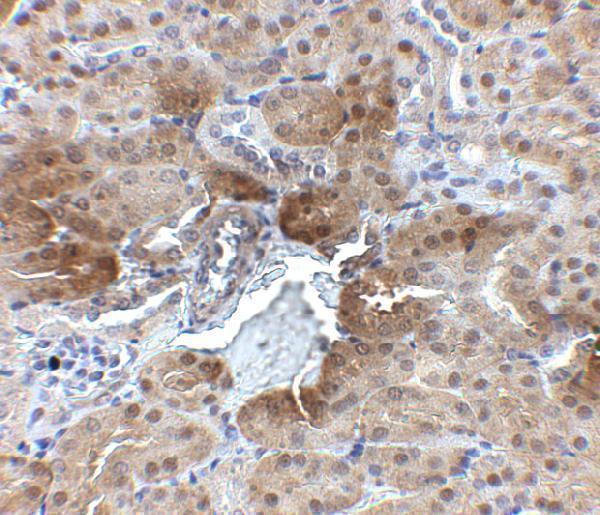
A08763 has real IHC data from mouse kidney tissue at 2.5 μg/mL (catalog image caption); human and rat reactivity is listed, but IHC validation is reported for mouse only (catalog datasheet).
A08763 will render with an IHC image of mouse kidney tissue stained at 2.5 μg/mL (catalog image caption). Its listed applications include IHC-P, and its listed reactivity covers human, mouse, and rat; the datasheet reports IHC validation in mouse samples (catalog applications; catalog reactivity; catalog datasheet).
Which to pick: Choose A08763 for paraffin-section tissue IHC (catalog application: IHC-P); its own image caption documents staining in mouse kidney tissue at 2.5 μg/mL, but does not report the fixative (catalog image caption). For IF/ICC, A08763 has no listed application or image data, so there is no validated IF/ICC choice in this catalog (catalog applications; catalog IF images). For cross-species work, A08763 lists human, mouse, and rat reactivity, while the reported IHC validation is limited to mouse samples; clonality is unreported (catalog reactivity; catalog datasheet; catalog clone field).