This website uses cookies to ensure you get the best experience on our website.


- Table of Contents
Plan RICTOR chromogenic IHC in paraffin sections using the reported cytoplasmic tissue pattern (HPA tissue IHC). This guide covers fixation, staining controls and interpretation of tissue differences.

Expected localisation, validated protocols, controls and antibodies — the at-a-glance facts below, then the full design guide.
| Expected localisation | Cytoplasmic staining in tissue sections (HPA tissue IHC) | |
| Staining pattern | Cytoplasmic in most tissues; high in some glandular cells (HPA tissue IHC) | |
| Antigen retrieval | EDTA pH 8.0 HIER, heat-mediated (datasheet A03195-1) | |
| Positive control | Adrenal gland+4 more · see all | |
| Negative control | Adipose tissue+4 more · see all |
| Fixation | Matched tissue-IHC evidence does not establish the fixation claim. Validate the specimen-specific method before use. (selected-SKU IHC image A03195-1) | |
| Caveat | Squamous cells stain high in esophagus but are undetected in oral mucosa (HPA tissue IHC) | |
| Regulation | GSK3/FBXW7 promotes RICTOR degradation (UniProt) | |
| Isoform / epitope | Three isoforms; check antibody epitope coverage (UniProt) |
The catalog antibody’s IHC-P protocol uses heat-mediated EDTA retrieval at pH 8.0 (datasheet). Three published RICTOR IHC protocols provide tissue-specific comparisons (PMC7912927; PMC11066283; PMC8442624).
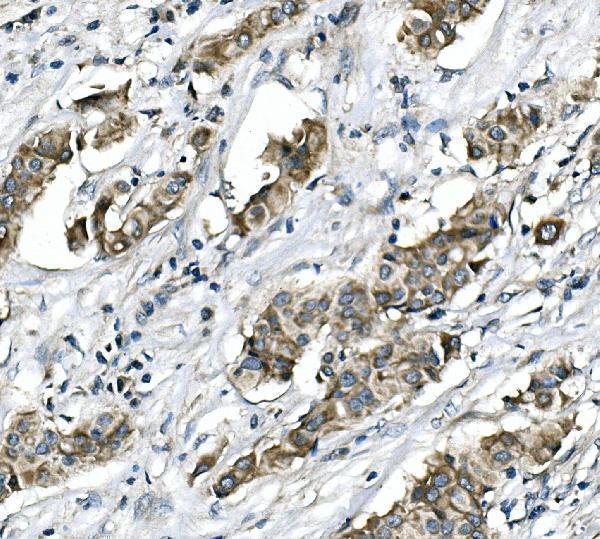
| Sample | Paraffin-embedded human mammary cancer tissue; fixative not specified (datasheet A03195-1) |
| Fixation | Image fixative and duration unreported (datasheet A03195-1); verify before use. |
| Sectioning | 4–5 µm sections on charged slides (standard) |
| Deparaffinisation | Xylene, graded ethanol series to water (standard) |
| Antigen retrieval | Heat retrieval: EDTA pH 8.0 (datasheet A03195-1); 20 min, 95–100 °C (standard) |
| Peroxidase block | 3% H2O2, 10 min, room temperature (standard) |
| Blocking | 10% goat serum (datasheet A03195-1) |
| Primary antibody | Rabbit anti-RICTOR, 0.5-1μg/ml (datasheet A03195-1) |
| Primary incubation | Overnight at 4 °C (datasheet A03195-1) |
| Detection | Streptavidin-biotin complex (SABC), DAB chromogen (datasheet A03195-1) |
| Counterstain | Hematoxylin, blue, dehydrate and mount (standard) |
| Expected result | RICTOR-positive staining in glandular cells of adrenal gland (HPA tissue IHC: High). HPA tissue profile: Ubiquitous cytoplasmic expression in most tissues. No signal in the no-primary control. |
RICTOR staining in paraffin sections should be predominantly cytoplasmic in many cell types (HPA tissue IHC: ubiquitous cytoplasmic expression). High signal is reported in hepatocytes, kidney tubule cells, cardiomyocytes and several glandular epithelia (HPA tissue IHC: High). RICTOR has no transmembrane segment, although mTORC2 associates with the cell, endoplasmic reticulum and lysosome membranes (UniProt Q6R327 topology and subcellular location). The tissue IHC profile is Approved, with medium staining–RNA consistency and external verification pending (HPA tissue IHC).
| Cytoplasmic signal is strong in hepatocytes or kidney tubule cells, with cell outlines and nuclei still readable. | This fits the reported compartment and two High cell populations (HPA tissue IHC: cytoplasmic profile; High in hepatocytes and kidney tubule cells). Membrane-associated mTORC2 does not require a sharp membrane rim in chromogenic sections (UniProt Q6R327 subcellular location; general IHC interpretation). Compare stained cells with nearby tissue architecture before scoring intensity. |
| The dominant signal is confined to nuclei, extracellular material or a continuous tissue-edge deposit. | Those patterns depart from the reported cytoplasmic tissue pattern (HPA tissue IHC). Check whether the signal follows tissue boundaries, damaged areas or counterstain rather than intact cells (general IHC practice). A discordant compartment is a reason to investigate an artefact; location alone cannot identify its cause. |
| Adipocytes, ovarian stromal cells or soft-tissue fibroblasts stain as strongly as the positive comparison cells. | These populations are listed as Not detected in the supplied tissue observations (HPA tissue IHC). Recheck cell identification and compare controls; cross-reactivity or endogenous detection activity is possible (general IHC practice). An unexpected positive is not conclusive by itself because HPA rates the tissue profile Approved with medium consistency and pending external verification (HPA tissue IHC). |
| Color is diffuse across cells, stroma and empty areas, obscuring boundaries. | A uniform haze cannot be scored as the reported cytoplasmic cell staining (HPA tissue IHC; general IHC interpretation). Inspect a no-primary control and the distribution of the precipitate (general IHC practice). Background that persists without primary antibody points toward the detection workflow rather than specific RICTOR binding (general IHC practice). |
| A hepatocyte or kidney tubule positive-control section has no detectable signal. | Both cell populations are reported High (HPA tissue IHC), so an absent result calls the run into question. Verify that the expected cells are present, then review retrieval, primary incubation and chromogenic detection using the validated IHC workflow (general IHC practice). A single negative section does not establish biological absence. |
| Tissue and cell selection | Use an HPA High cell population, such as hepatocytes or kidney tubule cells, as a positive comparison (HPA tissue IHC). Adipocytes and ovarian stromal cells are reported Not detected (HPA tissue IHC). These are observed patterns, not guaranteed outcomes for every section or antibody (HPA tissue IHC: Approved; medium consistency, pending external verification). |
| Compartment and topology | RICTOR has no annotated transmembrane segment, while mTORC2 is described at plasma, endoplasmic reticulum and lysosome membranes (UniProt Q6R327). Interpret the supplied tissue IHC reference as cytoplasmic staining (HPA tissue IHC); do not require a crisp plasma-membrane outline as the criterion for positivity. |
| Antibody validation and isoforms | HPA037802 and HPA037803 have Approved IHC status; the supplied record does not label either IHC result Enhanced (HPA antibodies). UniProt lists three RICTOR isoforms (UniProt Q6R327). The payload gives no epitope coverage for either antibody, so it cannot establish whether staining measures every isoform. |
| IF/ICC Q&A: should mitochondrial puncta appear in IHC? | HPA reports mitochondria as the approved main location in ICC-IF, while its tissue IHC summary reports ubiquitous cytoplasmic expression (HPA subcellular ICC-IF; HPA tissue IHC). Treat the ICC-IF observation as application-specific context, not a required chromogenic IHC pattern. This section supplies no IF/ICC protocol option. |
| Situation | Likely cause | Next action |
|---|---|---|
| Expected positive cells are blank while the section has intact morphology. | The run may have inadequate primary staining or detection; absence is difficult to interpret without a positive comparison (general IHC practice; HPA tissue IHC: High in hepatocytes and kidney tubule cells). | Run a reported High tissue alongside the sample, and check the IHC-validated antibody's documented retrieval, incubation and detection conditions (general IHC practice). Record the observed cell types before concluding that RICTOR is absent. |
| A no-primary control develops chromogen. | Primary-independent detection activity or background is possible (general IHC practice). The HPA tissue profile cannot identify that workflow cause (HPA tissue IHC). | Review the detection-system blocking and wash steps and repeat the no-primary control (general IHC practice). Score sample staining only after primary-independent color is controlled. |
| Staining is widespread but cell boundaries are hard to distinguish. | Diffuse background may obscure the cytoplasmic pattern reported for tissue sections (HPA tissue IHC; general IHC practice). | Compare with a no-primary section, review washing and primary-antibody concentration within the validated IHC workflow, and retain settings that preserve cellular detail (general IHC practice). Do not score haze as cell-specific staining. |
| Only nuclei or tissue edges show strong color. | This distribution conflicts with the reported cytoplasmic tissue pattern (HPA tissue IHC); localisation alone does not prove which artefact occurred. | Inspect tissue integrity and control sections, then repeat with the IHC-validated antibody under its documented conditions (general IHC practice). Require reproducible staining in identifiable cells before assigning a RICTOR pattern. |
| A reported Not detected cell population stains prominently. | Cell misidentification, cross-reactivity or endogenous detection activity are possibilities (general IHC practice; HPA tissue IHC: Not detected in adipocytes, ovarian stromal cells and soft-tissue fibroblasts). | Verify cell identity on the counterstained section and compare a no-primary control with a reported High population in the same run (general IHC practice; HPA tissue IHC). Treat a persistent difference from HPA as unresolved rather than automatically dismissing it. |
| Mitochondrial-looking puncta appear, but the chromogenic tissue pattern is unclear. | HPA assigns mitochondria as an approved ICC-IF location, whereas its tissue IHC summary describes cytoplasmic staining (HPA subcellular ICC-IF; HPA tissue IHC). The two observations do not establish a punctate IHC criterion. | Judge the IHC slide against identifiable cytoplasmic staining in reported positive cells and its controls (HPA tissue IHC; general IHC practice). Record puncta separately instead of treating them as proof of mitochondrial localisation in the paraffin section. |


Comprehensive Human Protein Atlas IHC scoring per tissue (reliability: Approved — Medium consistency between antibody staining and RNA expression data. Pending external verification.). Rows are taken directly from the HPA tissue chart — click any row's HPA link to view the source.
| Tissue | Cell type | Level | Evidence | Source |
|---|---|---|---|---|
| Adrenal gland | Glandular cells | High | Protein (IHC) | HPA → |
| Duodenum | Glandular cells | High | Protein (IHC) | HPA → |
| Epididymis | Glandular cells | High | Protein (IHC) | HPA → |
| Esophagus | Squamous epithelial cells | High | Protein (IHC) | HPA → |
| Gallbladder | Glandular cells | High | Protein (IHC) | HPA → |
| Tissue | Cell type | Level | Evidence | Source |
|---|---|---|---|---|
| Adipose tissue | Adipocytes | Not detected | Protein (IHC) | HPA → |
| Oral mucosa | Squamous epithelial cells | Not detected | Protein (IHC) | HPA → |
| Ovary | Ovarian stroma cells | Not detected | Protein (IHC) | HPA → |
| Soft tissue | Fibroblasts | Not detected | Protein (IHC) | HPA → |
| Vagina | Squamous epithelial cells | Not detected | Protein (IHC) | HPA → |
Troubleshoot RICTOR staining in paraffin sections by checking retrieval, compartment, cell identity and controls before comparing chromogenic signal across samples.
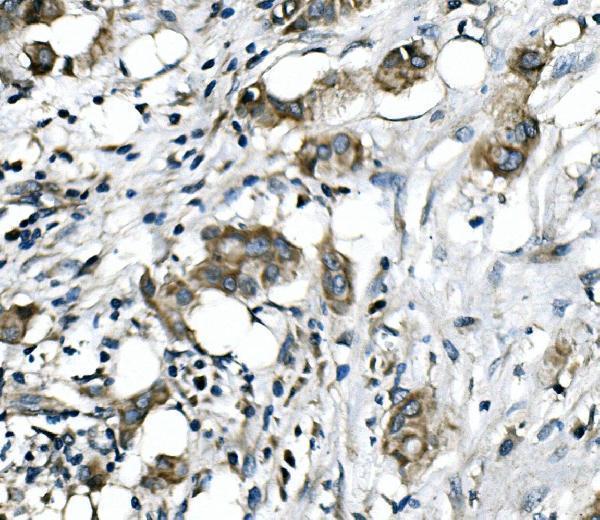
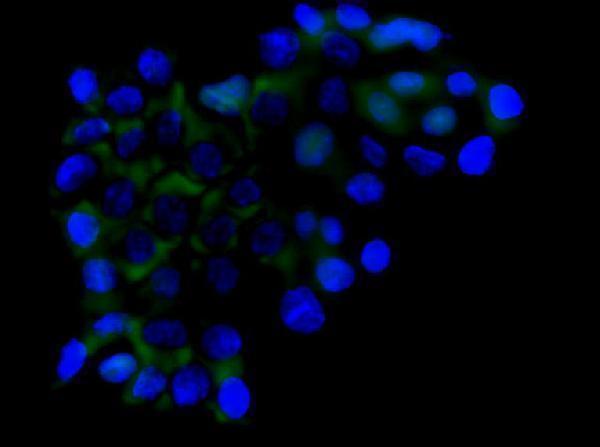
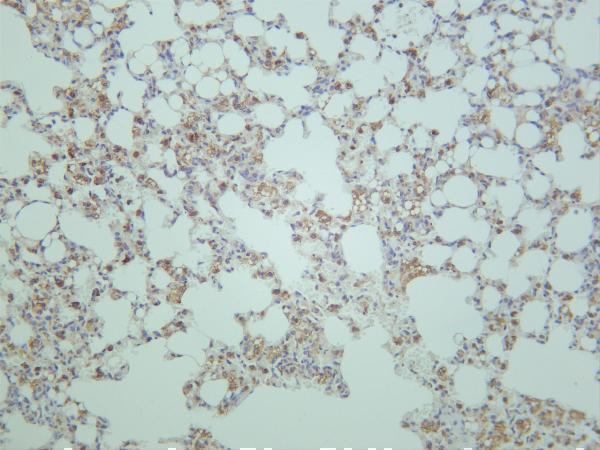
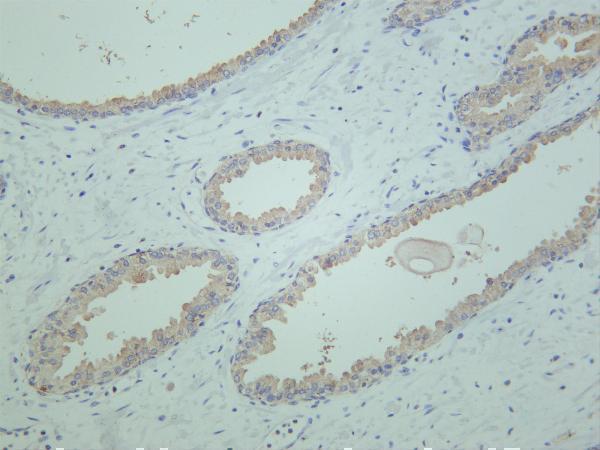
Two anti-RICTOR antibodies have tissue IHC images: human mammary cancer sections for A03195-1, and mouse lung and human prostate for M03195-1 (catalog IHC captions). A03195-1 also has A431 cell IF data (catalog IF caption).
A03195-1 will render with IHC staining of a paraffin-embedded human mammary cancer section; its separate IF image shows A431 cells (A03195-1 image captions). M03195-1 will render with mouse lung IHC staining; another catalog caption reports human prostate staining (M03195-1 IHC captions).
Which to pick: Choose A03195-1 for human paraffin-section IHC because its own image documents that preparation; the fixative is unreported (A03195-1 IHC caption). For IF/ICC, choose A03195-1 when working with human samples: IF and ICC are listed applications, and its IF image shows A431 cells (A03195-1 applications and IF caption). For human or mouse tissue IHC, consider M03195-1: it is monoclonal, lists both species as reactive, and has mouse lung and human prostate staining captions; their processing and fixatives are unreported (M03195-1 catalog description, reactivity and IHC captions).