This website uses cookies to ensure you get the best experience on our website.


- Table of Contents
Plan RRBP1 chromogenic IHC in paraffin sections using the cytoplasmic tissue pattern as a reference (HPA tissue IHC). Start with the IHC-validated antibody A07074-1 at 0.5–1 µg/mL (datasheet A07074-1), and compare samples prepared with consistent fixation.

Expected localisation, validated protocols, controls and antibodies — the at-a-glance facts below, then the full design guide.
| Expected localisation | Cytoplasmic tissue staining (HPA tissue IHC); ER membrane (UniProt) | |
| Staining pattern | Cytoplasmic across tissues; high in gut endocrine cells (HPA tissue IHC) | |
| Antigen retrieval | Citrate pH 6 HIER, heat-mediated (datasheet A07074-1) | |
| Positive control | Appendix+4 more · see all | |
| Negative control | None in HPA (detected in all 45 tissues); use no-primary + isotype controls |
| Fixation | Keep paraffin-section fixation consistent across samples. (standard IHC practice; not target-specific) | |
| Caveat | Staining intensity varies by cell type (HPA tissue IHC) | |
| Regulation | No expression regulator annotated (UniProt) | |
| Isoform / epitope | 2 isoforms; epitope differences unspecified (UniProt) |
The catalog antibody has a datasheet IHC-P protocol (datasheet: A07074-1). Three published RRBP1 IHC protocols provide tissue-specific examples (PMC6646231; PMC6347782; PMC3439379).
| Sample | Paraffin-embedded human intestinal cancer tissue; fixative not specified (datasheet A07074-1) |
| Fixation | Image fixative and duration unreported (datasheet A07074-1); verify before use. |
| Sectioning | 4–5 µm sections on charged slides (standard) |
| Deparaffinisation | Xylene, graded ethanol series to water (standard) |
| Antigen retrieval | Heat retrieval: Citrate pH 6, 20 min (datasheet A07074-1) |
| Peroxidase block | 3% H2O2, 10 min, room temperature (standard) |
| Blocking | 10% goat serum (datasheet A07074-1) |
| Primary antibody | Rabbit anti-RRBP1, 0.5-1μg/ml (datasheet A07074-1) |
| Primary incubation | Overnight at 4 °C (datasheet A07074-1) |
| Detection | Streptavidin-biotin complex (SABC), DAB chromogen (datasheet A07074-1) |
| Counterstain | Hematoxylin, blue, dehydrate and mount (standard) |
| Expected result | RRBP1-positive staining in endocrine cells of appendix (HPA tissue IHC: High). HPA tissue profile: Cytoplasmic expression in all tissues. No signal in the no-primary control. |
RRBP1 is an endoplasmic reticulum membrane protein with a short lumenal segment and a large cytoplasmic region (UniProt Q9P2E9 topology). Expect cytoplasmic staining across tissues, with high staining in selected cell populations such as bronchial respiratory epithelium and cerebellar Purkinje cells (HPA tissue IHC: Enhanced; high in those cells). HPA reports high consistency between antibody staining and RNA expression (HPA tissue IHC: reliability description).
| Cytoplasmic chromogen in bronchial respiratory epithelial cells or cerebellar Purkinje cells. | This fits the reported compartment and high staining in those cells (HPA tissue IHC: cytoplasmic expression; high in respiratory epithelial and Purkinje cells). Judge the labeled cells against nearby tissue structure, since the HPA profile describes expression across tissues rather than a single positive cell type (HPA tissue IHC: cytoplasmic expression in all tissues). |
| Predominantly nuclear staining, with little cytoplasmic signal. | Treat this as a compartment mismatch: UniProt places RRBP1 at the ER membrane, while HPA reports cytoplasmic tissue staining (UniProt Q9P2E9: subcellular location; HPA tissue IHC: cytoplasmic expression). Review the counterstain and detection controls before assigning the nuclear signal to RRBP1 (general IHC practice). |
| Strong color in an unexpected cell population, especially without the expected positive cells staining. | The distribution may reflect cross-reactivity or endogenous detection activity; appearance alone cannot distinguish them (general IHC practice). Compare cell identity with HPA's cell-specific observations and check appropriate detection controls (HPA tissue IHC: positive cell list; general IHC practice). |
| A diffuse wash of color obscures cell boundaries or extends through cell-free areas. | This is background rather than a convincing cellular result (general IHC practice). Check blocking, washes, chromogen development and detection controls; the HPA observation is cytoplasmic staining within cells (general IHC practice; HPA tissue IHC: cytoplasmic expression). |
| No detectable signal in a section containing a reported high-staining cell population. | First confirm that the relevant cells are present and the stain run worked (general IHC practice). Absence in, for example, bronchial respiratory epithelium conflicts with its reported high staining, but one failed section does not establish absent RRBP1 expression (HPA tissue IHC: high in bronchial respiratory epithelial cells). |
| Compartment and topology | RRBP1 has one transmembrane segment at residues 8–28 and a cytoplasmic region at 29–1410 (UniProt Q9P2E9 topology). This supports a cytoplasmic, ER-associated interpretation; it does not identify the epitope recognized by a particular antibody (UniProt Q9P2E9 topology). |
| Cell population and tissue | HPA reports high staining in several defined populations, but low staining in breast adipocytes, cardiomyocytes and skeletal myocytes (HPA tissue IHC: positive and low lists). Score the relevant cell type instead of treating every cell in a section as an equally strong control (general IHC practice). |
| Evidence behind the reference pattern | HPA rates the tissue IHC profile Enhanced and lists two antibodies with Enhanced IHC validation (HPA tissue IHC: reliability; HPA antibodies: HPA009026 and HPA011924). These observations support the reference pattern; they do not validate every catalog antibody or every staining run (HPA antibodies: validation status). |
| IF/ICC Q: Where should RRBP1 appear? | A: At the endoplasmic reticulum (HPA subcellular ICC-IF: enhanced ER location). This is a localisation cross-check for interpreting IHC; the ICC-IF record supplies no IHC protocol conditions (HPA subcellular ICC-IF: location and scope). |
| Situation | Likely cause | Next action |
|---|---|---|
| The reported high-staining cells are present, but the section is blank. | A staining-run failure is possible; a blank result alone cannot identify which step failed (general IHC practice). | Check a concurrently processed positive section, then review primary-antibody use, detection reagents and chromogen development (general IHC practice). Use an HPA-reported high-staining cell population as the biological reference (HPA tissue IHC: positive cell list). |
| Most apparent signal is nuclear. | The dominant compartment disagrees with ER membrane localisation and HPA's cytoplasmic tissue profile (UniProt Q9P2E9: location; HPA tissue IHC: profile). | Recheck nuclear counterstain versus chromogen, then compare with a detection control and a reported positive cell population before scoring the result (general IHC practice; HPA tissue IHC: positive cell list). |
| Unexpected cells stain as strongly as, or more strongly than, the reported positive cells. | Cross-reactivity or endogenous detection activity are possibilities; the slide pattern does not prove either cause (general IHC practice). | Verify cell identity and compare a suitable detection control. Interpret intensity by cell population using the reported high and low observations (general IHC practice; HPA tissue IHC: positive and low lists). |
| Color is diffuse or appears outside cells. | Nonspecific background or excess chromogen development can obscure cellular localisation (general IHC practice). | Inspect controls, blocking and wash steps, then assess development time in a repeat run (general IHC practice). Require a recognizable cytoplasmic cellular pattern for interpretation (HPA tissue IHC: cytoplasmic profile). |
| Cardiomyocytes, skeletal myocytes or breast adipocytes show faint staining. | Low staining is reported for these cell populations (HPA tissue IHC: low list). Faint signal alone does not show that the assay failed. | Compare them with an HPA-reported high-staining population in a suitably processed section; record intensity for each identified cell type (HPA tissue IHC: positive and low lists; general IHC practice). |
| IHC looks broadly cytoplasmic, while an IF/ICC image shows a clearer ER pattern. | HPA reports cytoplasmic tissue IHC and enhanced ER localisation by ICC-IF (HPA tissue IHC: profile; HPA subcellular ICC-IF: main location). The assays show localisation at different visual resolution (general IHC/IF practice). | Score IHC by its cellular cytoplasmic pattern and tissue context; use the ER-localised IF/ICC observation as a compartment check (HPA tissue IHC: profile; HPA subcellular ICC-IF: main location). |



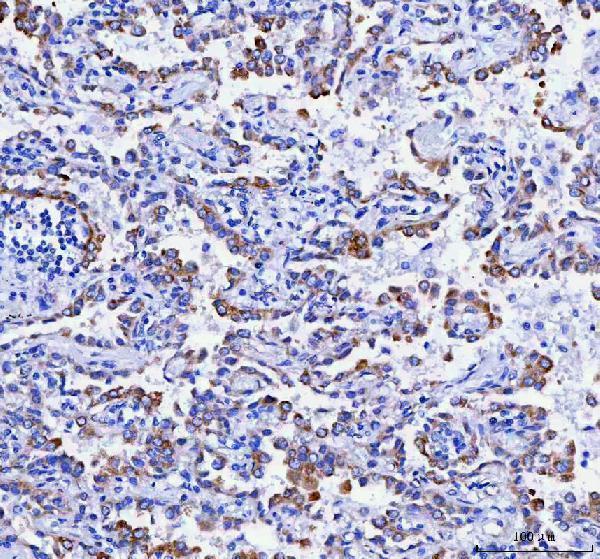
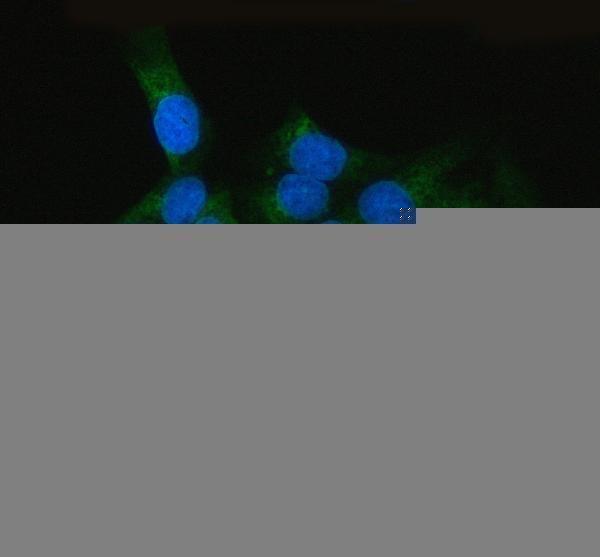
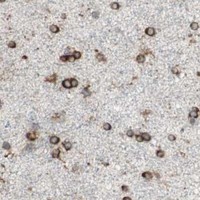


Comprehensive Human Protein Atlas IHC scoring per tissue (reliability: Enhanced — High consistency between antibody staining and RNA expression data.). Rows are taken directly from the HPA tissue chart — click any row's HPA link to view the source.
| Tissue | Cell type | Level | Evidence | Source |
|---|---|---|---|---|
| Appendix | Endocrine cells | High | Protein (IHC) | HPA → |
| Bone marrow | Hematopoietic cells | High | Protein (IHC) | HPA → |
| Bronchus | Respiratory epithelial cells | High | Protein (IHC) | HPA → |
| Cerebellum | Purkinje cells | High | Protein (IHC) | HPA → |
| Cerebral cortex | Glial cells | High | Protein (IHC) | HPA → |
| Tissue | Cell type | Level | Evidence | Source |
|---|---|---|---|---|
| None in HPA: RRBP1 is detected in all 45 scored tissues. Use a no-primary (secondary-only) and an isotype control instead. | ||||
Troubleshoot RRBP1 staining in paraffin sections by checking retrieval, cytoplasmic localisation, detection controls and cell type before comparing signal intensity.
The catalog lists two anti-RRBP1 antibodies with IHC images from human paraffin sections and IF images from cultured cells; one lists human, mouse and rat reactivity, and the other human only (catalog images and reactivity).
A07074-1 has IHC images from human intestinal and lung cancer paraffin sections, plus an IF/ICC cell image (A07074-1 image captions). A07074-2 has IHC images from human liver and lung cancer paraffin sections, plus an IF/ICC image of U2OS cells (A07074-2 image captions).
Which to pick: For paraffin-section IHC, choose A07074-1 if its citrate pH 6 retrieval example fits your workflow, or A07074-2 for its EDTA pH 8.0 example; neither caption reports the fixative (A07074-1 and A07074-2 IHC image captions). For human IF/ICC, both list those applications and show cell images; A07074-2 specifically shows U2OS cells (catalog applications; A07074-1 and A07074-2 IF image captions). For mouse or rat samples, choose A07074-1 because it lists those species, while A07074-2 lists human only; clonality is unreported for both (catalog reactivity and clone fields).