SATB1 / DNA-binding protein SATB1 · IHC design guide

Design Immunohistochemistry for SATB1

Plan chromogenic SATB1 IHC around nuclear staining in CNS and immune-system cells (HPA tissue IHC). Use thymic cortical cells as a high-staining reference and score nuclei by cell type (HPA tissue IHC).

Evidence assembled Oct 2026 · For research use; verify linked source records and product datasheet before use
Immunohistochemistry protocol sheet for SATB1 (IHC for SATB1): expected localisation Nuclear staining in CNS and immune-system cells (HPA tissue IHC), antibody M01312, validated IHC image, and IHC protocol steps
Printable SATB1 IHC protocol sheet — expected localisation Nuclear staining in CNS and immune-system cells (HPA tissue IHC), antibody M01312, controls and protocol steps. Open the full SATB1 IHC guide →

SATB1 Immunohistochemistry Experimental Design Guide

Expected localisation, validated protocols, controls and antibodies — the at-a-glance facts below, then the full design guide.

Must know before staining
Expected localisation Nuclear staining in CNS and immune-system cells (HPA tissue IHC)
Staining pattern Strong nuclear staining in thymic cortical and cerebral cortical neuronal cells (HPA tissue IHC)
Antigen retrieval EDTA pH 8.0 HIER, heat-mediated (datasheet M01312)
Positive control ⓘ Cerebral cortex+4 more · see all
Negative control ⓘ Adipose tissue+4 more · see all
Important caveats
Reasons your staining may differ from the expected pattern.
Fixation Keep fixation consistent across sections (standard IHC practice; not target-specific). Selected-image fixative and duration unreported (datasheet M01312); verify before use.
Caveat Cell-type composition can change the apparent tissue signal (HPA tissue IHC)
Regulation Thymus-predominant expression (UniProt)
Isoform / epitope 2 isoforms; epitope coverage is unspecified (UniProt)
Section 1

Recommended SATB1 IHC & IF Protocols

The catalog antibody protocol is followed by 4 published SATB1 IHC protocols for ovarian, renal, liver and colorectal cancer tissue (PMC3472180; PMC4023980; PMC5228311; PMC3523011).

Recommended immunohistochemistry (IHC-P) protocol parameters
SampleParaffin-embedded human spleen tissue; fixative not specified (datasheet M01312)
FixationImage fixative and duration unreported (datasheet M01312); verify before use.
Sectioning4–5 µm sections on charged slides (standard)
DeparaffinisationXylene, graded ethanol series to water (standard)
Antigen retrievalHeat retrieval: EDTA pH 8.0 (datasheet M01312); 20 min, 95–100 °C (standard)
Peroxidase block3% H2O2, 10 min, room temperature (standard)
Blocking10% goat serum (datasheet M01312)
Primary antibodyRabbit monoclonal (clone ACO-19) anti-SATB1, 1:50 (datasheet M01312)
Primary incubationOvernight at 4 °C (datasheet M01312)
DetectionHRP-conjugated secondary, DAB chromogen (datasheet M01312)
CounterstainHematoxylin, blue, dehydrate and mount (standard)
Expected resultSATB1-positive staining in neuronal cells of cerebral cortex (HPA tissue IHC: High). HPA tissue profile: Nuclear expression in several tissues, mainly in cells of the CNS and immune system. No signal in the no-primary control.
💡Decision noteStart with EDTA pH 8.0 heat retrieval for the catalog antibody (datasheet M01312); the published excerpts do not specify a retrieval buffer (PMC3472180; PMC4023980; PMC5228311; PMC3523011).
Section 2

What Is the Expected SATB1 Staining Pattern?

SATB1 should stain nuclei in selected neuronal and immune cells, including cerebral cortex neurons and thymic cortical cells (HPA tissue IHC: High). Its reported locations are the nuclear matrix and PML bodies (UniProt Q01826); HPA describes nuclear expression across several tissues (HPA tissue IHC). HPA rates the tissue profile Enhanced, while reporting medium consistency between staining and RNA data (HPA tissue IHC). SATB1 has no transmembrane segment (UniProt Q01826 topology).

What am I looking at on my slide?
Strong nuclear staining in thymic cortical cells or cerebral cortex neurons, with cell boundaries discernible.This matches the reported High staining in those cell types (HPA tissue IHC). Score the positive nuclei and cell type together; staining elsewhere in the section does not establish that the same pattern is expected there (general IHC interpretation).
Predominantly cytoplasmic or membrane staining, with little nuclear signal.This conflicts with nuclear matrix and PML body localization (UniProt Q01826) and HPA's nuclear tissue profile (HPA tissue IHC). Check the counterstain and staining controls before interpreting the colored deposit as SATB1 (general IHC practice).
Strong staining in adipocytes or appendix glandular cells.Those cells were reported as Not detected (HPA tissue IHC). Consider cross-reactivity or endogenous detection activity, and inspect whether the signal is nuclear. An HPA reference pattern is a comparison point, not proof that every specimen must match (general IHC interpretation).
Diffuse color covers nuclei and surrounding tissue without clear cell-specific staining.The distribution is hard to reconcile with HPA's cell-selective nuclear profile (HPA tissue IHC). Background from the detection system or insufficient blocking can obscure a true signal; assess a no-primary control alongside the section (general IHC practice).
No nuclear signal in a well-preserved thymus control.Thymic cortical cells are a High reference population (HPA tissue IHC), and UniProt reports predominant thymic expression (UniProt Q01826). A blank control warrants a check of retrieval, antibody use, detection and section quality before calling the study samples negative (general IHC practice).
💡Expected SATB1 appearanceCall a result positive when the expected cells show clear nuclear staining, potentially strong in thymic cortical cells or cerebral cortex neurons (HPA tissue IHC: High); diffuse cytoplasmic color or signal in HPA Not detected cell types is suspect (HPA tissue IHC; general IHC interpretation).
How each factor affects the staining
Cell type and tissue choiceHigh reference populations include lymph node and tonsil non-germinal center cells, placental decidual cells, thymic cortical cells and cerebral cortex neurons (HPA tissue IHC). Match the scored cell population to the reference, rather than treating an entire tissue as uniformly positive (general IHC interpretation).
Nuclear distributionSATB1 associates with the nuclear matrix and can localize to PML bodies when sumoylated (UniProt Q01826). HPA reports nuclear tissue staining (HPA tissue IHC). Nuclear variation may be plausible; a predominantly extranuclear pattern still needs investigation.
IHC evidence strengthThe HPA tissue profile is Enhanced, with medium staining-to-RNA consistency (HPA tissue IHC). Three listed antibodies have Enhanced IHC ratings: HPA051769, HPA070534 and CAB056144 (HPA antibodies). These ratings support the reference pattern without validating every antibody or specimen.
Isoforms and antibody recognitionUniProt lists 2 SATB1 isoforms (UniProt Q01826). The supplied evidence does not map an IHC antibody epitope to either isoform; do not infer isoform-specific staining or explain an absent signal by isoform choice alone.
Topology and processingThe reported SATB1 chain spans residues 1–763, with no signal peptide, propeptide or transmembrane segment (UniProt Q01826). These features fit an intracellular nuclear target; the supplied evidence does not establish a shedding-based staining pattern.
Does IF/ICC show the same compartment?HPA reports supported nucleoplasmic localization with additional nuclear bodies in ICC-IF images from HEK293, RT-4 and U2OS cells (HPA subcellular). This is a localization comparison for this IHC guide, not an IF protocol or an IHC staining-intensity reference.
Why is my staining missing, weak or wrong?
SituationLikely causeNext action
Thymus control is blank.A technical failure is possible because thymic cortical cells are High in the reference profile (HPA tissue IHC); the result alone does not identify which step failed.Review section quality, retrieval, antibody dilution and detection with the run controls before interpreting study negatives (general IHC practice). No SATB1-specific retrieval condition or fixation sensitivity is supplied.
Signal is mainly cytoplasmic.That compartment conflicts with SATB1's reported nuclear localization (UniProt Q01826; HPA tissue IHC). Nonspecific binding or misplaced chromogen is possible (general IHC interpretation).Confirm nuclear position against the counterstain, review a no-primary control and compare an expected-positive section (general IHC practice).
Brown color is widespread and diffuse.Endogenous peroxidase activity or nonspecific detection background can produce chromogenic signal independent of the primary antibody (general IHC practice).Compare the no-primary control; review peroxidase quenching, blocking and detection development for the run (general IHC practice). Judge SATB1 only where cell-specific nuclear staining remains.
Unexpected cells show strong nuclei.Cross-reactivity is possible if the cells differ from HPA's cell-specific reference pattern (HPA tissue IHC; general IHC interpretation). Sample biology may also differ from the reference.Record the exact cell type and compartment, compare HPA's corresponding cell-level entry, and seek corroboration with an independently validated antibody if the finding matters (general IHC practice).
An expected-negative area appears positive.HPA reports adipocytes and appendix glandular cells as Not detected (HPA tissue IHC); background or cell identification error may account for an apparent discrepancy (general IHC interpretation).Check the counterstain and no-primary control, then score the named cell population rather than adjacent cells (general IHC practice).
Nuclear staining is too dense to score.Excess chromogen development or overly concentrated antibody can obscure nuclear detail (general IHC practice); this appearance does not establish unusually high SATB1 expression.Review development time and dilution within the validated IHC workflow, and compare the positive control before assigning intensity (general IHC practice).

Sample controls for SATB1 IHC & IF

🧪Run thymus first and expect nuclear staining in cortical cells (HPA: High in thymus cortical cells; UniProt Q01826: nuclear localization). Use adipose tissue as the negative tissue and assess adipocytes, where SATB1 is not detected (HPA: Not detected in adipocytes); on the thymus slide, nuclei outside the stained cortical-cell population provide an internal comparison, but confirm their identity before treating them as negative.
Positive control tissue: Cerebral cortex (Neuronal cells, HPA High)
Negative control tissue: Adipose tissue (HPA Not detected)
ICC-IF cell lines (HPA subcellular resource): HPA ICC-IF images show SATB1 in HEK293, RT-4, U2OS, with annotated localisation: Nucleoplasm (supported) (HPA subcellular).
Technical controls: Include a no-primary, secondary-only control and a host- and isotype-matched control antibody; confirm specificity with SATB1 knockout material or peptide competition if the immunizing peptide is available (standard IHC practice). For chromogenic staining, quench endogenous peroxidase and inspect the no-primary thymus section for residual background (standard IHC practice).
⚠️Feasibility: A target-specific fixation window and retrieval dependency are unreported in the supplied SATB1 evidence; HPA staining does not establish how its specimens were processed (HPA: thymus cortical cells High). The selected M01312 caption describes STAB1 in spleen, not SATB1, and its fixative is unreported (selected-SKU caption). The evidence does not establish that frozen sections or IF are easier; ICC-IF does support nucleoplasmic and nuclear-body localization, while densely packed thymic nuclei require careful scoring (HPA: subcellular localization; standard IHC practice).

HPA tissue IHC evidence for SATB1

Comprehensive Human Protein Atlas IHC scoring per tissue (reliability: Enhanced — Medium consistency between antibody staining and RNA expression data. External characterization data supports antibody staining.). Rows are taken directly from the HPA tissue chart — click any row's HPA link to view the source.

Positive expression · recommended positive controls

TissueCell typeLevelEvidenceSource
Cerebral cortex Neuronal cells High Protein (IHC) HPA →
Lymph node Non-germinal center cells High Protein (IHC) HPA →
Placenta Decidual cells High Protein (IHC) HPA →
Thymus Cortical cells High Protein (IHC) HPA →
Tonsil Non-germinal center cells High Protein (IHC) HPA →

Undetected expression · recommended negative controls

TissueCell typeLevelEvidenceSource
Adipose tissue Adipocytes Not detected Protein (IHC) HPA →
Appendix Glandular cells Not detected Protein (IHC) HPA →
Breast Adipocytes Not detected Protein (IHC) HPA →
Cerebellum Cells in granular layer Not detected Protein (IHC) HPA →
Cervix Glandular cells Not detected Protein (IHC) HPA →
Section 3

Advanced SATB1 IHC Tips

Troubleshoot SATB1 staining in paraffin sections by checking nuclear localisation, cell identity and controls before interpreting chromogenic signal.

How should I optimize retrieval when SATB1 nuclear staining is weak?
Begin with heat-mediated retrieval in EDTA at pH 8.0 for paraffin sections (datasheet M01312). Test 10 and 20 minutes of heating on matched sections, then hold cooling and staining conditions constant to compare nuclear signal with tissue damage (standard IHC practice). SATB1 associates with nuclear scaffold regions and chromatin, so assess staining specifically within intact nuclei rather than judging total brown signal (UniProt Q01826 localisation and function). If staining remains weak, vary retrieval time before testing another buffer, and include a positive control containing the expected cell population (standard IHC practice; HPA: high in thymic cortical cells).
Could fixation explain weak or uneven SATB1 staining?
Target-specific fixation sensitivity has not been established by the supplied evidence; record fixative, duration and tissue handling for every paraffin section (supplied SATB1 evidence; standard IHC practice). For a controlled comparison, process matched material using documented 10% neutral buffered formalin and compare shorter and longer fixation intervals under the same retrieval and detection conditions (standard IHC practice). Evaluate nuclear preservation alongside staining, because damaged or poorly processed nuclei can make a nuclear marker difficult to score (UniProt Q01826 localisation; standard IHC practice). Neither HPA tissue patterns nor SATB1 modifications demonstrate that a particular fixation duration preserves this epitope (HPA tissue IHC; UniProt Q01826 modified residues).
What staining pattern should count as convincing SATB1 localisation?
Score signal within nuclei: SATB1 is associated with the nuclear matrix, while HPA reports supported nucleoplasmic staining and additional nuclear-body localisation (UniProt Q01826 localisation; HPA subcellular). Sumoylated SATB1 can localise to PML nuclear bodies, but puncta in a DAB section alone cannot establish sumoylation or PML identity (UniProt Q01826 localisation; standard IHC interpretation). Use a nuclear counterstain to decide whether chromogen overlaps intact nuclei and whether positive cells match tissue architecture (standard IHC practice). Diffuse cytoplasmic or extracellular DAB without nuclear enrichment warrants checking controls, retrieval damage and detection background before assigning it to SATB1 (UniProt Q01826 localisation; standard IHC practice).
Can this stain distinguish SATB1 isoforms or modification states?
SATB1 has 2 listed isoforms, but the supplied material does not map the catalog antibody’s epitope or establish isoform selectivity (UniProt Q01826 isoforms; supplied antibody evidence). Acetylation at residue 136 and phosphorylation at residues 185 and 637 are recorded modifications; ordinary DAB intensity does not identify any one of them (UniProt Q01826 modified residues; standard IHC interpretation). Confirm the antibody’s stated antigen and epitope before drawing isoform-specific conclusions, then use an independently validated reagent if that distinction matters (standard IHC practice). The supplied M01312 tissue caption names STAB1, so that image cannot establish SATB1 specificity or an SATB1 epitope (caption M01312).
How can IF help check a questionable chromogenic SATB1 pattern?
Use IF on a separately validated preparation to check nuclear localisation and multiplex with a marker for the expected cell population, such as a T-cell marker in thymus (HPA: high in thymic cortical cells; standard IF practice). Choose a far-red fluorophore and include an unstained section to assess tissue autofluorescence before judging weak signal (standard IF practice). SATB1 has no transmembrane segment and is nuclear, so trial mild permeabilisation, such as 0.1% detergent for 5 minutes, when nuclear access is needed (UniProt Q01826 topology and localisation; standard IF practice). The supplied evidence establishes no SATB1-specific IF fixation condition, and IF agreement would complement rather than replace IHC specificity controls (supplied IF evidence; standard IHC/IF practice).
What should I check when DAB obscures SATB1-positive nuclei?
Run a no-primary control through the complete chromogenic workflow to locate signal from the detection system (standard IHC practice). Block endogenous peroxidase, for example with 3% hydrogen peroxide for 10 minutes, and compare DAB development times on matched sections; these are general IHC steps, not SATB1-specific conditions (standard IHC practice). Check whether excess chromogen follows damaged edges, folds or blood-rich regions rather than intact nuclei (standard IHC practice; UniProt Q01826 localisation). If background persists, optimize antibody concentration and blocking with the same positive control and counterstain, while retaining a no-primary section in each run (standard IHC practice).
How should I score SATB1 staining across tissue sections? ⚠ ANSWER MARKED FOR VERIFICATION
Define eligible cell populations and count only intact nuclei within a prespecified viable tissue area (UniProt Q01826 localisation; standard IHC practice). Report the percentage of positive nuclei and, when intensity is reproducible, an H-score using intensity grades 0–3 multiplied by their respective percentages, yielding 0–300 (standard IHC scoring practice). For spatial comparisons, report positive nuclei per mm² alongside total eligible nuclei per mm², so changes in cellularity are visible (standard IHC practice). Normalize each comparison to the same cell type, viable area, staining run and threshold; avoid treating bulk DAB density as a direct measure of SATB1 abundance (standard IHC practice).
How can I distinguish true SATB1 signal from artefact?
Favor reproducible nuclear staining in appropriate cells: HPA reports high signal in thymic cortical cells, lymph-node non-germinal center cells and cerebral-cortex neurons (HPA tissue IHC). Scrutinize signal restricted to section edges, necrotic areas or the wrong compartment, and use no-primary controls to assess endogenous enzyme or detection artefacts (UniProt Q01826 localisation; standard IHC practice). Compare positive and expected low-signal cell populations within the same run, while recognizing that HPA calls its tissue evidence Enhanced with medium staining–RNA consistency (HPA tissue IHC). The supplied M01312 caption identifies STAB1, so its paraffin image cannot validate a SATB1-positive result; verify antibody identity and SATB1 specificity independently (caption M01312; standard IHC practice).
Boster reagents

Best SATB1 / DNA-binding protein SATB1 IHC Antibodies

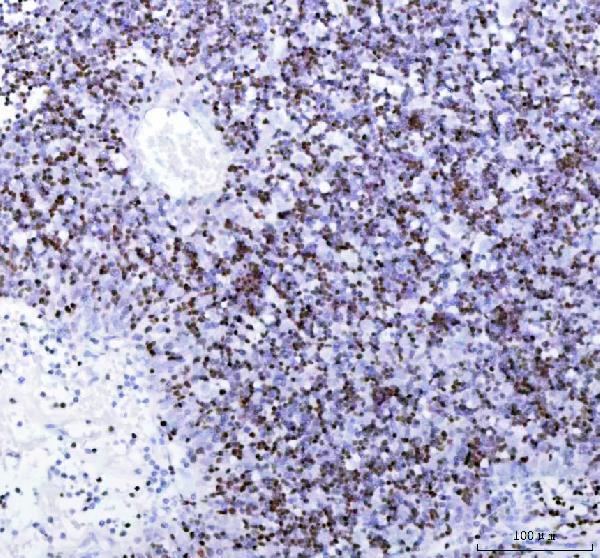
The catalog lists two anti-SATB1 antibodies for human, mouse and rat samples (catalog: A01312-1, M01312). Its sole IHC figure identifies STAB1, so it does not establish SATB1 staining (M01312 image caption).

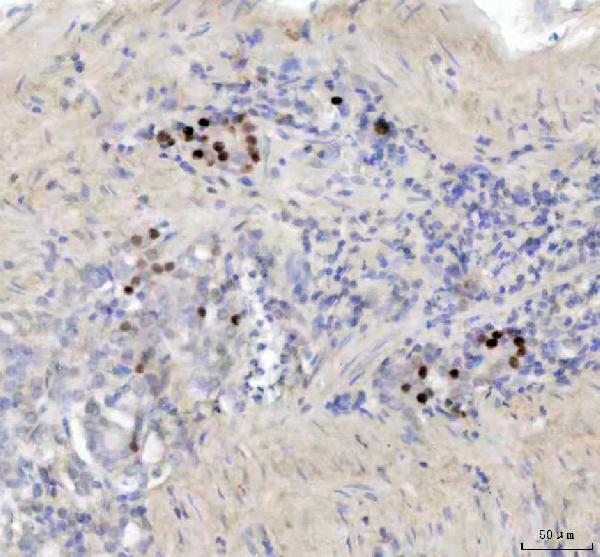
Real IHC data IHC analysis of STAB1 using anti-STAB1 antibody (M01312). STAB1 was detected in a paraffin-embedded section of human spleen tissue. Heat mediated antigen retrieval was performed in EDTA buffer (pH 8.0, epitope retrieval solution). The tissue section was blocked with 10% goat serum. The tissue section was then incubated with 1:50 rabbit anti-STAB1 Antibody (M01312) overnight at 4°C. Peroxidase Conjugated Goat Anti-rabbit IgG was used as secondary antibody and incubated for 30 minutes at 37°C. The tissue section was developed using HRP Conjugated Rabbit IgG Super Vision Assay Kit (Catalog # SV0002) with DAB as the chromogen.
Anti-SATB1 Rabbit Monoclonal Antibody
Cat # M01312

A01312-1 lists IHC and ICC applications for human, mouse and rat, with no IHC or IF image supplied (catalog: A01312-1). M01312 lists IHC, ICC and IF for those species, but its paraffin-section IHC captions identify STAB1 rather than SATB1 (catalog: M01312; M01312 image captions).

Which to pick: For tissue IHC, M01312 has the only supplied paraffin-section figure, but its STAB1 caption cannot validate SATB1; the fixative is unreported (M01312 image caption). For IF/ICC, M01312 explicitly lists both applications and is monoclonal, while A01312-1 lists ICC; neither has a supplied IF image (catalog: M01312, A01312-1). Both list human, mouse and rat reactivity, with no species-specific SATB1 staining shown here (catalog: A01312-1, M01312; supplied image captions).

Each figure is that product's own IHC / IF validation image from its datasheet.

References

  1. UniProt Consortium. UniProt entry Q01826 (SATB1_HUMAN, DNA-binding protein SATB1).
  2. Human Protein Atlas. SATB1 tissue IHC expression (reliability: Enhanced).
  3. Human Protein Atlas. SATB1 subcellular location (ICC-IF): Mainly localized to the nucleoplasm. In addition localized to the nuclear bodies..
  4. Human Protein Atlas. SATB1 antibody validation summary (3 antibodies).
  5. Expression of the global regulator SATB1 is an independent factor of poor prognosis in high grade epithelial ovarian cancer. Journal of ovarian research 2012 — PMC3472180.
  6. Overexpression of SATB1 is associated with biologic behavior in human renal cell carcinoma. PloS one 2014 — PMC4023980.
  7. Special AT-rich DNA-binding protein-1 expression is associated with liver cancer metastasis. Oncology letters 2016 — PMC5228311.
  8. Molecular correlates and prognostic significance of SATB1 expression in colorectal cancer. Diagnostic pathology 2012 — PMC3523011.
  9. PubMed PMID:1505028 — UniProt-cited evidence.
  10. PubMed PMID:14702039 — UniProt-cited evidence.
  11. PubMed PMID:16641997 — UniProt-cited evidence.