This website uses cookies to ensure you get the best experience on our website.


- Table of Contents
Plan chromogenic IHC for cytoplasmic SCRN1 staining, with cerebral cortex neurons as a positive tissue reference (HPA tissue IHC). The catalog antibody A10002-1 was used at 2 μg/mL in paraffin-section IHC (datasheet A10002-1).

Expected localisation, validated protocols, controls and antibodies — the at-a-glance facts below, then the full design guide.
| Expected localisation | Cytoplasmic, mainly in brain (HPA tissue IHC) | |
| Staining pattern | Cytoplasmic staining in brain; cortical neurons show medium signal (HPA tissue IHC) | |
| Antigen retrieval | EDTA pH 8.0 HIER, heat-mediated (datasheet A10002-1) | |
| Positive control | Cerebral cortex+1 more · see all | |
| Negative control | Adipose tissue+4 more · see all |
| Fixation | Keep fixation consistent across paraffin sections. (standard IHC practice; not target-specific) | |
| Caveat | Staining and RNA show medium consistency; verify specificity (HPA tissue IHC) | |
| Regulation | Brain-enhanced RNA expression (HPA tissue RNA) | |
| Isoform / epitope | 3 isoforms; check whether the epitope spans variants (UniProt) |
The catalog antibody’s IHC-P protocol (datasheet: A10002-1) is accompanied by three published chromogenic SCRN1 protocols (PMC4924679; PMC4357136; PMC9012169).
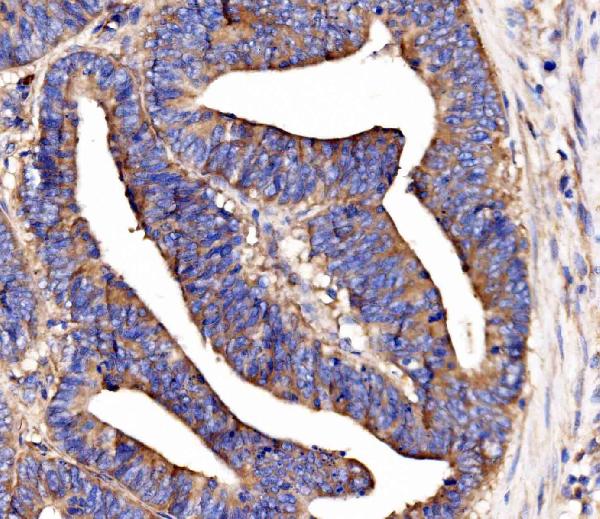
| Sample | Paraffin-embedded human rectal cancer tissue; fixative not specified (datasheet A10002-1) |
| Fixation | Image fixative and duration unreported (datasheet A10002-1); verify before use. |
| Sectioning | 4–5 µm sections on charged slides (standard) |
| Deparaffinisation | Xylene, graded ethanol series to water (standard) |
| Antigen retrieval | Heat retrieval: EDTA pH 8.0 (datasheet A10002-1); 20 min, 95–100 °C (standard) |
| Peroxidase block | 3% H2O2, 10 min, room temperature (standard) |
| Blocking | 10% goat serum (datasheet A10002-1) |
| Primary antibody | Rabbit anti-SCRN1, 2 μg/ml (datasheet A10002-1) |
| Primary incubation | Overnight at 4 °C (datasheet A10002-1) |
| Detection | Streptavidin-biotin complex (SABC), DAB chromogen (datasheet A10002-1) |
| Counterstain | Hematoxylin, blue, dehydrate and mount (standard) |
| Expected result | SCRN1-positive staining in neuronal cells of cerebral cortex (HPA tissue IHC: Medium). HPA tissue profile: Cytoplasmic expression mainly in brain. No signal in the no-primary control. |
SCRN1 is expected in the cytoplasm, consistent with its lack of a transmembrane segment (UniProt Q12765: cytoplasm; topology). In paraffin sections, look for neuronal staining in cerebral cortex and staining of non-germinal center cells in tonsil, both reported at Medium intensity (HPA tissue IHC). HPA rates the tissue profile Enhanced, while noting medium consistency with RNA data and pending external verification (HPA tissue IHC).
| Cerebral cortex shows cytoplasmic staining in neuronal cells at about Medium intensity. | This matches the reported cell type, compartment and level (HPA tissue IHC: cerebral cortex, neuronal cells, Medium; UniProt Q12765: cytoplasm). Judge the pattern in identifiable cells rather than the overall darkness of the section (general IHC practice). |
| Staining is predominantly nuclear or sharply outlines cell membranes. | That compartment conflicts with the reported cytoplasmic and cytosolic localization (UniProt Q12765: cytoplasm and no transmembrane segment; HPA subcellular: cytosol). Treat it as questionable until controls and a repeated run support its specificity (general IHC practice). |
| Adipocytes in adipose tissue stain prominently, or adrenal glandular cells appear positive. | Both cell populations are reported as Not detected (HPA tissue IHC). Investigate cross-reactivity or endogenous chromogenic activity before calling the signal SCRN1 (general IHC practice). A single discordant section does not identify which cause applies. |
| Color spreads across tissue and empty areas without a clear cellular pattern. | Diffuse deposit does not support the reported cytoplasmic pattern (HPA tissue IHC: cytoplasmic expression). Background can arise from nonspecific antibody binding or detection chemistry; compare staining controls and tissue-free areas (general IHC practice). |
| No neuronal signal is visible in an otherwise intact cerebral cortex section. | This misses a reported Medium positive population (HPA tissue IHC: cerebral cortex, neuronal cells). First assess the run and the identity of the sampled cells; absence alone cannot distinguish technical failure from variation in the specimen (general IHC practice). |
| Cell and tissue context | HPA reports Medium staining in cortical neurons and tonsillar non-germinal center cells, Low staining in several other listed populations, and Not detected staining in listed negative populations (HPA tissue IHC). Interpret intensity against the specific cell type, not the tissue name alone (general IHC practice). |
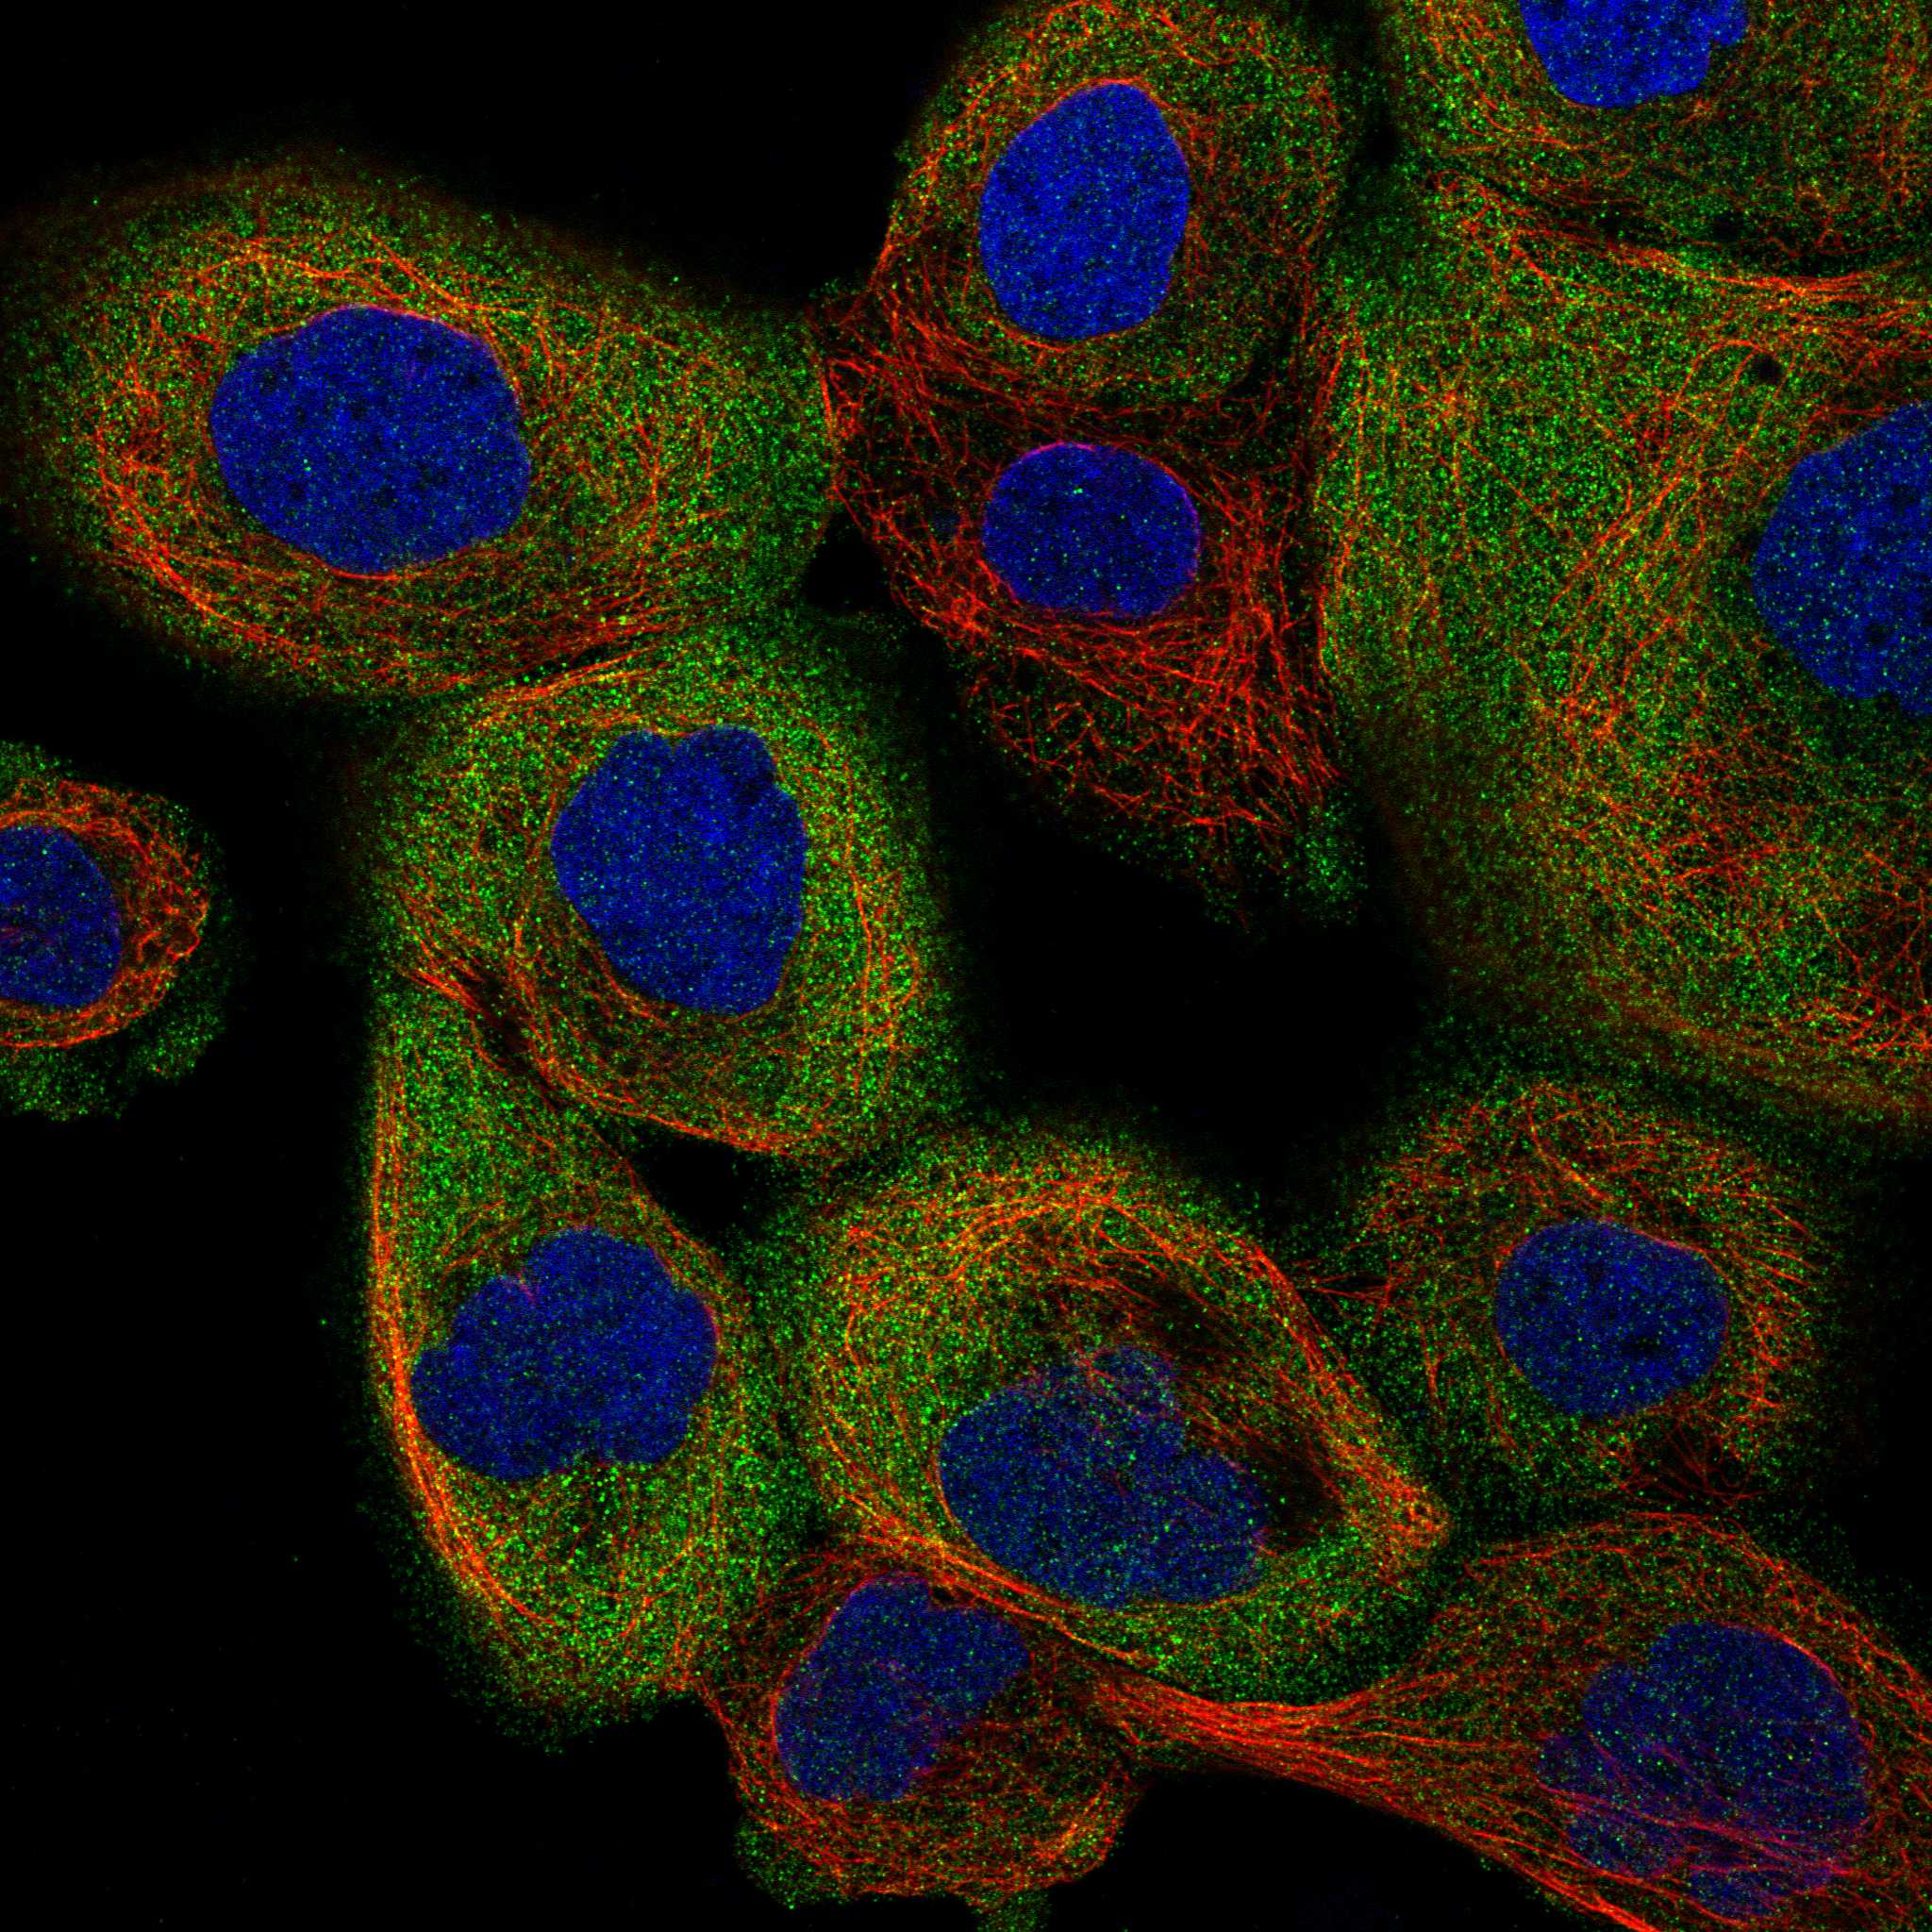
| Subcellular location | SCRN1 is annotated as cytoplasmic, with no transmembrane segment (UniProt Q12765), and HPA places it in the cytosol by ICC-IF (HPA subcellular). These observations support a cytoplasmic IHC call; they do not establish a target-specific antigen retrieval condition. |
| Antibody and profile validation | The supplied antibody HPA024517 has Enhanced IHC validation (HPA antibodies). The tissue profile is also rated Enhanced, but HPA describes medium consistency with RNA and pending external verification (HPA tissue IHC). Keep discordant staining provisional. |
| Isoform coverage | UniProt lists 3 SCRN1 isoforms (UniProt Q12765: isoforms 1, 2 and 3). The supplied evidence does not map the IHC antibody epitope or establish which isoforms it detects, so do not assign an unexpected pattern to a particular isoform. |
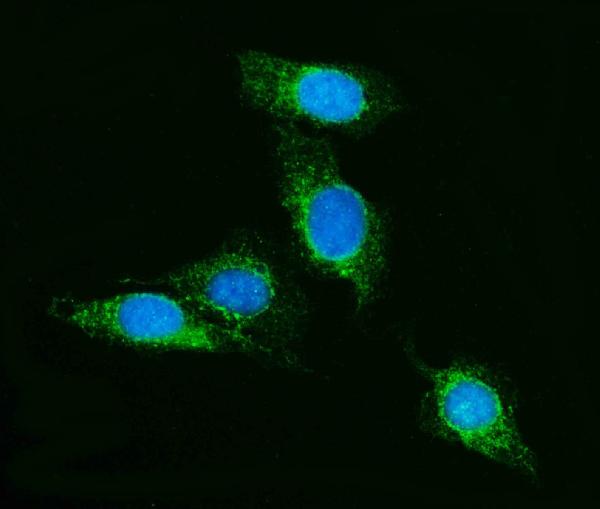
| ICC-IF comparison | HPA reports an approved cytosolic ICC-IF location and lists A-431, U-251MG and U2OS among imaged cell lines (HPA subcellular; HPA antibodies: ICC Approved). This supports a compartment comparison; ICC-IF images do not set an IHC staining intensity or supply an IF protocol. |
| Situation | Likely cause | Next action |
|---|---|---|
| Cortical neurons have no detectable chromogenic signal. | A reported Medium population is missing (HPA tissue IHC); the cause is unresolved from the slide alone. | Confirm neuronal morphology and that the control section developed; review antibody dilution, antigen retrieval and detection records, then repeat with a positive control (general IHC practice). No SCRN1-specific retrieval setting is supplied. |
| Staining is mainly nuclear or restricted to cell outlines. | The compartment conflicts with cytoplasmic SCRN1 and HPA's cytosolic ICC-IF location (UniProt Q12765; HPA subcellular). | Compare with a staining control and review morphology and chromogen deposits; repeat the IHC run if the compartment remains unclear (general IHC practice). Do not score the discordant compartment as confirmed SCRN1. |
| Adipose adipocytes or adrenal glandular cells stain strongly. | Those populations are listed as Not detected (HPA tissue IHC); cross-reactivity or endogenous detection activity is possible (general IHC practice). | Compare a no-primary control and inspect whether color follows cells or endogenous pigment; reassess the call against an HPA-listed positive population (general IHC practice). |
| A uniform haze obscures neuronal cytoplasm. | Nonspecific binding or excess chromogenic deposit can obscure cellular localization (general IHC practice). | Check a no-primary control, washing and development time; adjust blocking or antibody dilution within the laboratory's validated workflow (general IHC practice). Reassess only when cell boundaries are readable. |
| Tonsil and cortex appear to have different staining strengths. | HPA reports Medium staining for specified cells in both tissues, but the supplied evidence does not define a quantitative equality between sections (HPA tissue IHC). | Compare the named cell populations under matched processing and detection conditions; record compartment and cell type before comparing intensity (general IHC practice). |
| Does an ICC-IF cytosolic image validate an IHC-P result? | HPA approves the cytosolic ICC-IF location, while the IHC tissue profile has its own reliability caveat (HPA subcellular; HPA tissue IHC). | Use ICC-IF as compartment context only; judge paraffin-section staining against IHC cell patterns and controls (general IHC practice). Consult the separate IF/ICC guide for that application. |


Comprehensive Human Protein Atlas IHC scoring per tissue (reliability: Enhanced — Medium consistency between antibody staining and RNA expression data. Pending external verification.). Rows are taken directly from the HPA tissue chart — click any row's HPA link to view the source.
| Tissue | Cell type | Level | Evidence | Source |
|---|---|---|---|---|
| Cerebral cortex | Neuronal cells | Medium | Protein (IHC) | HPA → |
| Tonsil | Non-germinal center cells | Medium | Protein (IHC) | HPA → |
| Tissue | Cell type | Level | Evidence | Source |
|---|---|---|---|---|
| Adipose tissue | Adipocytes | Not detected | Protein (IHC) | HPA → |
| Adrenal gland | Glandular cells | Not detected | Protein (IHC) | HPA → |
| Appendix | Glandular cells | Not detected | Protein (IHC) | HPA → |
| Bone marrow | Hematopoietic cells | Not detected | Protein (IHC) | HPA → |
| Breast | Adipocytes | Not detected | Protein (IHC) | HPA → |
Troubleshoot SCRN1 staining in paraffin sections by checking retrieval, specimen handling, cytoplasmic localisation, detection background, and cell-specific scoring.
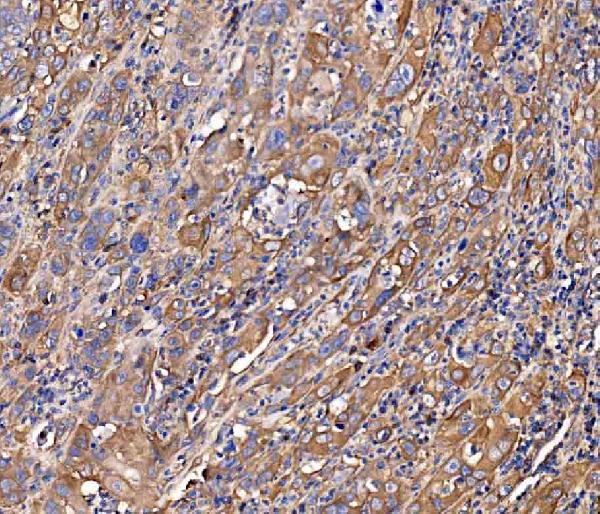
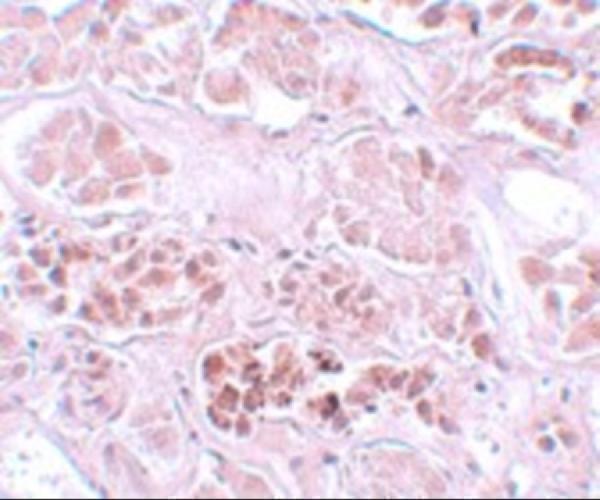
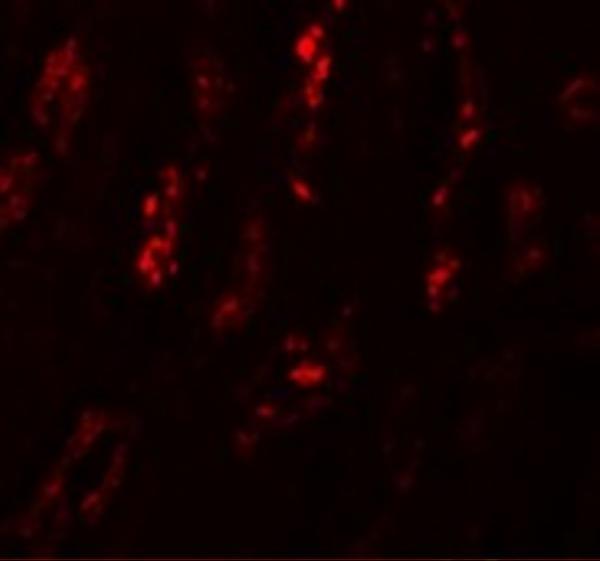
The catalog shows SCRN1 IHC images in human rectal cancer and kidney tissue, plus IF images in U20S and human kidney cells (catalog image captions).
A10002-1 has IHC images from human paraffin sections and an IF/ICC image from U20S cells (A10002-1 image captions). A10002 has an IHC image from human kidney tissue and an IF image from human kidney cells (A10002 image captions).
Which to pick: For paraffin-section IHC, choose A10002-1 when you want a documented starting condition: 2 μg/mL after heat retrieval in EDTA, pH 8.0; its caption does not report the fixative (A10002-1 IHC caption). For IF/ICC, A10002-1 lists both applications and shows U20S cells at 5 μg/mL, while A10002 lists IF and shows human kidney cells at 20 μg/mL (catalog applications; respective IF captions). Both list human, mouse and rat reactivity, but the supplied IHC/IF images show human samples only; neither catalog entry reports a clone (catalog reactivity and image captions; catalog clone fields).