SENP1 · Western blot design guide

Design a Western Blot for SENP1

Real validated SENP1 Western blot protocols, expected-band and isoform facts, troubleshooting for weak or shifted signal, and recommended anti-SENP1 WB antibodies. Everything you need to plan the experiment before you commit precious samples.
Last reviewed: May 2026 · Scientific review: Boster Bio technical team
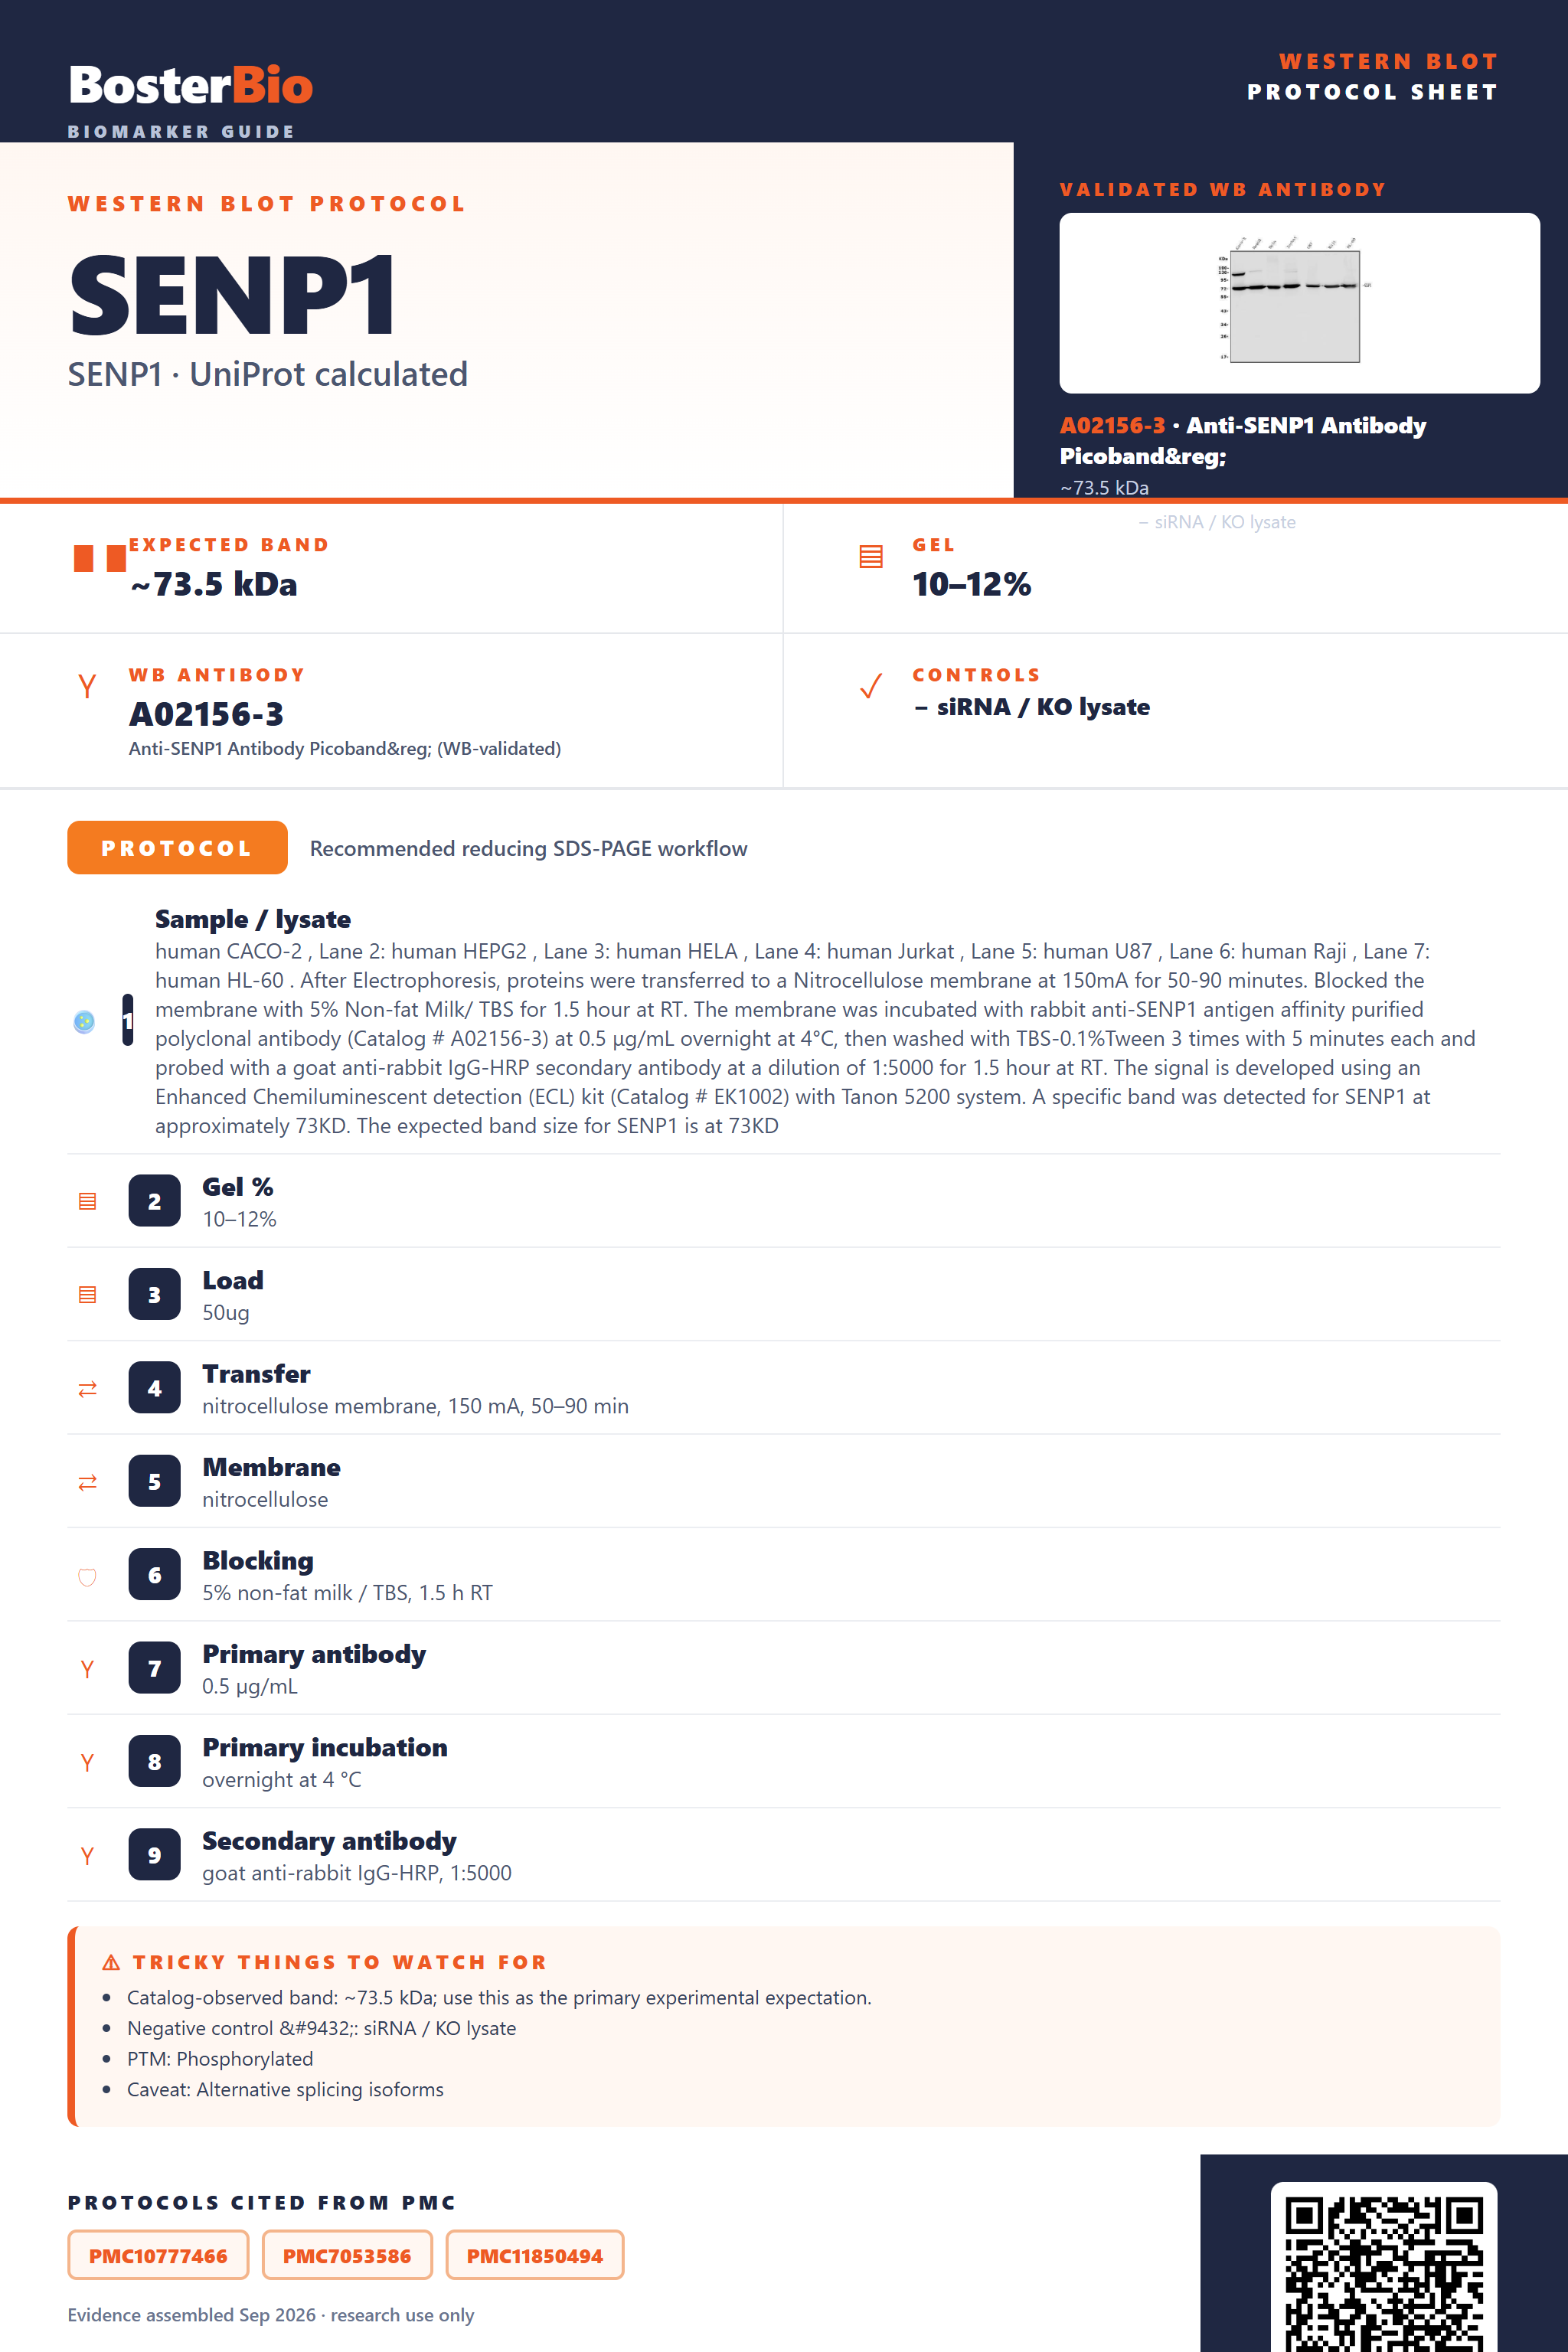
Western blot protocol sheet for SENP1: expected band ~73.5 kDa, antibody A02156-3, and PMC-cited SDS-PAGE protocol steps
SENP1 Western blot protocol sheet — expected band ~73.5 kDa, antibody A02156-3, controls and PMC citations. Open the full SENP1 WB guide →

SENP1 Western Blot Experimental Design Guide

Expected bands, validated protocols, controls and antibodies — the at-a-glance facts below, then the full design guide.

Must know before running
Expected band ~73.5 kDa
Observed band 73 kDa
Gel 10–12%
Negative control ⓘ siRNA / KO lysate
Important caveats
Reasons your observed band may differ from the expected size.
PTM Phosphorylated
Caveat Alternative splicing isoforms
Regulation LPS-induced
Isoform 2 isoform(s)
Section 1

Real Curated SENP1 Western Blot Protocols

Literature-validated Western blot parameters for SENP1 — gel percentage, transfer, blocking, antibody incubation and detection, extracted from published methods.

Recommended Western blot protocol parameters
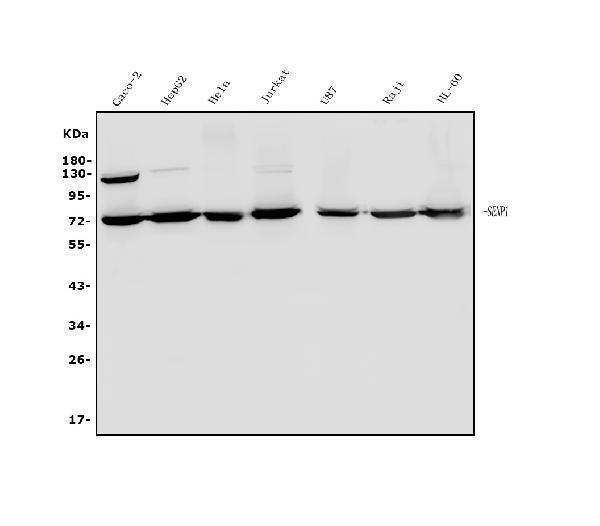
Sample / lysatehuman CACO-2 , Lane 2: human HEPG2 , Lane 3: human HELA , Lane 4: human Jurkat , Lane 5: human U87 , Lane 6: human Raji , Lane 7: human HL-60 . After Electrophoresis, proteins were transferred to a Nitrocellulose membrane at 150mA for 50-90 minutes. Blocked the membrane with 5% Non-fat Milk/ TBS for 1.5 hour at RT. The membrane was incubated with rabbit anti-SENP1 antigen affinity purified polyclonal antibody (Catalog # A02156-3) at 0.5 μg/mL overnight at 4°C, then washed with TBS-0.1%Tween 3 times with 5 minutes each and probed with a goat anti-rabbit IgG-HRP secondary antibody at a dilution of 1:5000 for 1.5 hour at RT. The signal is developed using an Enhanced Chemiluminescent detection (ECL) kit (Catalog # EK1002) with Tanon 5200 system. A specific band was detected for SENP1 at approximately 73KD. The expected band size for SENP1 is at 73KD
Gel %10–12%
Load50ug
Transfernitrocellulose membrane, 150 mA, 50–90 min
Membranenitrocellulose
Blocking5% non-fat milk / TBS, 1.5 h RT
Primary antibody0.5 µg/mL
Primary incubationovernight at 4 °C
Secondary antibodygoat anti-rabbit IgG-HRP, 1:5000
WashTBS-0.1% Tween, 3 × 5 min
DetectionECL
Exposure / imagingTanon 5200
Observed band73 kDa
Section 2

What Is the Expected SENP1 Western Blot Band Size?

SENP1's 73.5 kDa predicted mass matches its observed ~73 kDa band, since it lacks glycosylation, disulfide dimerization, or cleavage that would otherwise shift its size.

What am I looking at on my blot?
Single sharp band around 73 kDaMatches the predicted 73.5 kDa mass of full-length SENP1 with no modifications shifting its size
Second faint band a few kDa away from the main 73 kDa bandLikely isoform 2 from alternative splicing expressed alongside canonical isoform 1
Slightly diffuse or doublet appearance near 73 kDaHeterogeneous phosphorylation at the annotated serine residues causing minor mobility shifts
Band present in both nuclear and cytoplasmic lysate fractionsReflects SENP1 shuttling between nucleus and cytoplasm rather than two distinct protein species
No high-molecular-weight smear or shifted band above 73 kDaAbsence of glycosylation and disulfide-linked dimerization means SENP1 runs as a simple monomer
💡Expected SENP1 appearanceSENP1 typically appears as a single band at approximately 73 kDa in whole-cell lysate, matching its predicted 73.5 kDa mass since it carries no glycosylation, cleavage, or dimerization.
How each factor affects band size
Predicted mass (73.5 kDa)Sets the baseline migration position, closely matching the empirically observed ~73 kDa band
Alternative splicing (isoforms 1 and 2)Isoform 2 can appear as an additional band at a different size relative to canonical isoform 1
Phosphorylation at multiple serine residues (Ser57, Ser117, Ser132, Ser157)Can cause slight upward mobility shifts or a fuzzy/doublet appearance without changing true molecular weight
Absence of glycosylation and disulfide bondsKeeps the protein running as a single monomeric species without smearing or higher-MW dimer bands
Nucleocytoplasmic shuttling with no signal peptideEnsures the band is detectable in standard whole-cell lysate without needing secreted-fraction enrichment
Why is my band missing or off?
SituationLikely causeNext action
Multiple bandsIsoform 2 from alternative splicing runs alongside canonical isoform 1, or the SENP1 thiol protease has undergone partial degradationCompare the pattern to a positive control lysate and include fresh protease inhibitors during lysis to distinguish isoform bands from degradation products
Band higher than expectedHeterogeneous phosphorylation at the annotated serine residues reduces SDS-PAGE mobilityTreat lysate with a phosphatase before loading to collapse the shifted species toward the ~73 kDa position
Broad smear instead of sharp bandA mixed population of differentially phosphorylated SENP1 molecules migrates slightly differentlyIncrease resolving gel percentage or run time to separate phosphoforms, or dephosphorylate the sample before electrophoresis
Fragments below expected sizeSENP1 is itself a cysteine protease that can undergo autoproteolysis or degradation if not kept cold during lysisLyse cells on ice with fresh protease inhibitor cocktail and minimize freeze-thaw cycles of the lysate
Weak or no signalSENP1 shuttles between nucleus and cytoplasm, so signal can be diluted if only one subcellular fraction is probed or expression is low in the cell type usedUse whole-cell lysate, load 30-50 ug of total protein, and confirm with a cell line known to express SENP1 such as HeLa

Sample controls for SENP1 Western blot

🧪For positive controls for SENP1 in Western blot, you can use a whole-cell lysate from a commonly used line such as HEK293 or HeLa, ideally overexpressing SENP1, since no HPA tissue expression data is available to identify a native high-expressing source.
Positive control: HEK293 lysate (SENP1-overexpressing)
Negative control: ubiquitously expressed; use siRNA knockdown or KO line
Loading controls: Run GAPDH and β-actin blots alongside a total-protein stain (e.g., stain-free gel, Ponceau S, or REVERT) to confirm equal loading.
⚠️Feasibility: No HPA expression profile is available for SENP1, so a validated positive or negative tissue cannot be confirmed; given its nucleocytoplasmic shuttling and likely broad expression, rely on an overexpression lysate for the positive control and siRNA/CRISPR knockdown for specificity confirmation rather than tissue selection alone.

Comprehensive Human Protein Atlas IHC scoring per tissue. Rows are taken directly from the HPA tissue chart — click any row's HPA link to view the source.

Positive expression · recommended positive controls

TissueCell typeLevelEvidenceSource

Undetected expression · recommended negative controls

TissueCell typeLevelEvidenceSource
Section 3

Advanced SENP1 Western Blot Tips

Deeper troubleshooting and optimisation questions for SENP1, answered from its protein features.

Why does SENP1 run close to its predicted mass?
SENP1's predicted mass is 73.5 kDa and the observed band is 73 kDa, so migration tracks prediction closely. With no glycosylation and only four modified residues, there is little mass added by post-translational modification, so a single band near 73 kDa is the expected result rather than a shifted or smeared signal.
Will SENP1 isoforms 1 and 2 give different bands?
UniProt lists two SENP1 isoforms (1 and 2) from alternative splicing. Depending on which exons are affected and whether your antibody epitope falls in a variable region, isoform 2 may appear as an additional band of different apparent mass or may be missed entirely if the epitope is spliced out.
Do SENP1 phosphosites cause extra bands?
SENP1 is annotated as a phosphoprotein with four modified residues. Phosphorylation can cause minor mobility shifts or slight smearing around 73 kDa, but with no glycosylation or disulfide bonds contributing extra heterogeneity, phospho-driven shifts are usually subtle rather than resolving as clearly separated bands.
What blocking approach suits SENP1 detection?
Standard 5% non-fat milk in TBST is adequate since SENP1 has no glycosylation sites to complicate blocking. If probing with a phospho-specific antibody against one of its four modified residues, switch to BSA blocking to avoid milk phosphoproteins competing for antibody binding.
What transfer method to use for SENP1 Western blot?
At a predicted mass of 73.5 kDa, standard wet transfer onto PVDF at 100V for 60-90 minutes is sufficient; this size does not require extended semi-dry transfer or high-percentage gel modifications used for very large or very small proteins.
How should SENP1 signal be normalized for quantitation?
Because SENP1 shuttles between nucleus and cytoplasm, choose a loading control matching your fractionation: total protein stain or GAPDH for whole-cell/cytoplasmic lysates, or a nuclear marker if nuclear fractions are analyzed separately, so quantitation reflects true SENP1 abundance rather than fractionation artifacts.
What explains bands below 73 kDa for SENP1?
SENP1 is a thiol protease and can be susceptible to proteolytic clipping during lysis, generating lower-molecular-weight fragments distinct from the full-length 73 kDa protein. Include protease inhibitors, keep lysates cold, and avoid repeated freeze-thaw cycles to minimize degradation-derived bands.
Boster reagents

Best SENP1 Western Blot Antibodies

BosterBio's SENP1 antibodies are among the best-performing WB antibodies on the market — well cited, thoroughly validated, and orthogonally cross-validated against negative tissues and complementary methods.

Real WB data Western blot analysis of SENP1 using anti-SENP1 antibody (A02156-3). Electrophoresis was performed on a 5-20% SDS-PAGE gel at 70V (Stacking gel) / 90V (Resolving gel) for 2-3 hours. The sample well of each lane was loaded with 50ug of sample under reducing conditions. Lane 1: human CACO-2 whole cell lysates, Lane 2: human HEPG2 whole cell lysates, Lane 3: human HELA whole cell lysates, Lane 4: human Jurkat whole cell lysates, Lane 5: human U87 whole cell lysates, Lane 6: human Raji whole cell lysates, Lane 7: human HL-60 whole cell lysates. After Electrophoresis, proteins were transferred to a Nitrocellulose membrane at 150mA for 50-90 minutes. Blocked the membrane with 5% Non-fat Milk/ TBS for 1.5 hour at RT. The membrane was incubated with rabbit anti-SENP1 antigen affinity purified polyclonal antibody (Catalog # A02156-3) at 0.5 μg/mL overnight at 4°C, then washed with TBS-0.1%Tween 3 times with 5 minutes each and probed with a goat anti-rabbit IgG-HRP secondary antibody at a dilution of 1:5000 for 1.5 hour at RT. The signal is developed using an Enhanced Chemiluminescent detection (ECL) kit (Catalog # EK1002) with Tanon 5200 system. A specific band was detected for SENP1 at approximately 73KD. The expected band size for SENP1 is at 73KD.
Anti-SENP1 Antibody Picoband®
Cat # A02156-3
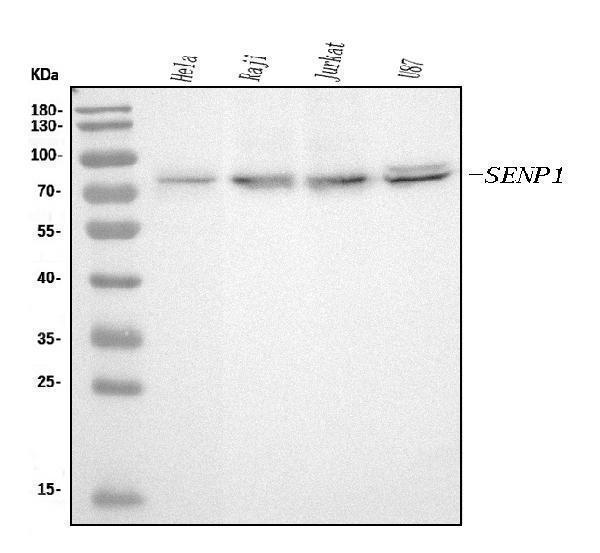
Real WB data Western blot analysis of SENP1 using anti-SENP1 antibody (M02156-1). Electrophoresis was performed on a 5-20% SDS-PAGE gel at 70V (Stacking gel) / 90V (Resolving gel) for 2-3 hours. The sample well of each lane was loaded with 30 ug of sample under reducing conditions. Lane 1: human Hela whole cell lysates, Lane 2: human Raji whole cell lysates, Lane 3: human Jurkat whole cell lysates, Lane 4: human U87 whole cell lysates. After electrophoresis, proteins were transferred to a nitrocellulose membrane at 150 mA for 50-90 minutes. Blocked the membrane with 5% non-fat milk/TBS for 1.5 hour at RT. The membrane was incubated with mouse anti-SENP1 antigen affinity purified monoclonal antibody (Catalog # M02156-1) at 0.5 μg/mL overnight at 4°C, then washed with TBS-0.1%Tween 3 times with 5 minutes each and probed with a goat anti-mouse IgG-HRP secondary antibody at a dilution of 1:10000 for 1.5 hour at RT. The signal is developed using an Enhanced Chemiluminescent detection (ECL) kit (Catalog # EK1001) with Tanon 5200 system. A specific band was detected for SENP1 at approximately 73 kDa. The expected band size for SENP1 is at 73 kDa.
Anti-SENP1 Antibody Picoband® (monoclonal, 5F4)
Cat # M02156-1

For SENP1 western blotting, these Boster antibodies are best-in-class, widely cited reagents with thorough validation, each backed by an authentic western blot image and cross-checked against negative-tissue controls and complementary detection methods for confident, reproducible results.

Which to pick: Two SENP1 antibodies are catalogued, A02156-3 and M02156-1, and both include a genuine western blot validation image. Either is a solid default; choose based on your preferred format or lot availability, confirming species reactivity with Boster before ordering.

Source: BosterBio SENP1 gene-info card — filtered to Western-blot-capable antibodies; each card shows that product's actual WB validation figure.

References

  1. UniProt Consortium. UniProt entry Q9P0U3.
  2. Human Protein Atlas. SENP1 tissue expression.