This website uses cookies to ensure you get the best experience on our website.


- Table of Contents
Plan SHMT2 chromogenic IHC in paraffin sections using hepatocytes or kidney proximal tubules as high-staining reference cells (HPA tissue IHC). This guide covers fixation, controls and interpretation of the cytoplasmic tissue pattern (HPA tissue IHC).

Expected localisation, validated protocols, controls and antibodies — the at-a-glance facts below, then the full design guide.
| Expected localisation | Cytoplasmic staining in most tissues (HPA tissue IHC) | |
| Staining pattern | Cytoplasmic staining in most tissues, including hepatocytes (HPA tissue IHC) | |
| Antigen retrieval | EDTA pH 8.0 HIER, heat-mediated (datasheet A03233-1) | |
| Positive control | Appendix+4 more · see all | |
| Negative control | Adipose tissue+4 more · see all |
| Fixation | Keep fixation consistent across paraffin sections. (standard IHC practice; not target-specific) | |
| Caveat | Cytoplasmic IHC cannot resolve mitochondrial location (HPA tissue IHC; UniProt) | |
| Regulation | Stimulus-linked regulation not specified (UniProt) | |
| Isoform / epitope | 3 isoforms; mature chain 30–504; epitope coverage unknown (UniProt) |
The catalog antibody’s IHC-P protocol (datasheet A03233-1) is accompanied by three published SHMT2 tissue-staining protocols (PMC8052717; PMC7581701; PMC5538688).
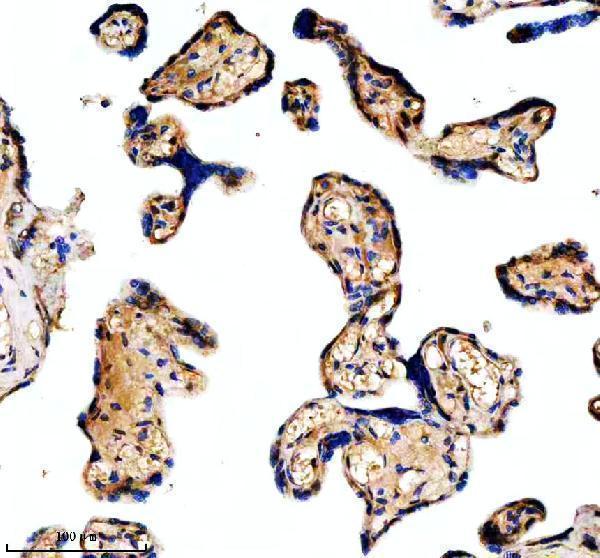
| Sample | Paraffin-embedded human placenta tissue; fixative not specified (datasheet A03233-1) |
| Fixation | Image fixative and duration unreported (datasheet A03233-1); verify before use. |
| Sectioning | 4–5 µm sections on charged slides (standard) |
| Deparaffinisation | Xylene, graded ethanol series to water (standard) |
| Antigen retrieval | Heat retrieval: EDTA pH 8.0 (datasheet A03233-1); 20 min, 95–100 °C (standard) |
| Peroxidase block | 3% H2O2, 10 min, room temperature (standard) |
| Blocking | 10% goat serum (datasheet A03233-1) |
| Primary antibody | Rabbit anti-SHMT2, 2-5 μg/ml (datasheet A03233-1) |
| Primary incubation | Overnight at 4 °C (datasheet A03233-1) |
| Detection | HRP-conjugated secondary, DAB chromogen (datasheet A03233-1) |
| Counterstain | Hematoxylin, blue, dehydrate and mount (standard) |
| Expected result | SHMT2-positive staining in lymphoid tissue of appendix (HPA tissue IHC: High). HPA tissue profile: Cytoplasmic expression in most tissues. No signal in the no-primary control. |
SHMT2 should show mainly cytoplasmic staining in IHC, consistent with its predominant mitochondrial localization (HPA: cytoplasmic expression in most tissues; UniProt P34897: mainly mitochondrial). High staining is reported in hepatocytes, kidney proximal tubules, and several glandular or lymphoid cell populations (HPA: tissue IHC). Its mitochondrial matrix and inner membrane annotations do not imply cell-surface staining; no transmembrane segment is annotated (UniProt P34897 topology).
| Cytoplasmic staining in hepatocytes, kidney proximal tubules, or intestinal glandular cells. | This fits reported high IHC staining in those cell populations (HPA: High in hepatocytes, proximal tubules, and small-intestinal glandular cells). A finely granular appearance would be consistent with mitochondrial localization, but chromogenic IHC alone cannot establish organelle identity (UniProt P34897: mainly mitochondrial; general IHC practice). |
| Predominantly membrane-rim or exclusively nuclear staining, with little cytoplasmic signal. | Recheck staining specificity and slide interpretation: the dominant pattern conflicts with HPA's cytoplasmic tissue profile and UniProt's mainly mitochondrial localization (HPA: tissue IHC; UniProt P34897). Nuclear localization is also annotated, so limited nuclear signal alone is not proof of an artefact (UniProt P34897). |
| Strong staining in adipocytes, cardiomyocytes, or skeletal myocytes. | These cell populations are reported as not detected by HPA tissue IHC (HPA: Not detected in adipocytes, cardiomyocytes, and skeletal myocytes). Treat a strong result as discordant and check cell identification, cross-reactivity, and chromogen generated by endogenous activity before assigning it to SHMT2 (general IHC practice). |
| Diffuse stain covers tissue and blank spaces, obscuring cell boundaries. | A widespread haze does not resolve the reported cell-type pattern (HPA: tissue IHC). Check reagent background, incomplete blocking or washing, and overdevelopment using appropriate detection controls (general IHC practice). This appearance alone cannot establish SHMT2 distribution (general IHC practice). |
| No staining in hepatocytes or kidney proximal tubules. | Both are reported as High in HPA tissue IHC, making them useful positive reference populations (HPA: High in hepatocytes and proximal tubules). First check tissue preservation, retrieval, antibody and detection performance, and a concurrent positive control; a single negative section does not overturn the reference pattern (general IHC practice). |
| Cell population and reference tissue | HPA reports High staining in liver hepatocytes, bronchial ciliated cell bodies, kidney proximal tubules, and selected glandular or lymphoid cells; it reports several stromal and muscle populations as Not detected (HPA: tissue IHC). Compare the same cell population, since a tissue can contain multiple cell types (general IHC practice). |
| Compartment and topology | The mainly mitochondrial protein is annotated in the matrix, nucleoid, inner membrane, cytoplasm, and nucleus, with no transmembrane segment (UniProt P34897). HPA tissue IHC summarizes its pattern as cytoplasmic; routine chromogenic sections cannot distinguish those mitochondrial subcompartments reliably (HPA: tissue IHC; general IHC practice). |
| Antibody validation and scope | HPA lists two rabbit polyclonal antibodies, HPA020543 and HPA020549, with Enhanced IHC validation (HPA: antibody validation). The tissue profile itself has Enhanced reliability with medium consistency between antibody staining and RNA expression; use a matched control when interpreting a surprising sample (HPA: tissue IHC; general IHC practice). |
| Processing and isoforms | UniProt annotates a processed chain spanning residues 30–504 and three isoforms (UniProt P34897). The supplied record gives no antibody epitope, so recognition of every isoform or processed form cannot be inferred; consult the antibody-specific documentation before attributing a missing signal to processing (UniProt P34897; general IHC practice). |
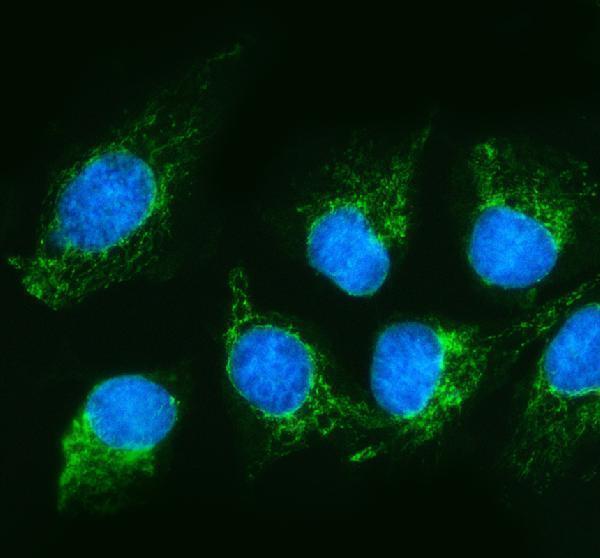
| IF/ICC Q&A: where should fluorescence localize? | Mainly to mitochondria, with an additional approved microtubule location in HPA cell images (HPA: subcellular ICC-IF). UniProt also annotates cytoplasmic and nuclear localization (UniProt P34897). These IF observations help interpret compartment differences; they do not specify an IHC staining protocol (HPA: subcellular ICC-IF). |
| Situation | Likely cause | Next action |
|---|---|---|
| Known positive tissue has no visible signal. | The staining run or tissue section may have failed; HPA reports High signal in hepatocytes and kidney proximal tubules (HPA: tissue IHC; general IHC practice). | Check a concurrent positive section, reagent integrity, retrieval conditions, detection steps, and counterstain strength; adjust only against controls (general IHC practice). |
| Signal is weak in the expected cytoplasm. | A weak assay or variable specimen may obscure the reported High cell populations; HPA's tissue profile has medium staining-to-RNA consistency (HPA: tissue IHC; general IHC practice). | Compare the same cell type on a reference section and review retrieval and antibody titration with the IHC-validated antibody (general IHC practice). |
| Diffuse brown background overwhelms cells. | Nonspecific reagent binding, endogenous detection activity, or excess chromogen development can reduce contrast (general IHC practice). | Use an appropriate negative or detection-only control; review blocking, washing, and development time before interpreting cellular signal (general IHC practice). |
| HPA-listed undetected cells stain strongly. | Cross-reactivity, endogenous detection activity, or misidentified cells are possible; HPA reports Not detected in adipocytes and cardiomyocytes (HPA: tissue IHC; general IHC practice). | Confirm the cell type and compare with a positive reference and detection control; avoid calling SHMT2 from intensity alone (general IHC practice). |
| Only nuclei or cell borders stain. | A dominant nuclear or membrane-rim pattern conflicts with the mainly cytoplasmic tissue profile, though UniProt permits some nuclear localization (HPA: tissue IHC; UniProt P34897). | Review morphology and controls, then compare with the expected cytoplasmic signal; do not discard limited nuclear signal solely on location (general IHC practice; UniProt P34897). |
| Two specimens show different staining intensity. | Different cell populations or specimen quality may contribute; HPA reports High, Low, and Not detected populations rather than one universal intensity (HPA: tissue IHC; general IHC practice). | Score the same cell population across specimens with a shared positive control and consistent detection settings; record compartment and background separately (general IHC practice). |
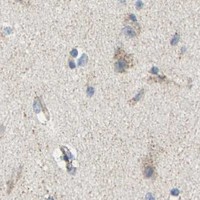
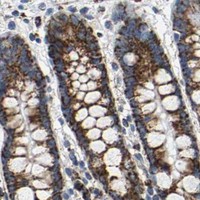
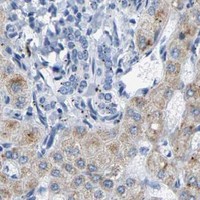
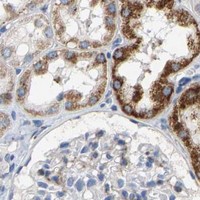


Comprehensive Human Protein Atlas IHC scoring per tissue (reliability: Enhanced — Medium consistency between antibody staining and RNA expression data.). Rows are taken directly from the HPA tissue chart — click any row's HPA link to view the source.
| Tissue | Cell type | Level | Evidence | Source |
|---|---|---|---|---|
| Appendix | Lymphoid tissue | High | Protein (IHC) | HPA → |
| Bronchus | Ciliated cells (cell body) | High | Protein (IHC) | HPA → |
| Colon | Glandular cells | High | Protein (IHC) | HPA → |
| Kidney | Proximal tubules (cell body) | High | Protein (IHC) | HPA → |
| Liver | Hepatocytes | High | Protein (IHC) | HPA → |
| Tissue | Cell type | Level | Evidence | Source |
|---|---|---|---|---|
| Adipose tissue | Adipocytes | Not detected | Protein (IHC) | HPA → |
| Heart muscle | Cardiomyocytes | Not detected | Protein (IHC) | HPA → |
| Ovary | Ovarian stroma cells | Not detected | Protein (IHC) | HPA → |
| Skeletal muscle | Myocytes | Not detected | Protein (IHC) | HPA → |
| Smooth muscle | Smooth muscle cells | Not detected | Protein (IHC) | HPA → |
Troubleshoot SHMT2 staining in paraffin sections by checking retrieval, cellular distribution, controls, and scoring before interpreting signal intensity.
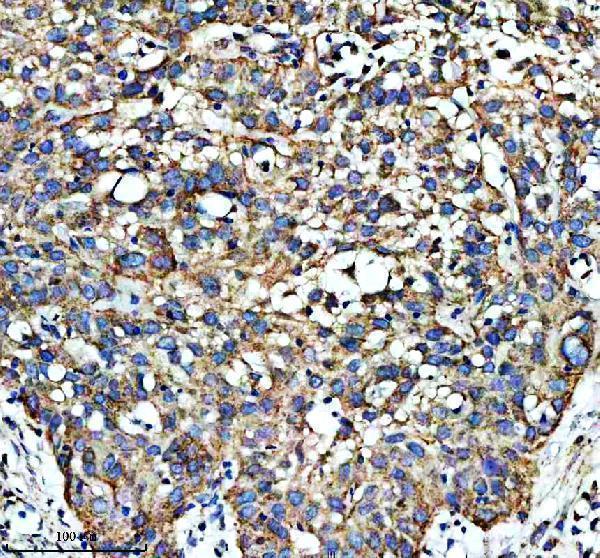
A03233-1 has IHC images from human paraffin sections and IF images from U2OS cells and human paraffin sections (A03233-1 image captions). Human, mouse and rat reactivity is listed (catalog: reactivity).
A03233-1 is shown in chromogenic IHC on human placenta, bladder cancer, lung cancer and liver cancer paraffin sections (A03233-1 IHC captions). The same SKU is shown in IF on U2OS cells and human colon and thyroid cancer paraffin sections (A03233-1 IF captions).
Which to pick: For tissue IHC, choose A03233-1 at the listed 2–5 μg/ml range (catalog: IHC dilution); its own IHC captions show EDTA retrieval and DAB detection in paraffin sections, but do not report the fixative (A03233-1 IHC captions). For IF/ICC, A03233-1 lists both applications at 5 μg/ml and has corresponding cell and tissue IF images (catalog: applications and IF dilution; A03233-1 IF captions). For mouse or rat work, A03233-1 lists both species as reactive, while its shown IHC images use human tissue (catalog: reactivity; A03233-1 IHC captions).