SLC3A2 / Amino acid transporter heavy chain SLC3A2 · Western blot design guide

Design a Western Blot for SLC3A2

Real validated SLC3A2 Western blot protocols, expected-band and isoform facts, troubleshooting for weak or shifted signal, and recommended anti-SLC3A2 WB antibodies. Everything you need to plan the experiment before you commit precious samples.

Evidence assembled September 2026 · For research use; verify linked source records and product datasheet before use
Western blot protocol sheet for SLC3A2: expected band ~57.9 kDa, hero antibody A01794-1, catalog values and labelled standard workflow; separate PMC comparisons on the guide
Printable SLC3A2 Western blot protocol sheet — expected band ~57.9 kDa, antibody A01794-1, controls and PMC citations. Open the full SLC3A2 WB guide →

SLC3A2 Western Blot Experimental Design Guide

Expected bands, validated protocols, controls and antibodies — the at-a-glance facts below, then the full design guide.

Must know before running
Expected band ~57.9 kDa
Gel 12–15% (standard starting point)
Positive control ⓘ Cerebral cortex (IHC candidate; verify WB) +4 more
Negative control ⓘ Adipose tissue (IHC candidate; verify WB)
Important caveats
Reasons your observed band may differ from the expected size.
PTM Glycosylated + Phosphorylated
Caveat Modification-state controls
Gene-set association MSigDB Hallmark membership
Isoform 4 isoform(s)
Section 1

Real Curated SLC3A2 Western Blot Protocols

The A01794-1 protocol combines labelled catalog values with standard starting conditions. Published comparisons retain their own sample, reagent and detection scope.

Recommended Western blot protocol parameters
Sample / lysateHEB cells (catalog A01794-1)
Gel %12–15% (standard starting point)
Load20–30 µg total protein per lane; optimize for abundance (standard starting point)
TransferStandard semi-dry transfer; verify efficiency (standard starting point)
Membrane0.45 µm PVDF (standard starting point)
Blocking5% milk or 5% BSA in TBST (standard starting point)
Primary antibodyA01794-1; use the WB datasheet starting dilution (standard starting point)
Primary incubationOvernight at 4 °C (standard starting point)
Secondary antibody1:20000 (catalog A01794-1)
Secondary incubation1 h at room temperature (standard starting point)
Wash3 × 5 min in TBST (standard starting point)
DetectionECL; bracket exposures to avoid saturation (standard starting point)
Section 2

What Is the Expected SLC3A2 Western Blot Band Size?

SLC3A2 has a predicted mass of 57.9 kDa; glycosylation, isoforms and heterodimer formation may affect migration, but no empirical band is supplied.

What am I looking at on my blot?
Band near 57.9 kDaConsistent with the predicted SLC3A2 mass; confirm its identity with controls.
Band above 57.9 kDaN-linked glycosylation could affect migration, but its visible effect is unestablished.
Higher band under non-reducing conditionsCould reflect the disulfide-linked SLC3A2–light-subunit heterodimer.
Several bandsCould reflect isoforms or glycosylation states; distinct isoform bands are unestablished.
💡Expected SLC3A2 appearanceUniProt predicts 57.9 kDa for SLC3A2; glycosylation and disulfide-linked heterodimer formation may alter migration, but no empirical band size is supplied, so confirm band identity with controls.
How each factor affects band size
Predicted molecular mass57.9 kDa is the sequence-based reference, not a measured band.
N-linked glycosylation at Asn264 and Asn280May affect apparent mass; the size of any shift is unknown.
Complex N-linked glycosylation at Asn323May affect apparent mass; the size of any shift is unknown.
N-linked glycosylation at Asn405May affect apparent mass; the size of any shift is unknown.
Disulfide-linked heterodimerMay produce a higher band under non-reducing conditions; its mass depends on the light subunit.
Isoforms 1, 2, 3 and 5May differ in size, but their masses and band separation are unspecified.
Why is my band missing or off?
SituationLikely causeNext action
No band in lysateMembrane-localized SLC3A2 may be poorly extracted.Check membrane extraction and include a positive control.
Band higher than expectedN-linked glycosylation or an incompletely reduced heterodimer may contribute.Compare deglycosylated and fully reduced samples.
Band lower than expectedReduced glycosylation could affect migration; the band's identity is uncertain.Compare deglycosylated samples and use an independent SLC3A2 antibody.
Broad smear instead of sharp bandHeterogeneous N-linked glycans are possible, but a smear is not established by site annotations.Compare before and after deglycosylation.
Multiple bandsIsoforms or different glycosylation states are possible; their separation is unestablished.Compare deglycosylated samples and verify bands with an independent antibody.
Weak or no signalMembrane localization may limit recovery in the tested fraction.Check membrane enrichment, extraction and a positive control.

Sample controls for SLC3A2 Western blot

🧪HPA-IHC candidate guidance (verify in WB): For positive controls for SLC3A2 in Western blot, you can use cerebral cortex lysate, which shows high HPA expression.
Positive control: Cerebral cortex (IHC candidate; verify WB)
Negative control: Adipose tissue (IHC candidate; verify WB)
Loading controls: Run GAPDH, β-actin, and a total-protein stain such as Ponceau alongside the samples.
⚠️Feasibility: As a cell-membrane protein, SLC3A2 may give a stronger signal in membrane-enriched lysates.

HPA tissue expression evidence for SLC3A2

Comprehensive Human Protein Atlas IHC scoring per tissue. Rows are taken directly from the HPA tissue chart — click any row's HPA link to view the source.

Higher expression tissues · candidate positive controls from IHC

TissueCell typeLevelEvidenceSource
Cerebral cortex endothelial cells High Protein (IHC) HPA →
Kidney proximal tubules (cell body) High Protein (IHC) HPA →
Pancreas pancreatic endocrine cells High Protein (IHC) HPA →
Parathyroid gland glandular cells High Protein (IHC) HPA →
Placenta trophoblastic cells High Protein (IHC) HPA →

Lower expression tissues · IHC evidence, not confirmed WB-negative controls

TissueCell typeLevelEvidenceSource
Adipose tissue adipocytes Not detected Protein (IHC) HPA →
Adrenal gland glandular cells Not detected Protein (IHC) HPA →
Appendix glandular cells Not detected Protein (IHC) HPA →
Bone marrow hematopoietic cells Not detected Protein (IHC) HPA →
Breast adipocytes Not detected Protein (IHC) HPA →
Section 3

Advanced SLC3A2 Western Blot Tips

Deeper troubleshooting and optimisation questions for SLC3A2, answered from its protein features.

How should SLC3A2 band migration be interpreted?
Band shift · Use the separately labelled calculated mass and catalog-observed evidence above. A sequence annotation does not establish an observed migration shift. Verify target identity with orthogonal controls.
Could SLC3A2 isoforms produce different bands?
Isoforms · UniProt lists isoforms 1, 2, 3 and 5. Its alternative-sequence records describe different N-terminal sequences for isoforms 1, 3 and 5. Check whether the antibody recognizes the sequence present in each isoform before assigning bands; the records do not establish their apparent masses.
Which listed modifications should guide band interpretation?
PTM · UniProt lists N-acetylserine and phosphoserine at position 2; phosphothreonine at 5; phosphoserine at 33, 64, 305, 307, 309 and 426; and the supplied annotation “Phosphoserine N-acetylmethionine” at 430. These are UniProt coordinates, which may differ from antibody or paper numbering. Their presence does not demonstrate a visible band shift.
Does this guide establish induction of SLC3A2?
Induction · No general induction response is established by this guide. A pathway or gene-set association is not evidence of induction in a particular specimen. Verify the relevant treatment and control in a target-specific experiment.
How should transfer be checked for SLC3A2?
Transfer · Standard workflow guidance: verify transfer efficiency for the intended target size before interpreting a weak signal. Use total-protein assessment and optimize transfer for the membrane, gel and apparatus; the labelled catalog values take precedence.
How should blocking be optimized?
Blocking · Standard workflow guidance: follow the A01794-1 datasheet where specified. Otherwise compare 5% milk or 5% BSA in TBST; for a phospho-specific assay start with BSA. Optimize background and specific signal with matched controls.
What should be controlled when quantifying SLC3A2?
Quantitation · Use the same sample preparation and reducing conditions across samples, and quantify the same resolved band or defined set of bands consistently. SLC3A2 is membrane-associated, has four listed isoforms and forms a disulfide-linked heterodimer; changes in recovery or band selection could complicate comparisons.
Why might SLC3A2 migrate differently from its predicted mass?
Interpretation · The predicted mass is 57.9 kDa. UniProt lists N-linked glycosylation at Asn264, Asn280, Asn323 and Asn405, which may affect apparent migration. No observed band position is supplied, and these features alone do not establish a visible shift.

SLC3A2 forms a disulfide-linked heterodimer with a catalytic light subunit, and UniProt lists one disulfide bond. Compare reducing and nonreducing samples when assessing a higher-mass band: disruption of the intersubunit linkage could change its migration. These features alone cannot identify a particular band.

Consider the listed disulfide-linked heterodimer with a non-glycosylated light subunit, especially if the band changes under reducing conditions. The listed N-linked sites may also affect SLC3A2 migration. Neither feature proves the identity of an unexpected band.

UniProt places SLC3A2 at the cell membrane, including the apical cell membrane, and lists a transmembrane helix and signal-anchor keyword. Include membrane-containing material when preparing samples, and keep the fraction used consistent across comparisons.
Boster reagents

SLC3A2 Western Blot Antibodies

Catalog antibodies with Western blot application and product-specific WB images. Evaluate suitability with the reported sample, controls and experimental conditions.

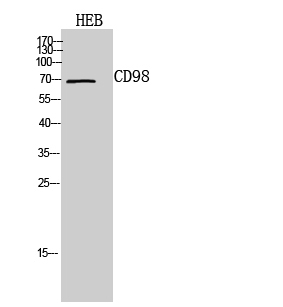
Real WB data Western Blot analysis of HEB cells using CD98 Polyclonal Antibody. Secondary antibody was diluted at 1:20000
Anti-CD98 SLC3A2 Antibody
Cat # A01794-1
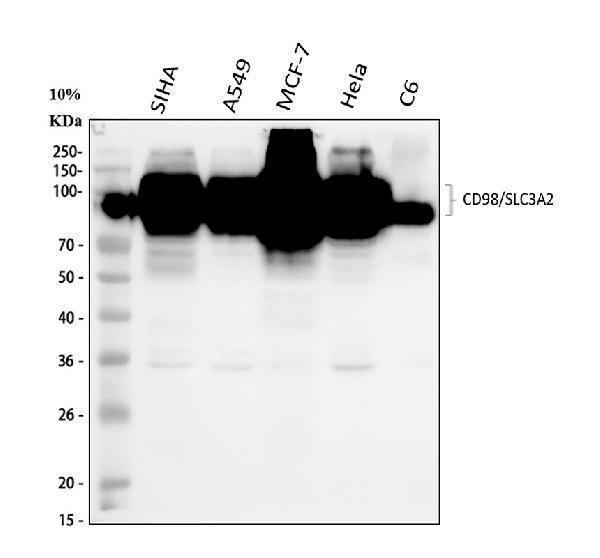
Real WB data Western blot analysis of CD98/SLC3A2 using anti-CD98/SLC3A2 antibody (A01794-4). Electrophoresis was performed on a 8% SDS-PAGE gel at 80V (Stacking gel) / 120V (Resolving gel) for 2 hours. The sample well of each lane was loaded with 30 ug of sample under reducing conditions. Lane 1: human SiHa whole cell lysates, Lane 2: human A549 whole cell lysates, Lane 3: human MCF-7 whole cell lysates, Lane 4: human Hela whole cell lysates, Lane 5: rat C6 whole cell lysates. After electrophoresis, proteins were transferred to a nitrocellulose membrane at 150 mA for 50-90 minutes. Blocked the membrane with 5% non-fat milk/TBS for 1.5 hour at RT. The membrane was incubated with rabbit anti-CD98/SLC3A2 antigen affinity purified polyclonal antibody (A01794-4) at 1:1000 overnight at 4°C, then washed with TBS-0.1%Tween 3 times with 5 minutes each and probed with a goat anti-rabbit IgG-HRP secondary antibody at a dilution of 1:5000 for 1.5 hour at RT. The signal is developed using an ECL Plus Western Blotting Substrate (Catalog # AR1196-200) with Tanon 5200 system. A specific band was detected for CD98/SLC3A2 at approximately 75-120 kDa. The expected band size for CD98/SLC3A2 is at 68,71 kDa.
Anti-CD98/SLC3A2 Antibody
Cat # A01794-4
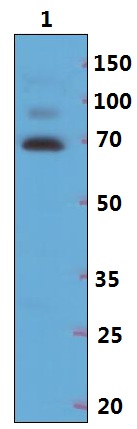
Real WB data Western blot (WB) analysis of SLC3A2 polyclonal antibody at 1:500 dilution Lane1:HEB whole cell lysate(40ug)
Anti-SLC3A2 Antibody
Cat # A01794

Three the supplier anti-SLC3A2 antibodies have Western blot images. A01794-4 shows human SiHa, A549, MCF-7 and HeLa and rat C6 lysates, with a reported 75–120 kDa band versus an expected 68/71 kDa. These examples do not establish universal validation.

Which to pick: For human or rat lysates, A01794-4 has the most detailed WB example, including sample lanes and conditions. A01794 shows human HEB lysate. A01794-1 lists human, mouse and rat reactivity, but its image caption identifies only HEB cells.

Source: BosterBio SLC3A2 gene-info card — filtered to Western-blot-capable antibodies; each card shows that product's actual WB validation figure.