This website uses cookies to ensure you get the best experience on our website.


- Table of Contents
Plan SORD staining in paraffin sections using the catalog antibody at 2 μg/ml with chromogenic detection (datasheet M07851-1). Compare cytoplasmic staining in hepatocytes and prostate glandular cells with adipocytes as a negative control (HPA tissue IHC).

Expected localisation, validated protocols, controls and antibodies — the at-a-glance facts below, then the full design guide.
| Expected localisation | Cytoplasmic staining in glandular cells (HPA tissue IHC) | |
| Staining pattern | High cytoplasmic staining in glandular cells and hepatocytes (HPA tissue IHC) | |
| Antigen retrieval | EDTA pH 8.0 HIER, heat-mediated (datasheet M07851-1) | |
| Positive control | Cervix+4 more · see all | |
| Negative control | Adipose tissue+4 more · see all |
| Fixation | Keep fixation consistent across paraffin sections. (standard IHC practice; not target-specific) | |
| Caveat | Antibody staining has medium concordance with RNA (HPA tissue IHC) | |
| Regulation | RNA higher in cervix, liver, thyroid (HPA tissue IHC: RNA specificity) | |
| Isoform / epitope | 2 isoforms; epitope coverage is unspecified (UniProt) |
Compare the catalog antibody’s paraffin IHC protocol (datasheet: M07851-1) with a published colorectal cancer workflow (PMC12533051).
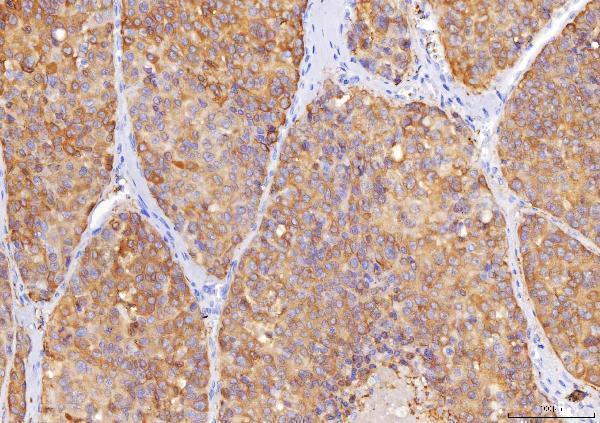
| Sample | Paraffin-embedded human liver cancer tissue; fixative not specified (datasheet M07851-1) |
| Fixation | Image fixative and duration unreported (datasheet M07851-1); verify before use. |
| Sectioning | 4–5 µm sections on charged slides (standard) |
| Deparaffinisation | Xylene, graded ethanol series to water (standard) |
| Antigen retrieval | Heat retrieval: EDTA pH 8.0 (datasheet M07851-1); 20 min, 95–100 °C (standard) |
| Peroxidase block | 3% H2O2, 10 min, room temperature (standard) |
| Blocking | 10% goat serum (datasheet M07851-1) |
| Primary antibody | Mouse monoclonal (clone 12B10G2) anti-SORD, 2 μg/ml (datasheet M07851-1) |
| Primary incubation | Overnight at 4 °C (datasheet M07851-1) |
| Detection | HRP-conjugated secondary, DAB chromogen (datasheet M07851-1) |
| Counterstain | Hematoxylin, blue, dehydrate and mount (standard) |
| Expected result | SORD-positive staining in glandular cells of cervix (HPA tissue IHC: High). HPA tissue profile: Cytoplasmic expression in several glandular cell types with high expression levels in prostate, seminal vesicle, hepatocytes and uterus. No signal in the no-primary control. |
SORD staining should be predominantly cytoplasmic in glandular cells, with strong IHC signal reported in prostate, seminal vesicle, cervix, endometrium and thyroid gland, and in hepatocytes (HPA tissue IHC). HPA rates tissue staining reliability as Enhanced, with medium consistency between antibody staining and RNA expression (HPA tissue IHC). UniProt reports no transmembrane segment; its mitochondrial and flagellar annotations concern sperm-associated localization (UniProt Q00796 topology and subcellular location).
| Strong cytoplasmic staining in prostate or seminal-vesicle glandular cells, or in hepatocytes. | This matches HPA's High IHC staining in those cell types (HPA tissue IHC). Judge signal within the named cells; a uniformly stained section does not reproduce the reported cell-specific pattern. |
| Strong staining concentrated at ciliary rootlets in fallopian-tube ciliated cells. | This is a specifically reported High pattern (HPA tissue IHC). It can coexist with the broader glandular cytoplasmic pattern; assess the ciliated cells and their rootlets separately. |
| Predominantly nuclear staining where cytoplasmic signal is absent. | This does not match HPA's cytoplasmic tissue profile or approved cytosolic ICC-IF localization (HPA tissue IHC; HPA subcellular). Treat it as suspect and check controls before assigning it to SORD. |
| Strong staining in adipocytes or bone-marrow hematopoietic cells. | HPA reports SORD as not detected in those cells (HPA tissue IHC). A reproducible signal there merits investigation for cross-reactivity or endogenous detection activity; staining alone cannot identify its cause. |
| No discernible signal in a technically adequate liver section. | HPA reports High hepatocyte staining, and UniProt reports liver expression (HPA tissue IHC; UniProt Q00796 tissue specificity). Investigate assay performance before interpreting another section as SORD-negative. |
| Tissue and cell choice | HPA reports High staining in hepatocytes and several glandular cell types, but not detected staining in selected adipocytes and hematopoietic cells (HPA tissue IHC). Select controls by the named cell type, not tissue name alone. |
| Antibody evidence | Both listed rabbit polyclonal antibodies, HPA040260 and HPA040621, have Enhanced IHC validation; only HPA040260 has Approved ICC status (HPA antibodies). Those ratings support the reported applications, not identical results under every assay condition. |
| Subcellular context | HPA reports mainly cytosolic ICC-IF localization, with additional acrosome and equatorial-segment signal (HPA subcellular). UniProt places SORD near sperm flagellar mitochondria and plasma membrane (UniProt Q00796 subcellular location). These sperm observations do not make membrane staining the expected pattern throughout tissue. |
| Topology and molecular forms | UniProt lists no transmembrane segment, two isoforms and a 2–357 protein chain (UniProt Q00796 topology, isoforms and processing). Without an antibody epitope map, these entries cannot predict which form the IHC-validated antibody detects. |
| Reported tissue discrepancy | UniProt reports epididymal protein expression and secretion into epididymosomes, while HPA reports epididymal glandular cells as not detected by tissue IHC (UniProt Q00796 tissue specificity and subcellular location; HPA tissue IHC). Treat an epididymal result as assay- and cell-context dependent. |
| Situation | Likely cause | Next action |
|---|---|---|
| No hepatocyte signal in liver. | The result conflicts with HPA's High hepatocyte staining and UniProt's liver-expression report (HPA tissue IHC; UniProt Q00796 tissue specificity). | Check section integrity, positive-control performance, retrieval, primary-antibody dilution and chromogenic detection as general IHC workflow checks; no SORD-specific fixation sensitivity is supplied. |
| Nuclear staining dominates. | The compartment conflicts with HPA's cytoplasmic tissue profile and approved cytosolic ICC-IF localization (HPA tissue IHC; HPA subcellular). | Compare a known-positive section with a primary-omission control; review blocking and chromogen background before scoring nuclear signal as specific (general IHC practice). |
| Strong signal appears in adipocytes or marrow hematopoietic cells. | Those cell types are not detected in HPA tissue IHC; cross-reactivity or endogenous detection activity is possible, but the image alone cannot distinguish them (HPA tissue IHC; general IHC practice). | Run appropriate negative and detection-only controls, then compare the cell-specific pattern with an HPA-positive tissue (general IHC practice; HPA tissue IHC). |
| Diffuse color obscures cell boundaries. | A widespread haze prevents assessment of HPA's reported cell-specific cytoplasmic pattern (HPA tissue IHC); inadequate blocking, washing or detection controls can cause background (general IHC practice). | Review the negative control, blocking, wash steps, primary-antibody dilution and chromogen development; rescore only when individual positive cells remain distinguishable (general IHC practice). |
| Epididymal glandular cells appear negative. | HPA records them as not detected, despite UniProt reporting SORD protein in epididymis and epididymosomes (HPA tissue IHC; UniProt Q00796 tissue specificity and subcellular location). | Do not use this discrepancy alone to declare assay failure. Check a separate HPA-positive cell type, such as hepatocytes, before interpreting the epididymal section (HPA tissue IHC). |
| Q: Can approved ICC-IF localization set the IHC-P staining pattern or protocol? | ICC-IF images support mainly cytosolic localization and additional sperm-region signal; tissue IHC reports cell-specific staining in sections (HPA subcellular; HPA tissue IHC). | A: Use the tissue IHC pattern to interpret paraffin sections. Consult the separate IF/ICC guide for fluorescence work; ICC approval does not supply IHC-P conditions (HPA antibodies; HPA tissue IHC). |


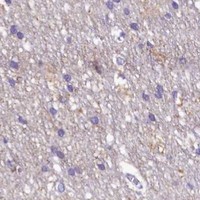
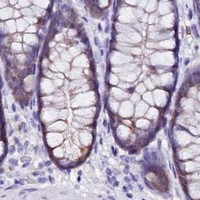
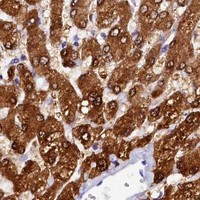
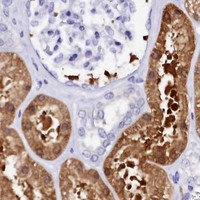


Comprehensive Human Protein Atlas IHC scoring per tissue (reliability: Enhanced — Medium consistency between antibody staining and RNA expression data.). Rows are taken directly from the HPA tissue chart — click any row's HPA link to view the source.
| Tissue | Cell type | Level | Evidence | Source |
|---|---|---|---|---|
| Cervix | Glandular cells | High | Protein (IHC) | HPA → |
| Endometrium | Glandular cells | High | Protein (IHC) | HPA → |
| Fallopian tube | Ciliated cells (ciliary rootlets) | High | Protein (IHC) | HPA → |
| Liver | Hepatocytes | High | Protein (IHC) | HPA → |
| Nasopharynx | Basal cells | High | Protein (IHC) | HPA → |
| Tissue | Cell type | Level | Evidence | Source |
|---|---|---|---|---|
| Adipose tissue | Adipocytes | Not detected | Protein (IHC) | HPA → |
| Bone marrow | Hematopoietic cells | Not detected | Protein (IHC) | HPA → |
| Bronchus | Basal cells | Not detected | Protein (IHC) | HPA → |
| Caudate | Glial cells | Not detected | Protein (IHC) | HPA → |
| Cerebellum | Cells in granular layer | Not detected | Protein (IHC) | HPA → |
Troubleshoot SORD staining in paraffin sections by checking retrieval, cell identity and localisation before comparing staining intensity across specimens.
Anti-SORD antibodies have IHC data from paraffin sections of human tumors and rat kidney, plus IF data from A431 cells (catalog image captions).
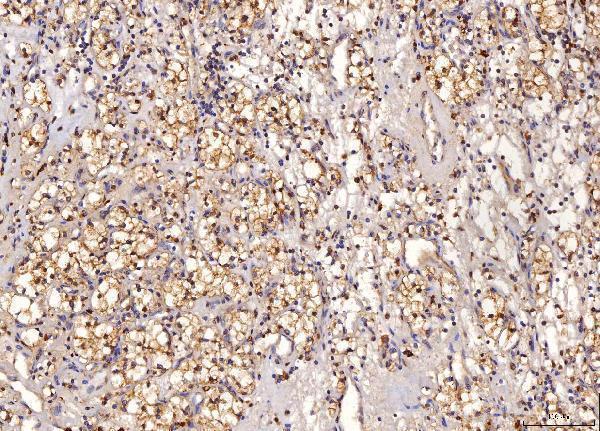
M07851-1 has IHC images from paraffin sections of human liver cancer, renal clear cell carcinoma, and kidney tumor tissue, and rat kidney (M07851-1 IHC captions). A07851-1 has IHC images from paraffin sections of human liver and rectal cancer tissue and an IF image from A431 cells (A07851-1 IHC and IF captions).
Which to pick: For paraffin-section IHC, both SKUs have images using EDTA retrieval at pH 8.0 and 2 μg/ml primary antibody; the fixative is unreported for both (M07851-1 and A07851-1 IHC captions). Choose A07851-1 for IF/ICC because those applications are listed and its IF image shows staining in A431 cells at 5 μg/ml (A07851-1 catalog applications and IF caption). For cross-species planning, A07851-1 lists human, monkey, mouse, and rat reactivity, while monoclonal M07851-1 lists human, mouse, and rat; the IHC images document human tissue for A07851-1 and human and rat tissue for M07851-1 (catalog reactivity and IHC captions).