This website uses cookies to ensure you get the best experience on our website.


- Table of Contents
Real validated SOX1 Western blot protocols, expected-band and isoform facts, troubleshooting for weak or shifted signal, and recommended anti-SOX1 WB antibodies. Everything you need to plan the experiment before you commit precious samples.
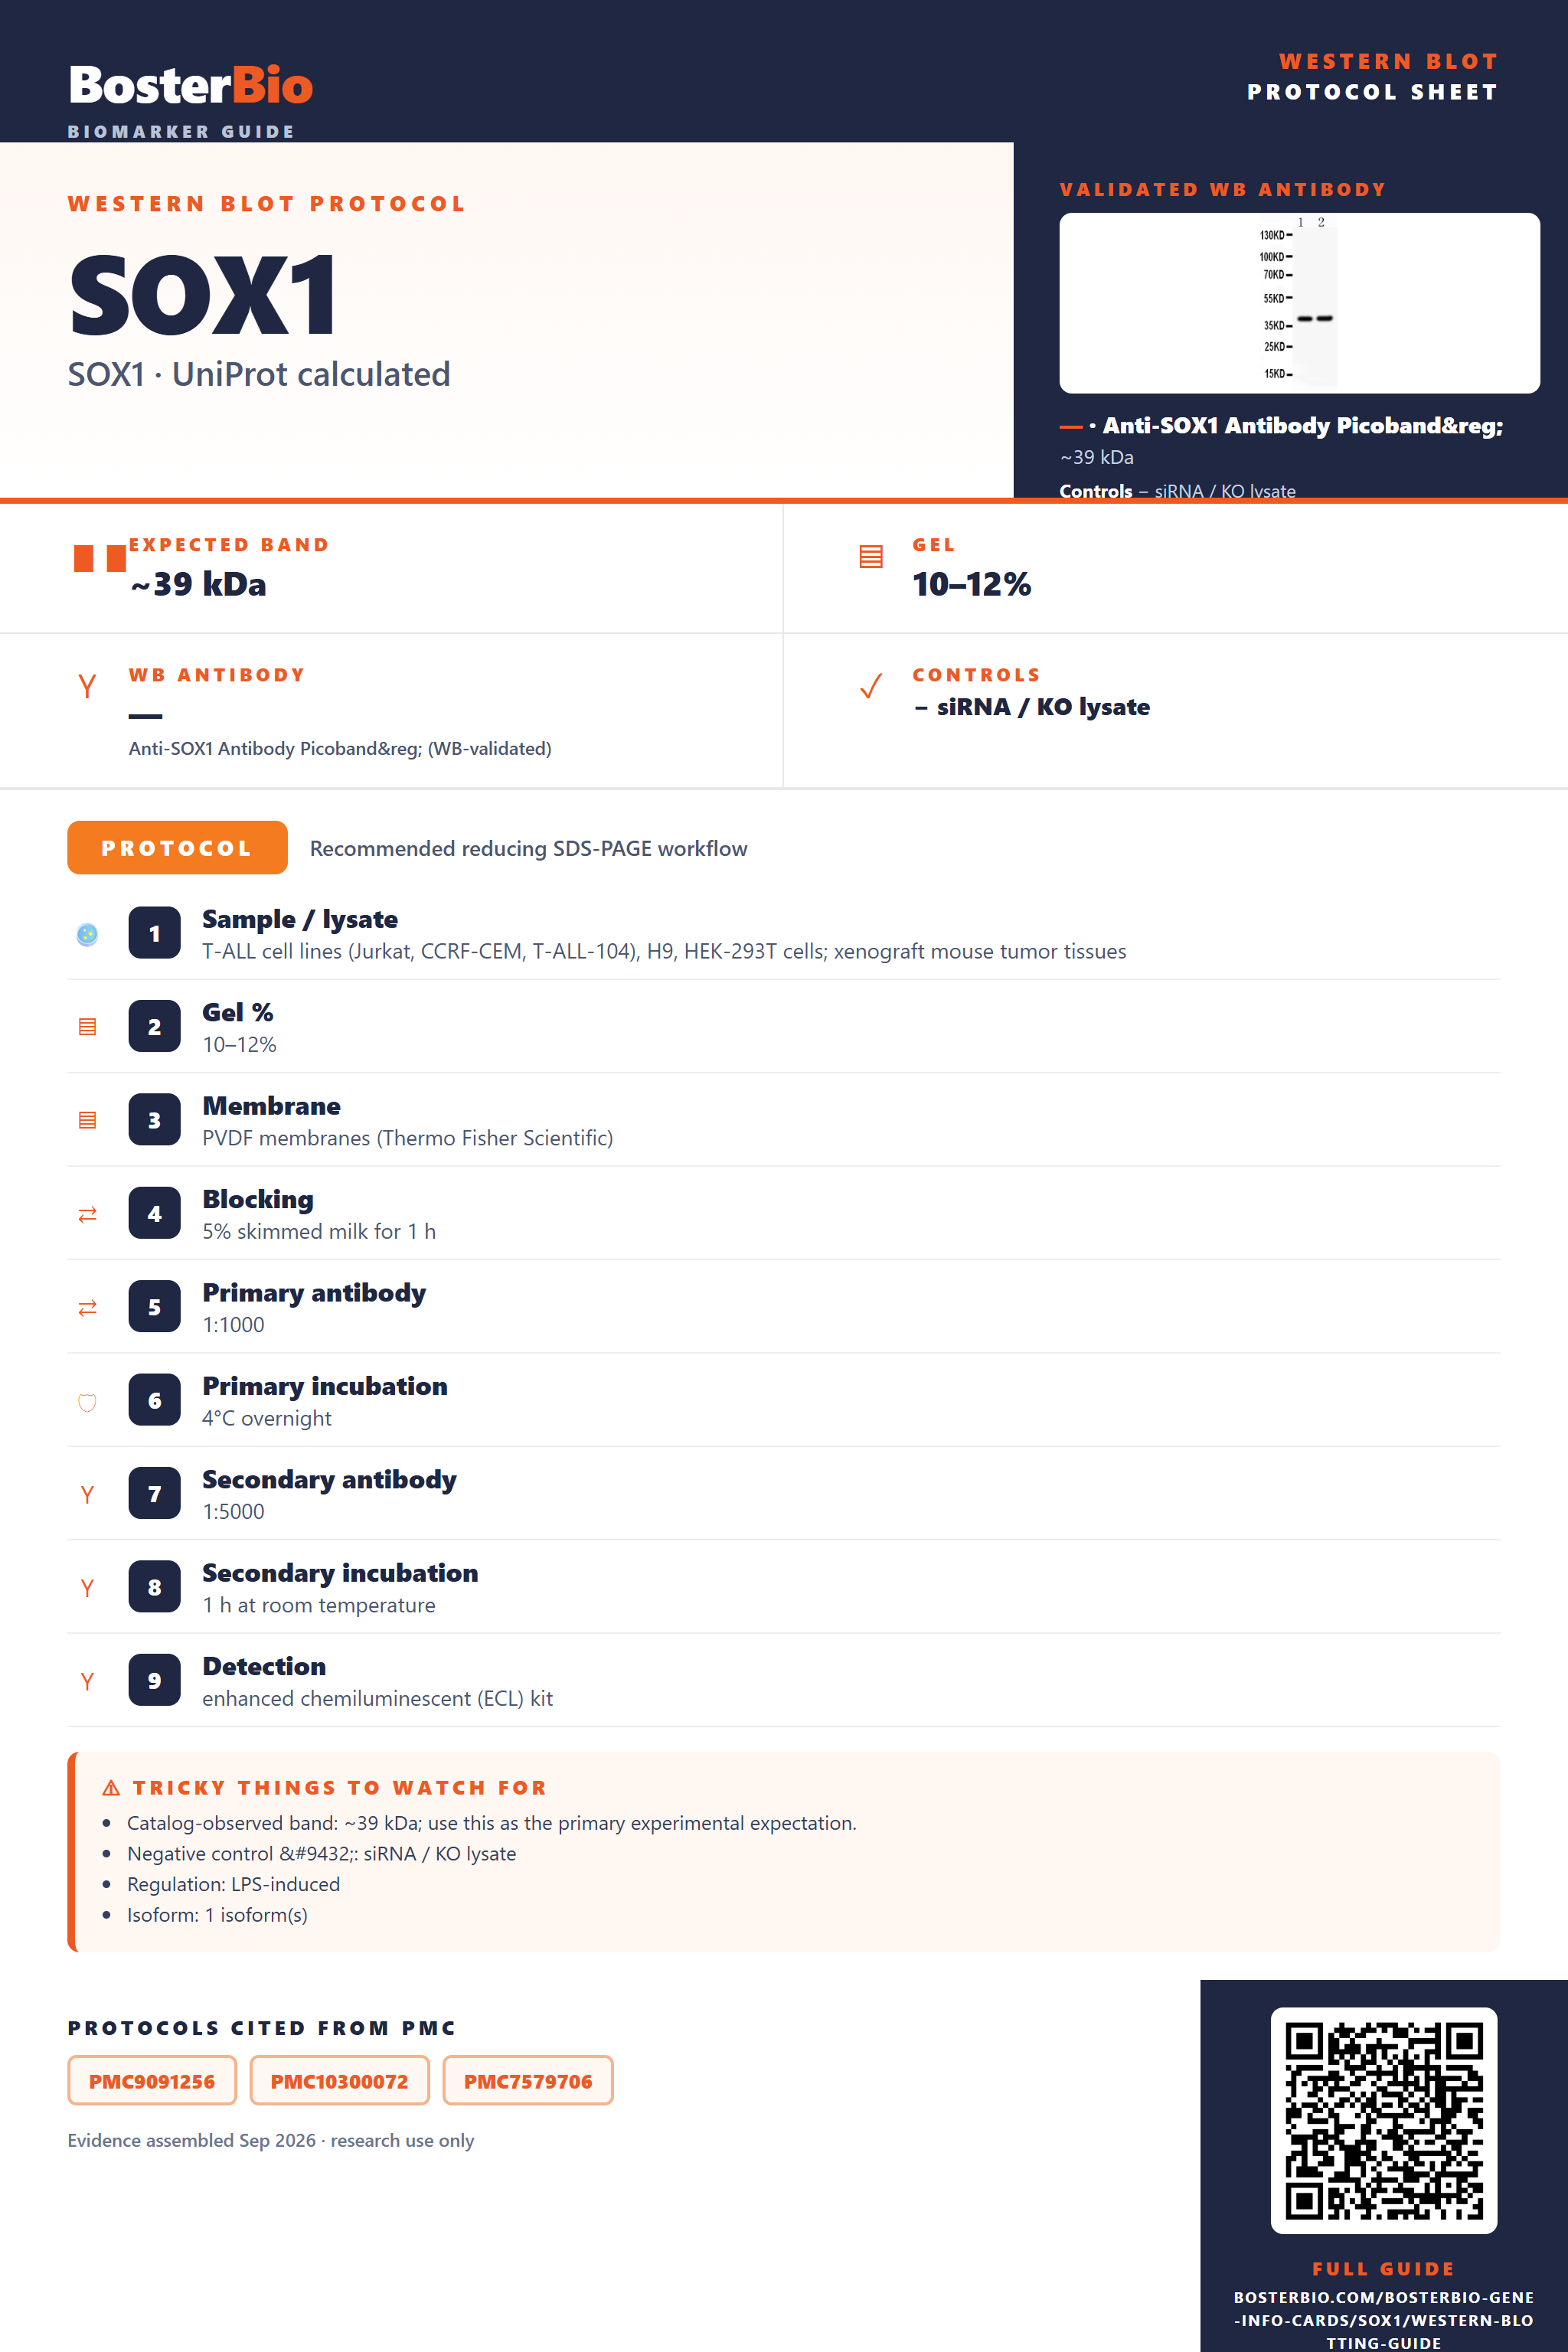
Expected bands, validated protocols, controls and antibodies — the at-a-glance facts below, then the full design guide.
| Expected band | ~39 kDa | |
| Observed band | 39 kDa | |
| Gel | 10–12% | |
| Negative control | siRNA / KO lysate |
| PTM | — | |
| Caveat | — | |
| Regulation | LPS-induced | |
| Isoform | 1 isoform(s) |
Literature-validated Western blot parameters for SOX1 — gel percentage, transfer, blocking, antibody incubation and detection, extracted from published methods.
| Sample / lysate | T-ALL cell lines (Jurkat, CCRF-CEM, T-ALL-104), H9, HEK-293T cells; xenograft mouse tumor tissues |
| Gel % | 10–12% |
| Membrane | PVDF membranes (Thermo Fisher Scientific) |
| Blocking | 5% skimmed milk for 1 h |
| Primary antibody | 1:1000 |
| Primary incubation | 4°C overnight |
| Secondary antibody | 1:5000 |
| Secondary incubation | 1 h at room temperature |
| Detection | enhanced chemiluminescent (ECL) kit |
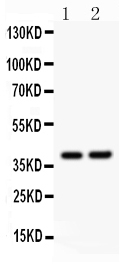
SOX1 has a 39 kDa predicted mass and runs true to size at an observed 39 kDa band, since it lacks glycosylation, disulfide bonds, cleavage sites, or splice isoforms.
| single sharp band at ~39 kDa | predicted mass has no glycosylation, disulfide, or cleavage modifiers, so SOX1 runs true to its calculated size |
| no additional bands or doublets | only one annotated isoform exists, so no alternative-splicing bands are expected |
| band position unchanged with or without reducing agent | no disulfide bonds or oligomerization are annotated, so there is no dimer band to collapse upon reduction |
| band size unchanged after glycosidase treatment | no glycosylation sites are annotated, so deglycosylation has no effect on migration |
| signal weak or absent unless nuclear lysis is thorough | SOX1 is a nuclear protein, so incomplete nuclear extraction can undercapture it in whole-cell lysate |
| predicted molecular weight (39 kDa, 391 aa) | sets the baseline band position, and the empirically observed 39 kDa band matches this closely |
| absence of glycosylation sites | prevents any upward smear or shift above the calculated mass |
| absence of disulfide bonds / no oligomerization | keeps the band as a stable monomer with no ~78 kDa dimer band under non-reducing conditions |
| single annotated isoform | limits the blot to one expected band rather than multiple isoform-driven bands |
| nuclear subcellular localization | requires efficient nuclear lysis to release full signal; weak nuclear extraction lowers apparent band intensity |
| Situation | Likely cause | Next action |
|---|---|---|
| No band in lysate | nuclear membrane not adequately disrupted, leaving SOX1 in an insoluble nuclear pellet | use a nuclear extraction or RIPA buffer with sonication and confirm nuclear fraction is loaded |
| Weak or no signal | SOX1 expression is tissue-restricted (neural progenitor and lens tissue), so unrelated cell lines show little endogenous protein | load a known-positive tissue such as fetal brain lysate and increase total protein loaded |
| Multiple bands | antibody cross-reactivity with other SOXB1-family members sharing a similar HMG DNA-binding domain | confirm specificity with a SOX1 knockdown or knockout lysate control |
| Band higher than expected | residual chromatin or DNA bound to the nuclear protein was not fully sheared before loading | treat lysate with benzonase or sonicate thoroughly before boiling in sample buffer |
| Band lower than expected | proteolytic degradation of the protein during nuclear lysate preparation | include protease inhibitors and keep samples cold throughout extraction |
Comprehensive Human Protein Atlas IHC scoring per tissue. Rows are taken directly from the HPA tissue chart — click any row's HPA link to view the source.
| Tissue | Cell type | Level | Evidence | Source |
|---|
| Tissue | Cell type | Level | Evidence | Source |
|---|
Deeper troubleshooting and optimisation questions for SOX1, answered from its protein features.
BosterBio's SOX1 antibodies are among the best-performing WB antibodies on the market — well cited, thoroughly validated, and orthogonally cross-validated against negative tissues and complementary methods.
Our recommended anti-SOX1 Western blot antibody is best-performing, extensively cited, and thoroughly validated, with cross-validation across multiple tissue and cell lysates confirming specific, reproducible detection of the ~39 kDa SOX1 band.
Which to pick: Only one anti-SOX1 antibody, PB9403, is currently listed; it includes an actual WB validation image detecting SOX1 at the predicted ~39 kDa size in rat brain tissue and NIH3T3 cell lysates, making it the clear default choice.