SSR1 / Translocon-associated protein subunit alpha · IHC design guide

Design Immunohistochemistry for SSR1

Plan SSR1 chromogenic IHC in paraffin sections using the expected cytoplasmic tissue pattern (HPA tissue IHC). This guide covers fixation consistency, ER membrane localization (UniProt), and the catalog antibody’s 2–5 μg/mL IHC range (datasheet A06993-1).

Evidence assembled Oct 2026 · For research use; verify linked source records and product datasheet before use
Immunohistochemistry protocol sheet for SSR1 (IHC for SSR1): expected localisation Cytoplasmic tissue staining (HPA tissue IHC); ER membrane protein (UniProt), antibody A06993-1, validated IHC image, and IHC protocol steps
Printable SSR1 IHC protocol sheet — expected localisation Cytoplasmic tissue staining (HPA tissue IHC); ER membrane protein (UniProt), antibody A06993-1, controls and protocol steps. Open the full SSR1 IHC guide →

SSR1 Immunohistochemistry Experimental Design Guide

Expected localisation, validated protocols, controls and antibodies — the at-a-glance facts below, then the full design guide.

Must know before staining
Expected localisation Cytoplasmic tissue staining (HPA tissue IHC); ER membrane protein (UniProt)
Staining pattern Cytoplasmic in most tissues; glandular cells can stain highly (HPA tissue IHC)
Antigen retrieval EDTA pH 8.0 HIER, heat-mediated (datasheet A06993-1)
Positive control ⓘ Epididymis+4 more · see all
Negative control ⓘ Bone marrow+4 more · see all
Important caveats
Reasons your staining may differ from the expected pattern.
Fixation Keep fixation consistent across sections. (standard IHC practice; not target-specific)
Caveat Staining and RNA expression have medium consistency (HPA tissue IHC)
Regulation Staining intensity regulators are unreported (UniProt)
Isoform / epitope 2 isoforms; luminal versus cytoplasmic epitope coverage is unknown (UniProt)
Section 1

Recommended SSR1 IHC & IF Protocols

The catalog antibody’s IHC-P protocol (datasheet: A06993-1) is accompanied by a published protocol using spinal surgery specimens (PMC10782074).

Recommended immunohistochemistry (IHC-P) protocol parameters
SampleParaffin-embedded human liver cancer tissue; fixative not specified (datasheet A06993-1)
FixationImage fixative and duration unreported (datasheet A06993-1); verify before use.
Sectioning4–5 µm sections on charged slides (standard)
DeparaffinisationXylene, graded ethanol series to water (standard)
Antigen retrievalHeat retrieval: EDTA pH 8.0 (datasheet A06993-1); 20 min, 95–100 °C (standard)
Peroxidase block3% H2O2, 10 min, room temperature (standard)
Blocking10% goat serum (datasheet A06993-1)
Primary antibodyRabbit anti-SSR1, 2-5μg/ml (datasheet A06993-1)
Primary incubationOvernight at 4 °C (datasheet A06993-1)
DetectionStreptavidin-biotin complex (SABC), DAB chromogen (datasheet A06993-1)
CounterstainHematoxylin, blue, dehydrate and mount (standard)
Expected resultSSR1-positive staining in glandular cells of epididymis (HPA tissue IHC: High). HPA tissue profile: Cytoplasmic expression in most tissues. No signal in the no-primary control.
💡Decision noteStart with heat-mediated EDTA pH 8.0 retrieval (datasheet: A06993-1); the published protocol used citrate or Tris-EDTA pH 9 (PMC10782074).
Section 2

What Is the Expected SSR1 Staining Pattern?

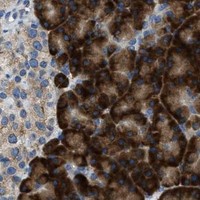
SSR1 is an endoplasmic reticulum (ER) membrane protein with one transmembrane segment at residues 208–228 (UniProt P43307 topology). In paraffin-section IHC, expect predominantly cytoplasmic staining in many tissues, especially glandular cells of the epididymis, salivary gland and stomach (HPA: cytoplasmic expression in most tissues; High in those glandular cells). HPA rates tissue IHC reliability Enhanced, with medium consistency between antibody staining and RNA expression (HPA: reliability description).

What am I looking at on my slide?
Glandular cells stain cytoplasmically in epididymis, salivary gland or stomach.This matches the strongest listed tissue IHC examples (HPA: High in glandular cells of all three). Score the cell population and cytoplasmic compartment together; an intense deposit elsewhere does not establish the expected SSR1 pattern (HPA: cytoplasmic expression in most tissues).
Staining appears mainly nuclear, extracellular or confined to cell borders.Those compartments conflict with the expected cytoplasmic IHC profile and ER membrane location (HPA: tissue IHC profile; UniProt P43307: ER membrane). Check the matched controls and detection background before calling such staining specific (general IHC practice).
Strong staining appears in bone-marrow hematopoietic cells or esophageal squamous cells.HPA reports SSR1 as Not detected in those cell populations (HPA: bone marrow; esophagus). Treat a strong result there as a specificity or endogenous-detection question, then compare controls; an HPA Not detected call is not proof that every specimen must be negative.
Broad chromogen haze obscures cell boundaries, including in expected low-signal areas.The slide cannot support reliable cell-level scoring while background dominates (general IHC practice). Compare a no-primary control and assess blocking, washing and detection conditions before attributing the haze to SSR1; HPA's cytoplasmic profile does not explain uniform slide-wide color (HPA: tissue IHC profile).
No cytoplasmic signal appears in an expected positive glandular population.A negative run is hard to interpret if its positive reference also fails (general IHC practice). Recheck section integrity, antibody and detection performance, and the chosen retrieval conditions; the expected reference pattern is High in epididymis, salivary gland and stomach glandular cells (HPA: tissue IHC).
💡Expected SSR1 appearanceCall a result consistent with SSR1 when glandular cells show clear cytoplasmic staining, potentially High in epididymis, salivary gland or stomach; isolated nuclear or extracellular color is a warning sign (HPA: tissue IHC profile and High examples; UniProt P43307: ER membrane).
How each factor affects the staining
Compartment and topologySSR1 spans the ER membrane at residues 208–228, with a lumenal region at 19–207 and cytoplasmic region at 229–286 (UniProt P43307 topology). Epitope-side access depends on the antibody's actual binding site and preparation; neither is specified here.
Tissue and cell populationHPA reports Low tissue specificity at the RNA level, while IHC intensity varies by cell population (HPA: RNA specificity; tissue IHC). Compare like cells: glandular cells are High in three listed tissues, but parathyroid glandular cells are Low (HPA: tissue IHC).
Antibody evidenceTwo listed rabbit polyclonals, HPA011276 and HPA017062, have Enhanced IHC validation (HPA: antibody validation). Tissue IHC has medium antibody-staining/RNA consistency (HPA: reliability description); use localization and appropriate controls when judging an unexpected result.
Isoforms and modificationsUniProt lists two isoforms and glycosylation sites at residues 136 and 191 (UniProt P43307: isoforms; glycosylation). Antibody coverage and any effect on IHC staining are unspecified; do not infer that a weak tissue result reflects either feature.
Retrieval choiceAntigen retrieval is a general paraffin-section IHC variable (general IHC practice). No SSR1-specific retrieval condition or fixation-sensitivity result is supplied; record the condition used and judge it against a positive reference and controls.
Why is my staining missing, weak or wrong?
SituationLikely causeNext action
Expected positive tissue has no signal.The reference may have failed because of section, antibody, retrieval or detection performance (general IHC practice).Check run controls and section quality, then assess the recorded retrieval and detection settings. Use a glandular population reported High as the reference (HPA: epididymis, salivary gland or stomach).
Signal is mostly nuclear or extracellular.That distribution conflicts with cytoplasmic tissue staining and ER localization (HPA: tissue IHC profile; UniProt P43307: ER membrane).Compare the no-primary control and inspect whether the color tracks cells or background (general IHC practice). Withhold an SSR1-positive call until cytoplasmic staining is resolved.
A nominally negative cell population stains strongly.Cross-reactivity or endogenous detection activity is possible (general IHC practice); HPA reports bone-marrow hematopoietic and esophageal squamous cells as Not detected (HPA: tissue IHC).Check no-primary and detection controls, then compare a known positive population in the same run (general IHC practice). Treat the HPA negative examples as comparators, not absolute exclusions.
Weak cytoplasmic color appears in a low-expression comparator.Some populations have Low reported staining, including parathyroid glandular cells and lung macrophages (HPA: tissue IHC).Score intensity by cell type and compare the run's High glandular reference (HPA: tissue IHC). Avoid interpreting weak color alone as assay failure or strong target expression.
Diffuse color prevents cell-level interpretation.Background from the staining workflow can obscure the expected pattern (general IHC practice; HPA: cytoplasmic tissue IHC profile).Review no-primary background, blocking, washing and detection controls, then repeat scoring only when cell boundaries and cytoplasmic signal are distinguishable (general IHC practice).
IF/ICC question: Does an ER-like signal fit SSR1?HPA supports ER localization in ICC-IF images from U-251MG and U2OS cells (HPA: subcellular ICC-IF); UniProt places SSR1 in the ER membrane (UniProt P43307: subcellular location).Yes. Assess whether the signal follows an ER-like intracellular distribution and whether controls support it (HPA: subcellular ICC-IF; general IF practice). Apply the separate IF/ICC guide for assay setup.

Sample controls for SSR1 IHC & IF

🧪Run salivary gland first and look for staining in glandular cells (HPA: High in salivary gland glandular cells). Use skeletal muscle as the negative tissue (HPA: Not detected in myocytes); on the positive slide, use non-glandular cells as an internal background reference rather than assuming they lack SSR1, because the supplied HPA row scores glandular cells only.
Positive control tissue: Epididymis (Glandular cells, HPA High)
Negative control tissue: Bone marrow (HPA Not detected)
ICC-IF cell lines (HPA subcellular resource): HPA ICC-IF images show SSR1 in U-251MG, U2OS, with annotated localisation: Endoplasmic reticulum (supported) (HPA subcellular).
Technical controls: Include a no-primary (secondary-only) slide, an isotype control matched to the rabbit primary antibody’s host and clonality, and a biological negative such as SSR1 knockout tissue or peptide competition if the immunizing peptide is available (selected-SKU caption: rabbit primary). For chromogenic detection, block endogenous peroxidase and check endogenous biotin background when using the caption’s streptavidin–biotin detection system (selected-SKU caption: SABC with DAB).
⚠️Feasibility: A target-specific fixation window or fixation effect is unreported, and the selected-SKU paraffin-section caption does not state the fixative (selected-SKU caption: fixative not stated). The caption uses heat retrieval in EDTA at pH 8.0, but does not establish whether retrieval is required; neither frozen sections nor IF is established as easier by the supplied evidence (selected-SKU caption: EDTA retrieval; HPA: ICC-IF images). In salivary gland, assess cellular staining separately from luminal material or background, and compare any IF signal with the expected ER pattern (HPA: High in salivary gland glandular cells; HPA: supported ER localization).

HPA tissue IHC evidence for SSR1

Comprehensive Human Protein Atlas IHC scoring per tissue (reliability: Enhanced — Medium consistency between antibody staining and RNA expression data.). Rows are taken directly from the HPA tissue chart — click any row's HPA link to view the source.

Positive expression · recommended positive controls

TissueCell typeLevelEvidenceSource
Epididymis Glandular cells High Protein (IHC) HPA →
Salivary gland Glandular cells High Protein (IHC) HPA →
Stomach Glandular cells High Protein (IHC) HPA →
Adrenal gland Glandular cells Medium Protein (IHC) HPA →
Breast Glandular cells Medium Protein (IHC) HPA →

Undetected expression · recommended negative controls

TissueCell typeLevelEvidenceSource
Bone marrow Hematopoietic cells Not detected Protein (IHC) HPA →
Esophagus Squamous epithelial cells Not detected Protein (IHC) HPA →
Oral mucosa Squamous epithelial cells Not detected Protein (IHC) HPA →
Ovary Ovarian stroma cells Not detected Protein (IHC) HPA →
Skeletal muscle Myocytes Not detected Protein (IHC) HPA →
Section 3

Advanced SSR1 IHC Tips

Troubleshoot SSR1 staining by checking retrieval, compartment, cell type and detection controls before comparing chromogenic signal across sections.

How should I adjust retrieval when SSR1 staining is weak in paraffin sections?
Start with heat-mediated antigen retrieval in EDTA at pH 8.0 for paraffin sections (datasheet A06993-1). The selected tissue image used this retrieval before incubation with 2 μg/ml of the IHC-validated antibody overnight at 4°C (datasheet A06993-1). Compare an adjacent section processed with the same retrieval and antibody concentration so that a change in staining can be attributed to retrieval rather than primary-antibody exposure (standard IHC practice). If staining remains weak, test a different retrieval condition on matched sections as a fallback, while checking whether stronger signal preserves the expected cytoplasmic pattern (HPA: cytoplasmic expression in most tissues; standard IHC practice).
Could fixation be causing weak or uneven SSR1 staining?
SSR1-specific sensitivity to fixation is unknown from the supplied evidence; the selected paraffin-section caption does not state a fixative (datasheet A06993-1). Record the fixative, fixation duration and section-processing history for each specimen before comparing staining intensity (standard IHC practice). If weak staining tracks with a processing batch, stain matched control sections together using EDTA retrieval at pH 8.0 and the same antibody incubation (datasheet A06993-1; standard IHC practice). Avoid attributing a fixation effect to SSR1’s membrane topology or glycosylation sites, because those annotations establish protein features rather than fixation sensitivity (UniProt P43307 topology and glycosylation; standard IHC practice).
What staining pattern is plausible for SSR1 in chromogenic IHC?
Expect predominantly cytoplasmic staining in tissue sections, consistent with SSR1’s endoplasmic-reticulum membrane location (HPA: cytoplasmic expression in most tissues; UniProt P43307 subcellular location). At cellular resolution, assess whether the signal occupies cytoplasm around the nucleus rather than nuclei alone (HPA: endoplasmic reticulum supported; standard IHC interpretation). SSR1 has a membrane-spanning segment at residues 208–228, with lumenal residues 19–207 and cytoplasmic residues 229–286 (UniProt P43307 topology). A diffuse chromogenic deposit need not reveal individual ER membranes, so compare its cell distribution with a positive control and inspect a no-primary control before assigning localisation (standard IHC practice).
How could isoforms or epitope position affect SSR1 IHC interpretation?
SSR1 has 2 annotated isoforms, but the supplied antibody evidence does not identify an epitope or establish isoform-specific detection (UniProt P43307 isoforms; datasheet A06993-1). Its lumenal region spans residues 19–207, the transmembrane segment spans 208–228, and the cytoplasmic region spans 229–286 (UniProt P43307 topology). Glycosylation sites at 136 and 191, plus reported phosphorylation in the cytoplasmic region, make epitope position worth checking if an epitope map becomes available (UniProt P43307 glycosylation and modified residues). Until then, treat differing IHC intensities as staining differences rather than evidence for a particular isoform or modification (standard IHC interpretation).
How can IF help check an ambiguous SSR1 IHC pattern?
Use IF as a complementary localisation check: SSR1 is supported at the endoplasmic reticulum in cell imaging (HPA: endoplasmic reticulum supported). For multiplexing, pair SSR1 with a validated marker of the expected glandular cell population and assess whether both signals occur in the same cells (HPA: high staining in epididymis, salivary gland and stomach glandular cells; standard IF practice). Choose fluorophores after measuring tissue autofluorescence in unstained controls, favouring channels with clearer separation from that background (standard IF practice). Permeabilisation must permit access to the antibody’s epitope side of the ER membrane; its side is unresolved for this antibody, although SSR1’s lumenal and cytoplasmic regions are annotated (UniProt P43307 topology; datasheet A06993-1).
What should I check when SSR1 DAB staining is widespread?
Compare the stained section with no-primary and detection-only controls to identify signal from the detection system (standard IHC practice). The selected image used 10% goat-serum blocking, a biotinylated secondary, a streptavidin–biotin complex and DAB, so each detection step merits a control when background is high (datasheet A06993-1; standard IHC practice). Include a peroxidase block and examine whether residual colour follows endogenous enzyme activity; this is a general chromogenic IHC check, not SSR1-specific evidence (standard IHC practice). Reassess background against the expected cytoplasmic distribution and cells with reported low or undetected staining, rather than calling uniform deposit positive (HPA: cytoplasmic expression and tissue IHC profile; standard IHC interpretation).
How should I quantify SSR1 staining across tissue sections? ⚠ ANSWER MARKED FOR VERIFICATION
Define the cell population and analysis area before scoring, then report the percentage of cytoplasm-positive cells and an intensity-weighted H-score (standard IHC practice; HPA: cytoplasmic expression in most tissues). For regions with uneven cellularity, report positive cells per mm² as an additional measure and exclude folds, necrosis and tissue edges by a prespecified rule (standard IHC practice). Normalise counts to eligible cells or intact tissue area, and compare sections processed in the same staining run with the same imaging settings (standard IHC practice). Keep glandular-cell scores separate from other cell populations because HPA reports cell-specific differences, including high staining in several glandular populations (HPA: tissue IHC profile).
How can I distinguish true SSR1 staining from artefact?
A credible result places signal in cytoplasm consistent with an ER membrane protein and in a cell population expected to express SSR1 (HPA: cytoplasmic expression in most tissues; UniProt P43307 subcellular location). High staining in glandular cells of epididymis, salivary gland or stomach can support a positive control, while HPA reports undetected staining in esophageal squamous epithelial cells (HPA: tissue IHC profile). Treat isolated nuclear signal, strong tissue-edge staining or colour confined to necrotic areas as suspect until controls resolve it (standard IHC interpretation). Check no-primary and peroxidase-block controls for detection artefact, and remember that HPA rates agreement between staining and RNA data as medium (standard IHC practice; HPA: Enhanced reliability description).
Boster reagents

Best SSR1 / Translocon-associated protein subunit alpha IHC Antibodies

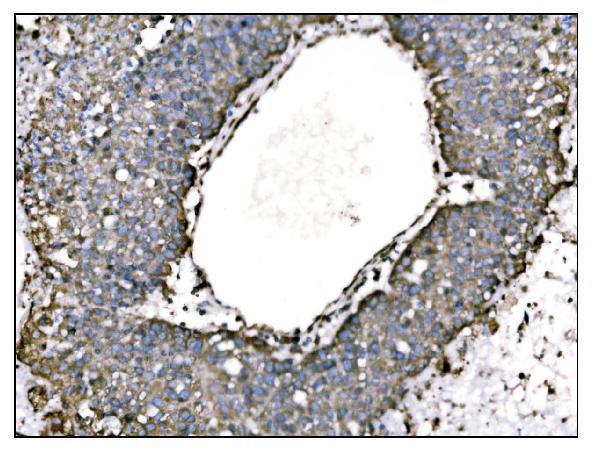
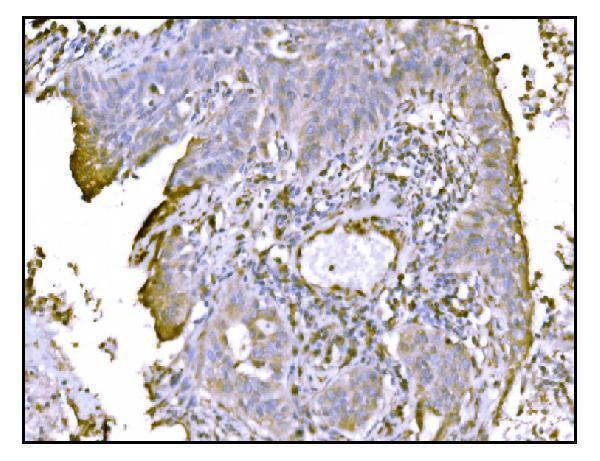
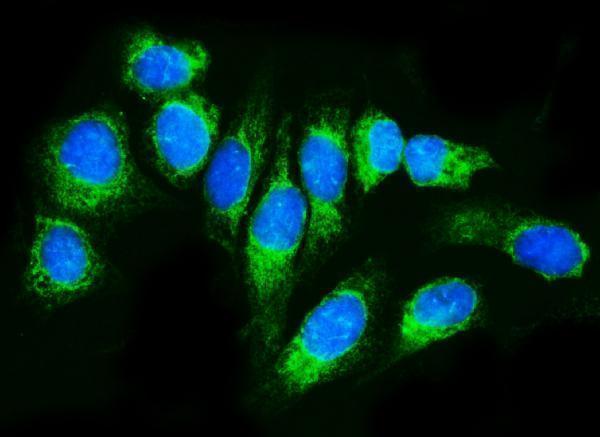
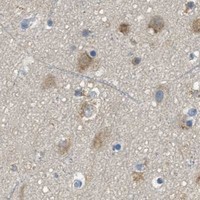
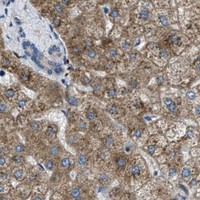
Catalog antibody A06993-1 has IHC images from human liver cancer, lung cancer and placenta sections and mouse brain sections, plus an IF image from U20S cells (catalog image captions).

Real IHC data IHC analysis of TRAP Alpha/TRAPA/SSR1 using anti-TRAP Alpha/TRAPA/SSR1 antibody (A06993-1). TRAP Alpha/TRAPA/SSR1 was detected in a paraffin-embedded section of human liver cancer tissue. Heat mediated antigen retrieval was performed in EDTA buffer (pH 8.0, epitope retrieval solution). The tissue section was blocked with 10% goat serum. The tissue section was then incubated with 2 μg/ml rabbit anti-TRAP Alpha/TRAPA/SSR1 Antibody (A06993-1) overnight at 4°C. Biotinylated goat anti-rabbit IgG was used as secondary antibody and incubated for 30 minutes at 37°C. The tissue section was developed using Strepavidin-Biotin-Complex (SABC) (Catalog # SA1022) with DAB as the chromogen.
Anti-TRAP alpha/TRAPA/SSR1 Antibody ®
Cat # A06993-1

A06993-1 will render with its own IHC figure from a paraffin-embedded human liver cancer section (A06993-1 IHC caption). Its other IHC captions show human lung cancer and placenta and mouse brain sections; its IF caption shows U20S cells (A06993-1 image captions).

Which to pick: Choose A06993-1 for paraffin-section IHC: its IHC caption documents 2 μg/ml after heat retrieval in EDTA at pH 8.0; the fixative is unreported (A06993-1 IHC caption). For IF/ICC, the same SKU has an IF image from U20S cells at 5 μg/ml (A06993-1 IF caption). For cross-species work, the catalog lists human, mouse, rat and monkey reactivity, while its IHC dilution guidance covers human, mouse and rat; clonality is unreported (A06993-1 catalog payload).

Each figure is that product's own IHC / IF validation image from its datasheet.

References

  1. UniProt Consortium. UniProt entry P43307 (SSRA_HUMAN, Translocon-associated protein subunit alpha).
  2. Human Protein Atlas. SSR1 tissue IHC expression (reliability: Enhanced).
  3. Human Protein Atlas. SSR1 subcellular location (ICC-IF): Localized to the endoplasmic reticulum..
  4. Human Protein Atlas. SSR1 antibody validation summary (2 antibodies).
  5. Epidermal growth factor receptor intron 1 polymorphism and microsatellite instability in sporadic colorectal cancer. Oncology letters 2021 — PMC7798105.
  6. Exploring SSR1 as a novel diagnostic and prognostic biomarker in hepatocellular carcinoma, and its relationship with immune infiltration. Translational cancer research 2024 — PMC11543030.
  7. SSR1 and CKAP4 as potential biomarkers for intervertebral disc degeneration based on integrated bioinformatics analysis. JOR spine 2024 — PMC10782074.
  8. Clinical Value for Diagnosis and Prognosis of Signal Sequence Receptor 1 (SSR1) and Its Potential Mechanism in Hepatocellular Carcinoma: A Comprehensive Study Based on High-Throughput Data Analysis. International journal of general medicine 2021 — PMC8566009.
  9. PubMed PMID:8050590 — UniProt-cited evidence.
  10. PubMed PMID:10437777 — UniProt-cited evidence.
  11. PubMed PMID:14702039 — UniProt-cited evidence.