This website uses cookies to ensure you get the best experience on our website.


- Table of Contents
Real validated TGFB1 Western blot protocols, expected-band and isoform facts, troubleshooting for weak or shifted signal, and recommended anti-TGFB1 WB antibodies. Everything you need to plan the experiment before you commit precious samples.
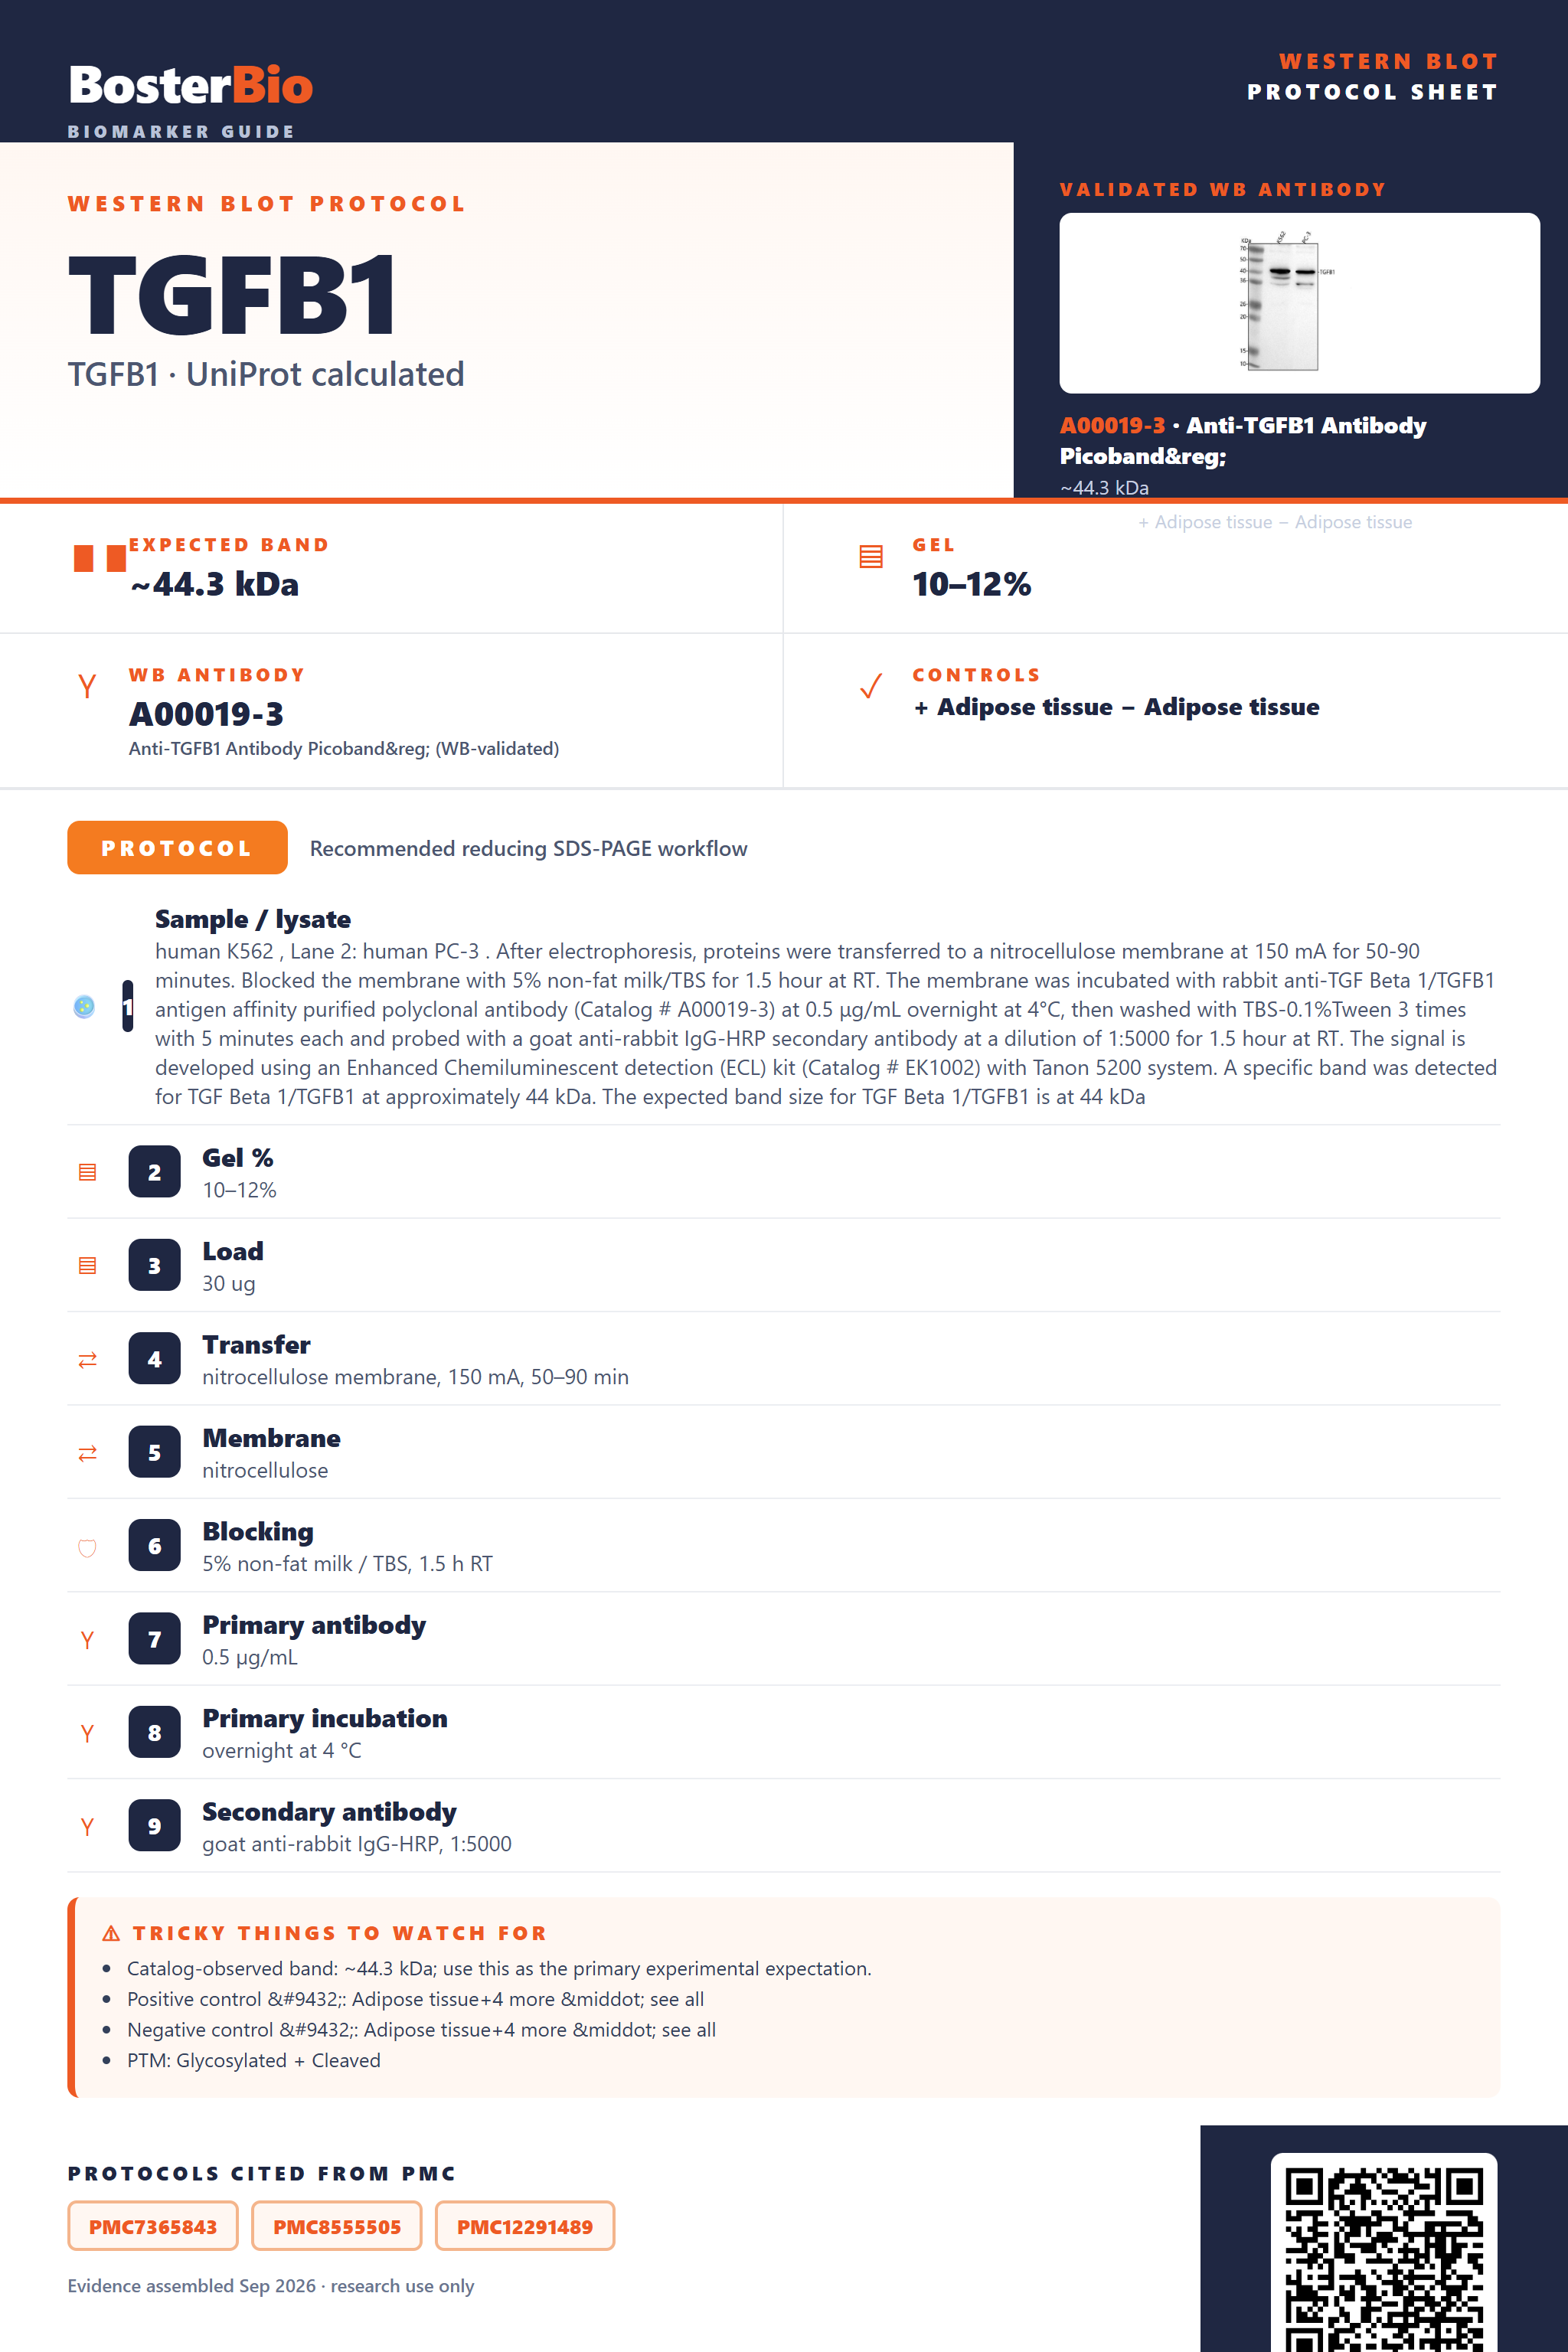
Expected bands, validated protocols, controls and antibodies — the at-a-glance facts below, then the full design guide.
| Expected band | ~44.3 kDa | |
| Observed band | ~44 kDa | |
| Gel | 10–12% | |
| Positive control | Adipose tissue+4 more · see all | |
| Negative control | Adipose tissue+4 more · see all |
| PTM | Glycosylated + Cleaved | |
| Caveat | N-glycosylation alters mobility | |
| Regulation | IL-6 up | |
| Isoform | 1 isoform(s) |
Literature-validated Western blot parameters for TGFB1 — gel percentage, transfer, blocking, antibody incubation and detection, extracted from published methods.
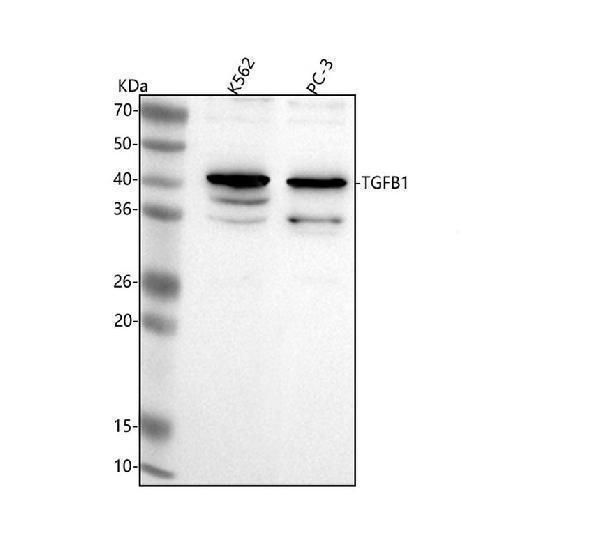
| Sample / lysate | human K562 , Lane 2: human PC-3 . After electrophoresis, proteins were transferred to a nitrocellulose membrane at 150 mA for 50-90 minutes. Blocked the membrane with 5% non-fat milk/TBS for 1.5 hour at RT. The membrane was incubated with rabbit anti-TGF Beta 1/TGFB1 antigen affinity purified polyclonal antibody (Catalog # A00019-3) at 0.5 μg/mL overnight at 4°C, then washed with TBS-0.1%Tween 3 times with 5 minutes each and probed with a goat anti-rabbit IgG-HRP secondary antibody at a dilution of 1:5000 for 1.5 hour at RT. The signal is developed using an Enhanced Chemiluminescent detection (ECL) kit (Catalog # EK1002) with Tanon 5200 system. A specific band was detected for TGF Beta 1/TGFB1 at approximately 44 kDa. The expected band size for TGF Beta 1/TGFB1 is at 44 kDa |
| Gel % | 10–12% |
| Load | 30 ug |
| Transfer | nitrocellulose membrane, 150 mA, 50–90 min |
| Membrane | nitrocellulose |
| Blocking | 5% non-fat milk / TBS, 1.5 h RT |
| Primary antibody | 0.5 µg/mL |
| Primary incubation | overnight at 4 °C |
| Secondary antibody | goat anti-rabbit IgG-HRP, 1:5000 |
| Wash | TBS-0.1% Tween, 3 × 5 min |
| Detection | ECL |
| Exposure / imaging | Tanon 5200 |
| Observed band | 44 kDa |
TGFB1's 44.3 kDa calculated mass matches its ~44 kDa observed band, with glycosylation and disulfide-linked homodimerization as the main sources of any size shift.
| Single band near 44 kDa under reducing conditions | matches the calculated mass of the TGFB1 precursor monomer |
| Band smeared or running slightly higher than 44 kDa | reflects heterogeneous N-linked glycosylation at Asn82, Asn136, and Asn176 |
| Band near double the monomer size (~88 kDa) under non-reducing conditions | represents the disulfide-linked TGFB1 homodimer that fails to dissociate without a reducing agent |
| Smaller band below 44 kDa | corresponds to the processed chain after signal-peptide cleavage removes the N-terminal 29 residues from the precursor |
| Little or no band in standard whole-cell lysate | TGFB1/LAP is secreted into the extracellular space and matrix rather than retained intracellularly |
| Predicted precursor mass (44.3 kDa) | sets the baseline reducing-gel position, closely matching the ~44 kDa band actually observed |
| N-glycosylation at Asn82, Asn136, and Asn176 | adds carbohydrate mass and heterogeneity that can broaden or slightly raise the band above the unmodified backbone mass |
| Disulfide-linked homodimer formation | shifts the band to roughly twice the monomer mass if reduction is incomplete or omitted |
| Signal peptide cleavage (residues 1-29) | removes several kDa from the precursor, so the processed chain runs somewhat below the 44.3 kDa full-length mass |
| Secretion to extracellular space and matrix | means intracellular lysate fractions may show weak or absent signal unless conditioned media or ECM extracts are probed |
| Situation | Likely cause | Next action |
|---|---|---|
| No band in lysate | TGFB1/LAP is secreted into the extracellular space and matrix rather than retained in the cell | probe conditioned media or ECM-enriched extracts in addition to standard whole-cell lysate |
| Band higher than expected | the disulfide-linked homodimer has not fully dissociated | add fresh reducing agent and heat the sample longer before loading to resolve the ~44 kDa monomer |
| Band lower than expected | signal peptide cleavage or further downstream processing has removed N-terminal residues from the precursor | confirm the antibody epitope location relative to the cleavage site and compare against a full-length precursor control |
| Broad smear instead of sharp band | heterogeneous N-linked glycosylation at Asn82, Asn136, and Asn176 produces a range of glycoform masses | run a PNGase F deglycosylation control to collapse the smear toward the unmodified backbone mass |
| Multiple bands | unreduced disulfide-linked dimer and fully reduced monomer coexist in the same sample | run reduced and non-reduced lanes side by side to assign the ~44 kDa and dimer bands correctly |
| Weak or no signal | secreted TGFB1 is diluted within a large lysate or media volume | concentrate conditioned media or increase the amount of total protein loaded per lane |
Comprehensive Human Protein Atlas IHC scoring per tissue. Rows are taken directly from the HPA tissue chart — click any row's HPA link to view the source.
| Tissue | Cell type | Level | Evidence | Source |
|---|---|---|---|---|
| Adipose tissue | adipocytes | Not detected | Protein (IHC) | HPA → |
| Adrenal gland | glandular cells | Not detected | Protein (IHC) | HPA → |
| Appendix | glandular cells | Not detected | Protein (IHC) | HPA → |
| Bone marrow | hematopoietic cells | Not detected | Protein (IHC) | HPA → |
| Breast | adipocytes | Not detected | Protein (IHC) | HPA → |
| Tissue | Cell type | Level | Evidence | Source |
|---|---|---|---|---|
| Adipose tissue | adipocytes | Not detected | Protein (IHC) | HPA → |
| Adrenal gland | glandular cells | Not detected | Protein (IHC) | HPA → |
| Appendix | glandular cells | Not detected | Protein (IHC) | HPA → |
| Bone marrow | hematopoietic cells | Not detected | Protein (IHC) | HPA → |
| Breast | adipocytes | Not detected | Protein (IHC) | HPA → |
Deeper troubleshooting and optimisation questions for TGFB1, answered from its protein features.
BosterBio's TGFB1 antibodies are among the best-performing WB antibodies on the market — well cited, thoroughly validated, and orthogonally cross-validated against negative tissues and complementary methods.
Our recommended anti-TGFB1 antibody is a best-performing, widely cited reagent whose specificity has been thoroughly validated by orthogonal methods, including comparison against negative tissue controls and complementary detection techniques, ensuring confident, reproducible Western blot results for TGFB1 detection.
Which to pick: Only one Boster anti-TGFB1 antibody is catalogued here, A00019-3, which includes an actual Western blot validation image, so it's the clear choice for TGFB1 detection in your samples.