This website uses cookies to ensure you get the best experience on our website.


- Table of Contents
Plan TNFRSF12A IHC in paraffin sections using placental trophoblasts as a high-staining reference (HPA tissue IHC). Assess cytoplasmic and membranous staining by cell type and intensity, bearing in mind its low consistency with RNA expression (HPA tissue IHC).

Expected localisation, validated protocols, controls and antibodies — the at-a-glance facts below, then the full design guide.
| Expected localisation | Cytoplasmic and membranous tissue staining (HPA tissue IHC) | |
| Staining pattern | Placental trophoblasts stain strongly; cytoplasmic and membranous (HPA tissue IHC) | |
| Antigen retrieval | Citrate pH 6.0 HIER, 95–98 °C, 20 min (rule: cytoplasmic / membrane antigen) | |
| Positive control | Placenta+4 more · see all | |
| Negative control | Adipose tissue+4 more · see all |
| Fixation | Matched tissue-IHC evidence does not establish the fixation claim. Validate the specimen-specific method before use. (selected-SKU IHC image A06261) | |
| Caveat | Antibody staining shows low consistency with RNA expression (HPA tissue IHC) | |
| Regulation | Expression varies across tissues (UniProt) | |
| Isoform / epitope | 2 isoforms; check extracellular vs cytoplasmic epitopes (UniProt) |
The catalog antibody’s IHC-P protocol is accompanied by published protocols for mouse gastrocnemius muscle (PMC11790590) and human tissue sections (PMC11810735).
| Sample | Tissue sections; selected-image fixative not specified (standard IHC workflow) |
| Fixation | Image fixative and duration unreported (datasheet A06261); verify before use. |
| Sectioning | 4–5 µm sections on charged slides (standard) |
| Deparaffinisation | Xylene, graded ethanol series to water (standard) |
| Antigen retrieval | Heat-induced epitope retrieval in citrate buffer, pH 6.0, 20 min at 95–98 °C (standard rule: cytoplasmic / membrane antigen) |
| Peroxidase block | 3% H2O2, 10 min, room temperature (standard) |
| Blocking | 10% normal serum of the secondary host, 30 min, room temperature (standard) |
| Primary antibody | Rabbit anti-TNFRSF12A, 1:100–1:500 starting range (standard) |
| Primary incubation | Overnight at 4 °C (standard) |
| Detection | HRP-polymer secondary, DAB chromogen 5–10 min (standard) |
| Counterstain | Hematoxylin, blue, dehydrate and mount (standard) |
| Expected result | TNFRSF12A-positive staining in trophoblastic cells of placenta (HPA tissue IHC: High). HPA tissue profile: Cytoplasmic and membranous expression in most tissues. No signal in the no-primary control. |
TNFRSF12A is a membrane receptor with an extracellular segment at residues 28–80 and a transmembrane segment at 81–101 (UniProt Q9NP84 topology). In tissue sections, expect membranous and cytoplasmic staining, especially strong staining in placental trophoblastic cells (HPA: tissue IHC). Interpret intensity cautiously: the HPA tissue profile is Approved but has low consistency between antibody staining and RNA expression (HPA: reliability description).
| Placental trophoblastic cells show strong membranous staining with some cytoplasmic signal. | This fits the strongest listed cell-level result: trophoblastic cells are High in placenta (HPA: tissue IHC). Cytoplasmic and membranous staining also fits the reported tissue profile (HPA: tissue IHC). |
| Signal is predominantly nuclear, with little discernible membrane or cytoplasmic staining. | A nuclear-only pattern is unsupported by the membrane topology (UniProt Q9NP84 topology) and by HPA's cytoplasmic and membranous tissue profile (HPA: tissue IHC). Check controls and staining conditions before interpreting it as TNFRSF12A. |
| Strong staining appears in colon glandular cells or soft-tissue fibroblasts. | Both cell populations are listed as Not detected (HPA: tissue IHC). Consider cross-reactivity or endogenous chromogenic activity, then compare the staining with a negative-primary control (general IHC practice). |
| Color is widespread across the section without clear cell boundaries. | This is difficult to score as a membranous or cytoplasmic pattern (HPA: tissue IHC). Diffuse staining can reflect nonspecific detection or background; inspect the negative-primary control and tissue morphology (general IHC practice). |
| Placental trophoblastic cells have no detectable signal. | A negative result conflicts with their High HPA staining level (HPA: tissue IHC), but does not alone establish absent protein. First assess tissue preservation, the positive control and the IHC detection run (general IHC practice). |
| Which compartment should guide scoring? | TNFRSF12A spans the membrane at residues 81–101 (UniProt Q9NP84 topology). HPA reports cytoplasmic and membranous tissue staining, so assess both patterns in the named cells (HPA: tissue IHC). |
| Which tissues best frame intensity? | Placental trophoblastic cells are High; adrenal glandular, bronchial respiratory epithelial and marrow hematopoietic cells are Medium (HPA: tissue IHC). These are cell-specific observations, not a uniform whole-tissue score. |
| How strong is the validation? | HPA lists antibody HPA007853 as Approved for IHC, while its tissue profile notes low staining–RNA consistency (HPA: antibodies; HPA: reliability description). Approved should not be described as Enhanced. |
| Does processing explain a missing compartment? | UniProt annotates removal of the 1–27 signal peptide and a 28–129 chain (UniProt Q9NP84 processing). The supplied record gives no antibody epitope, so it cannot establish which region is detected. |
| Can isoforms or retrieval predict intensity? | Two isoforms are listed (UniProt Q9NP84 isoforms). Their tissue staining and recognition by this antibody are unspecified; no target-specific antigen-retrieval or fixation effect is established by these sources. |
| IF/ICC Q&A: where should signal appear? | Plasma membrane and cytosol are Approved locations in HPA ICC-IF (HPA: subcellular). Use that localisation to interpret IF/ICC images; the staining guidance here concerns chromogenic IHC in paraffin sections. |
| Situation | Likely cause | Next action |
|---|---|---|
| Placenta is negative or much weaker than expected (HPA: High in trophoblastic cells). | The control may lack evaluable trophoblastic cells, or the IHC run may have failed (general IHC practice). HPA intensity alone cannot identify the cause. | Confirm the cell population on the counterstained section; review the positive control, negative-primary control, detection reagents and run records (general IHC practice). |
| Strong signal appears in colon glandular cells (HPA: Not detected). | Cross-reactivity or endogenous chromogenic activity is possible (general IHC practice); the HPA profile has low staining–RNA consistency (HPA: reliability description). | Compare a negative-primary control and tissue morphology; assess whether the signal follows cells, edges or background before assigning cell-level positivity (general IHC practice). |
| Signal is mainly nuclear (HPA: cytoplasmic and membranous tissue profile). | The compartment disagrees with the annotated membrane receptor topology (UniProt Q9NP84 topology). Nonspecific staining or scoring error is possible (general IHC practice). | Recheck the compartment against the counterstain and negative-primary control; score membrane and cytoplasm separately from nuclei (general IHC practice). |
| The entire section has diffuse chromogenic color. | Excess background can obscure cell-level localisation (general IHC practice); HPA's reported pattern requires readable cytoplasmic and membranous staining (HPA: tissue IHC). | Inspect the negative-primary control and detection background; review blocking, washing and detection conditions within the established IHC workflow (general IHC practice). |
| Adipocytes stain strongly in adipose tissue or breast. | Adipocytes are Not detected in both listed tissues (HPA: tissue IHC). Apparent signal may reflect background or mistaken assignment to adjacent cells (general IHC practice). | Identify the stained cell type on the counterstain, compare the negative-primary control and avoid scoring color outside adipocyte boundaries as adipocyte staining (general IHC practice). |
| Placenta is positive, but lung alveolar cells are faint. | This may match the observed range: trophoblastic cells are High and alveolar cells are Low (HPA: tissue IHC). The difference alone does not establish a technical failure. | Score the named cell populations separately and compare them with their own HPA levels; document unexpected compartments or background alongside intensity (HPA: tissue IHC; general IHC practice). |


Comprehensive Human Protein Atlas IHC scoring per tissue (reliability: Approved — Low consistency between antibody staining and RNA expression data.). Rows are taken directly from the HPA tissue chart — click any row's HPA link to view the source.
| Tissue | Cell type | Level | Evidence | Source |
|---|---|---|---|---|
| Placenta | Trophoblastic cells | High | Protein (IHC) | HPA → |
| Adrenal gland | Glandular cells | Medium | Protein (IHC) | HPA → |
| Appendix | Glandular cells | Medium | Protein (IHC) | HPA → |
| Bone marrow | Hematopoietic cells | Medium | Protein (IHC) | HPA → |
| Bronchus | Respiratory epithelial cells | Medium | Protein (IHC) | HPA → |
| Tissue | Cell type | Level | Evidence | Source |
|---|---|---|---|---|
| Adipose tissue | Adipocytes | Not detected | Protein (IHC) | HPA → |
| Breast | Adipocytes | Not detected | Protein (IHC) | HPA → |
| Colon | Glandular cells | Not detected | Protein (IHC) | HPA → |
| Duodenum | Glandular cells | Not detected | Protein (IHC) | HPA → |
| Small intestine | Glandular cells | Not detected | Protein (IHC) | HPA → |
Troubleshoot TNFRSF12A staining in paraffin sections by checking retrieval, compartment, cell identity and controls before comparing signal across samples.
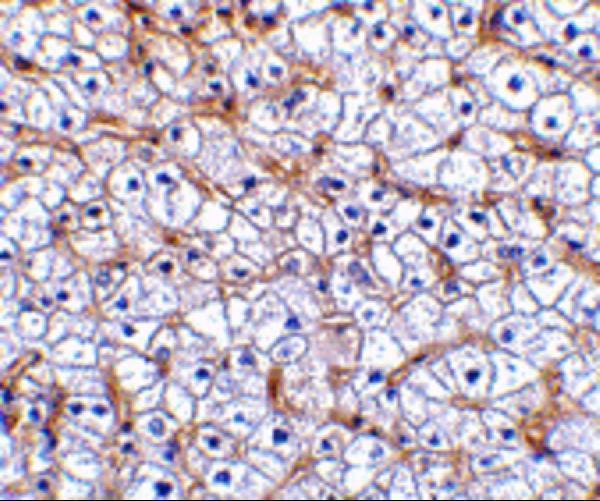
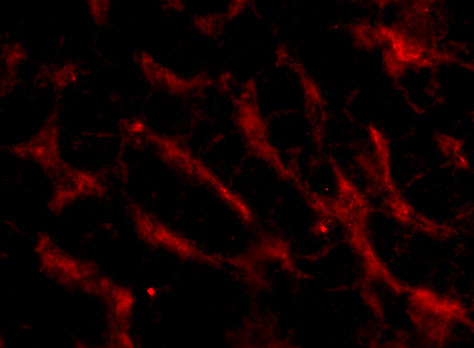
A06261 has human liver tissue IHC and human liver cell IF images (catalog image captions). M06261 lists IHC reactivity for human, mouse and rat (catalog applications/reactivity).
The rendered SKU is A06261, listed for human IHC-P and IF (catalog applications/reactivity). Its images show IHC in human liver tissue at 2.5 μg/mL and IF in human liver cells at 20 μg/mL (A06261 image captions).
Which to pick: Choose A06261 for human paraffin-section IHC: IHC-P is listed, and its own image shows staining in human liver tissue; the fixative is unreported (A06261 applications/IHC image caption). For IF, choose A06261 based on its human liver cell image; ICC preparation is unspecified (A06261 IF image caption). For mouse or rat IHC, M06261 lists those species and IHC and is rabbit monoclonal, but has no IHC image or listed IF application (M06261 catalog reactivity/applications/clone/image alts).