This website uses cookies to ensure you get the best experience on our website.


- Table of Contents
Real validated TNFRSF25 Western blot protocols, expected-band and isoform facts, troubleshooting for weak or shifted signal, and recommended anti-TNFRSF25 WB antibodies. Everything you need to plan the experiment before you commit precious samples.
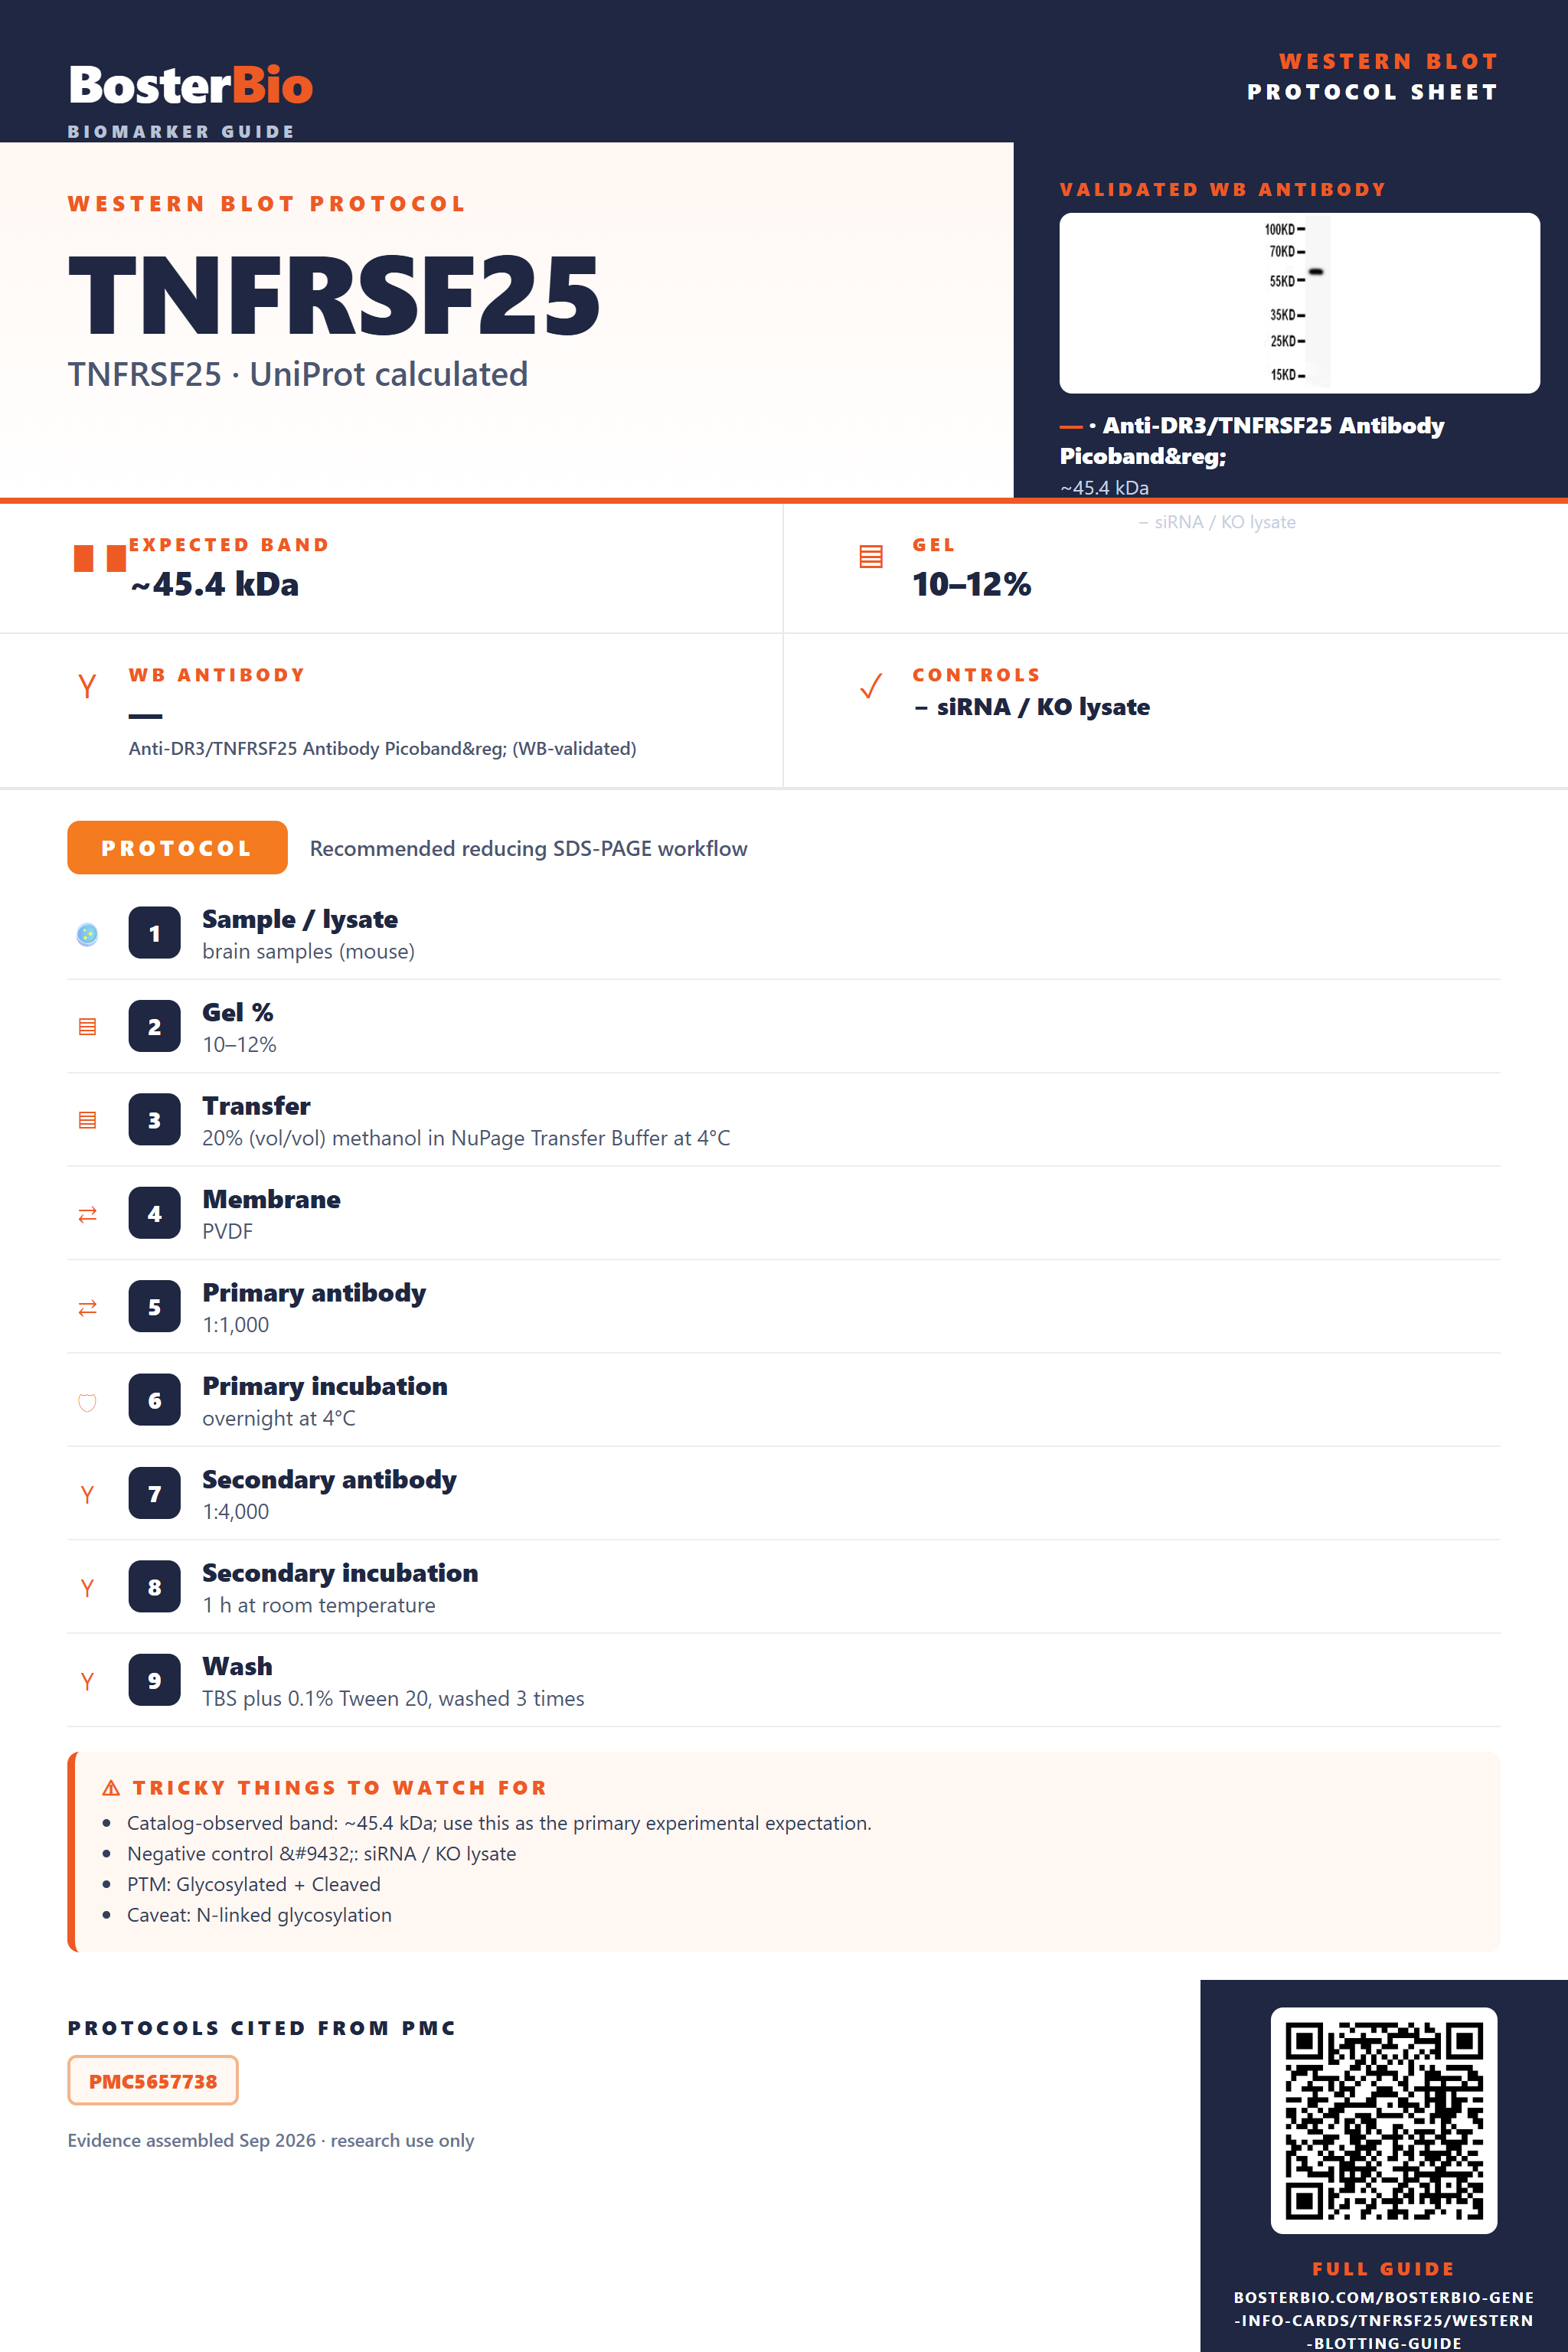
Expected bands, validated protocols, controls and antibodies — the at-a-glance facts below, then the full design guide.
| Expected band | ~45.4 kDa | |
| Observed band | 59 kDa | |
| Gel | 10–12% | |
| Negative control | siRNA / KO lysate |
| PTM | Glycosylated + Cleaved | |
| Caveat | N-linked glycosylation | |
| Regulation | IFN-γ-induced | |
| Isoform | 12 isoform(s) |
Literature-validated Western blot parameters for TNFRSF25 — gel percentage, transfer, blocking, antibody incubation and detection, extracted from published methods.
| Sample / lysate | brain samples (mouse) |
| Gel % | 10–12% |
| Transfer | 20% (vol/vol) methanol in NuPage Transfer Buffer at 4°C |
| Membrane | PVDF |
| Primary antibody | 1:1,000 |
| Primary incubation | overnight at 4°C |
| Secondary antibody | 1:4,000 |
| Secondary incubation | 1 h at room temperature |
| Wash | TBS plus 0.1% Tween 20, washed 3 times |
| Detection | enhanced chemiluminescence (ECL) detection system |
TNFRSF25 has a 45.4 kDa predicted backbone but runs at about 59 kDa on Western blot because N-glycosylation at Asn67/Asn106 outweighs the mass lost to signal peptide cleavage.
| single band near 59 kDa | mature, N-glycosylated full-length TNFRSF25 monomer — the mass added by glycosylation outweighs the small loss from signal peptide cleavage |
| diffuse or smeared band spanning roughly 55-65 kDa | heterogeneous glycan occupancy at Asn67 and Asn106 produces a mixture of glycoforms rather than one discrete mass |
| faint lower band around 42-43 kDa | underglycosylated or immature species close to the signal-peptide-cleaved core protein before full carbohydrate addition |
| extra bands at sizes other than the main ~59 kDa species | distinct alternatively spliced isoforms (12 annotated) contributing differently sized species |
| higher band near roughly double the monomer mass under non-reducing or incompletely denaturing conditions | residual homodimer, formed through death-domain interactions rather than a disulfide bridge, not fully dissociated by the run conditions |
| Predicted mass (UniProt, 417 aa precursor) | sets the 45.4 kDa baseline; the actual band typically runs higher once glycan mass is added |
| N-glycosylation at Asn67 and Asn106 | adds carbohydrate mass and heterogeneity, lifting the mature band up toward the observed ~59 kDa and potentially broadening it |
| Signal peptide cleavage (residues 1-24) | removes a small N-terminal mass from the precursor before the mature protein is glycosylated, partially offsetting the glycan-driven increase |
| Homodimer formation (death domain-mediated) | can produce a higher-molecular-weight species near double the monomer size if the non-covalent dimer is not fully broken by denaturation, even though it is not disulfide-linked |
| Alternative splice isoforms (12 annotated: 1-12) | differing exon content across isoforms can shift apparent migration or introduce additional bands beyond the main species |
| Situation | Likely cause | Next action |
|---|---|---|
| Band higher than expected | incomplete reduction or denaturation leaves the non-covalent death-domain-mediated homodimer partly intact | boil samples longer in fresh reducing sample buffer with DTT or beta-mercaptoethanol and confirm resolution on a fully denaturing gel |
| Band lower than expected | a non-glycosylated bacterial recombinant standard or a truncated isoform lacking full extracellular domains is being compared to native protein | compare against a mammalian-expressed lysate control migrating near the 59 kDa native band and confirm isoform identity |
| Broad smear instead of sharp band | heterogeneous N-glycosylation at Asn67 and Asn106 generates a mixture of glycoforms | treat lysate with PNGase F to collapse the smear toward the deglycosylated core mass or use a gradient gel for better resolution |
| Multiple bands | detection of different alternatively spliced isoforms or a mix of monomer and residual homodimer species | verify with an isoform-mapped antibody and confirm which band aligns with the ~59 kDa expected monomer |
| Weak or no signal | low native expression of this single-pass membrane receptor in the sample, or epitope masking by dense glycosylation | enrich the membrane fraction, increase protein loading, or include a deglycosylation step to expose the epitope |
| Fragments below expected size | proteolytic release of ectodomain fragments during lysis or sample handling | add protease inhibitors at lysis and keep samples cold and processed quickly to limit degradation |

Comprehensive Human Protein Atlas IHC scoring per tissue. Rows are taken directly from the HPA tissue chart — click any row's HPA link to view the source.
| Tissue | Cell type | Level | Evidence | Source |
|---|
| Tissue | Cell type | Level | Evidence | Source |
|---|
Deeper troubleshooting and optimisation questions for TNFRSF25, answered from its protein features.
BosterBio's TNFRSF25 antibodies are among the best-performing WB antibodies on the market — well cited, thoroughly validated, and orthogonally cross-validated against negative tissues and complementary methods.
The anti-DR3/TNFRSF25 antibodies below represent Boster's best-performing western blot reagents for this target, extensively cited in the literature and rigorously validated through orthogonal methods, including negative-tissue controls, to ensure specific, reproducible detection.
Which to pick: Only one Boster antibody is listed for TNFRSF25/DR3: PA2004. It includes an actual western blot image (COLO320 whole cell lysate, 0.5ug/ml) showing the expected ~59kD band, so it's the default and only pick—no selection needed.