This website uses cookies to ensure you get the best experience on our website.


- Table of Contents
Plan chromogenic TSC1 IHC in paraffin sections around widespread cytoplasmic staining (HPA tissue IHC) and a primary antibody starting range of 2–5 µg/mL (datasheet A00365-2). Compare matched sections and control background when scoring (standard IHC practice).

Expected localisation, validated protocols, controls and antibodies — the at-a-glance facts below, then the full design guide.
| Expected localisation | Cytoplasmic staining in tissue sections (HPA tissue IHC) | |
| Staining pattern | Widespread cytoplasmic staining across cell types (HPA tissue IHC) | |
| Antigen retrieval | EDTA pH 8.0 HIER, heat-mediated (datasheet A00365-2) | |
| Positive control | Bone marrow+4 more · see all | |
| Negative control | None in HPA (detected in all 45 tissues); use no-primary + isotype controls |
| Fixation | Matched tissue-IHC evidence does not establish the fixation claim. Validate the specimen-specific method before use. (selected-SKU IHC image A00365-2) | |
| Caveat | Endogenous peroxidase may confound bone marrow staining (HPA tissue IHC; standard IHC practice) | |
| Regulation | Nutrients redistribute TSC1 within cells (UniProt) | |
| Isoform / epitope | Two isoforms; antibody epitope coverage is unspecified (UniProt) |
The catalog antibody protocol uses EDTA retrieval (datasheet A00365-2). The published IHC protocols below report conditions for renal carcinoma, paraffin tissue, and bladder tumour samples (PMC7156823; PMC11607531; PMC2427143).
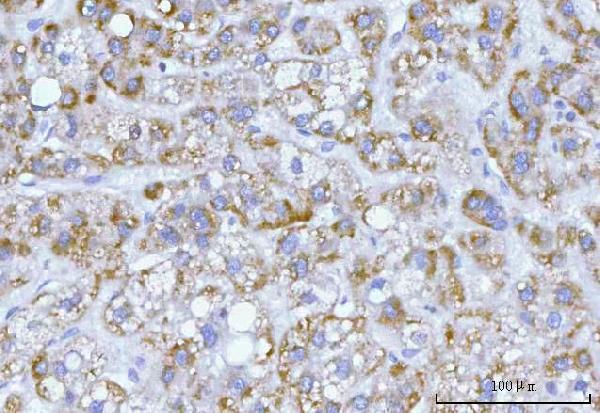
| Sample | Paraffin-embedded human liver cancer tissue; fixative not specified (datasheet A00365-2) |
| Fixation | Image fixative and duration unreported (datasheet A00365-2); verify before use. |
| Sectioning | 4–5 µm sections on charged slides (standard) |
| Deparaffinisation | Xylene, graded ethanol series to water (standard) |
| Antigen retrieval | Heat retrieval: EDTA pH 8.0 (datasheet A00365-2); 20 min, 95–100 °C (standard) |
| Peroxidase block | 3% H2O2, 10 min, room temperature (standard) |
| Blocking | 10% goat serum (datasheet A00365-2) |
| Primary antibody | Rabbit anti-TSC1, 2-5 μg/ml (datasheet A00365-2) |
| Primary incubation | Overnight at 4 °C (datasheet A00365-2) |
| Detection | HRP-conjugated secondary, DAB chromogen (datasheet A00365-2) |
| Counterstain | Hematoxylin, blue, dehydrate and mount (standard) |
| Expected result | TSC1-positive staining in hematopoietic cells of bone marrow (HPA tissue IHC: High). HPA tissue profile: Ubiquitous cytoplasmic expression. No signal in the no-primary control. |
TSC1 should show predominantly cytoplasmic staining across many cell types in paraffin sections (HPA tissue IHC: ubiquitous cytoplasmic expression; reliability Supported, with medium consistency between staining and RNA). Strong examples include skeletal myocytes, cardiomyocytes and placental cytotrophoblasts (HPA tissue IHC: High). A cytosolic pattern is consistent with its lack of a transmembrane segment (UniProt Q92574: cytosol; no transmembrane segment).
| Cytoplasmic staining in skeletal myocytes, cardiomyocytes or placental cytotrophoblasts. | This matches reported high staining in those cells (HPA tissue IHC: High). Compare signal within the relevant cell type; the tissue-wide average may obscure which cells are positive (standard IHC interpretation). |
| Predominantly nuclear or sharply cell-surface staining with little cytoplasmic signal. | This conflicts with the reported cytoplasmic pattern (HPA tissue IHC: ubiquitous cytoplasmic expression) and cytosolic location (UniProt Q92574). Review staining specificity and morphology before scoring it as TSC1 (standard IHC practice). |
| Strong staining confined to adipocytes or soft-tissue fibroblasts while expected positive cells are faint. | HPA reports low staining in those cell types and high staining in several others (HPA tissue IHC: Low in adipocytes and soft-tissue fibroblasts; High in skeletal myocytes). Consider cross-reactivity or endogenous detection activity, then compare controls (standard IHC practice). |
| Broad haze over cells and empty areas, with poorly defined cytoplasm. | A pattern that does not track cell boundaries is difficult to interpret against the reported cytoplasmic distribution (HPA tissue IHC). Check reagent background and detection controls before assigning a TSC1 score (standard IHC practice). |
| No detectable signal in a well-preserved, known-positive cell population. | Absence in cells reported as High, such as cardiomyocytes, makes the run inconclusive without controls (HPA tissue IHC: High in cardiomyocytes). Review the positive control and detection steps; HPA's Supported reliability does not guarantee every section will stain (HPA tissue IHC; standard IHC practice). |
| Cell type and tissue context (HPA tissue IHC) | HPA describes ubiquitous cytoplasmic expression but different levels among cells: High in bone-marrow hematopoietic cells and lung alveolar type I cells, Medium in adrenal glandular cells, and Low in adipocytes (HPA tissue IHC). Interpret intensity by cell population, not tissue name alone (standard IHC practice). |
| Antibody validation (HPA antibody records) | Two listed antibodies, CAB011568 and CAB012481, have Supported IHC status; HPA074132 has no listed IHC status (HPA antibodies). The tissue profile has Supported reliability with medium staining–RNA consistency (HPA tissue IHC). These qualifications limit certainty for an unexpected pattern; they do not validate an unspecified antibody. |
| Cytosol and nutrient-dependent location (UniProt Q92574) | TSC1 is listed in the cytosol and at lysosomal membranes; recruitment to lysosomal membranes occurs without nutrients, with relocalization to cytosol after nutrients return (UniProt Q92574). Routine tissue IHC should therefore be read primarily against the cytoplasmic pattern observed by HPA (HPA tissue IHC), without assuming a visible lysosomal rim. |
| Isoforms and antigen identity (UniProt Q92574) | UniProt lists two TSC1 isoforms and one annotated Hamartin chain spanning residues 1–1164, with no signal peptide or propeptide (UniProt Q92574). No antibody epitope or isoform coverage is supplied, so these entries cannot predict whether a particular IHC reagent detects both isoforms. |
| Detection chemistry (standard chromogenic IHC practice) | Endogenous enzyme activity or nonspecific detection reagents can produce color unrelated to antibody binding (standard chromogenic IHC practice). A suitable negative reagent control helps identify that contribution; it does not establish the identity of otherwise plausible cytoplasmic staining (standard IHC interpretation). |
| Situation | Likely cause | Next action |
|---|---|---|
| High-background section with color outside recognizable cells. | Reagent deposition, inadequate blocking or endogenous detection activity may contribute (standard chromogenic IHC practice). | Inspect a matched negative reagent control and the distribution of color; adjust blocking, washing or detection conditions as indicated by that control (standard IHC practice). |
| No cytoplasmic signal in skeletal myocytes or cardiomyocytes. | These are High cell types in HPA, so an absent signal raises concern about the staining run, antibody performance or specimen quality (HPA tissue IHC; standard IHC interpretation). | Check a same-run positive control, primary antibody use, retrieval conditions and detection reagents before calling the specimen negative (standard IHC practice). |
| Nuclear staining dominates the section. | The compartment conflicts with HPA's ubiquitous cytoplasmic pattern and UniProt's cytosolic annotation (HPA tissue IHC; UniProt Q92574). | Compare the negative reagent control and an HPA High cell population; reassess antibody specificity if the nuclear pattern persists (HPA tissue IHC; standard IHC practice). |
| Strong color appears mainly in adipocytes or soft-tissue fibroblasts. | HPA assigns both cell populations Low staining, so disproportionate signal may reflect nonspecific binding or endogenous activity (HPA tissue IHC; standard IHC practice). | Confirm cell identity and compare negative controls with a reported High cell population in the same run; avoid treating Low as an absolute negative (HPA tissue IHC; standard IHC practice). |
| Patchy cytoplasmic staining makes scoring uncertain. | The HPA profile is ubiquitous but cell levels vary, and its reliability is Supported with medium staining–RNA consistency (HPA tissue IHC). Section quality can also complicate scoring (standard IHC practice). | Score identifiable cell populations separately and compare an appropriate positive control; record patchiness rather than converting it to a tissue-wide absence (standard IHC interpretation). |
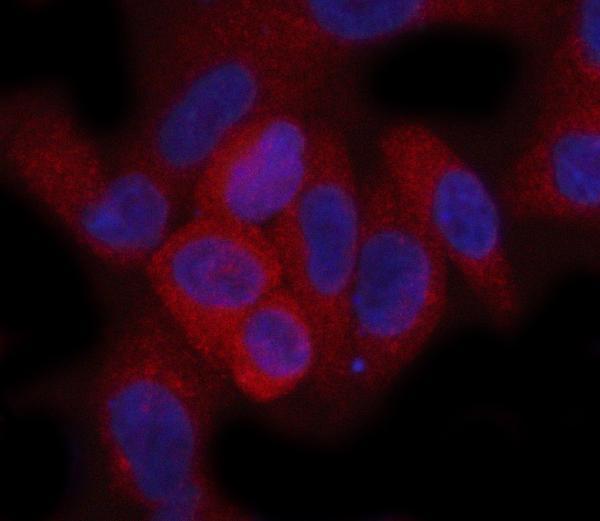
| IF/ICC question: should a matching cell image show only diffuse cytosol? | HPA supports cytosol as the main location; its additional lipid-droplet, cilium-transition-zone and basal-body locations are uncertain (HPA subcellular ICC-IF). | Use cytosol as the primary comparison and treat puncta or those additional locations cautiously; assess them with appropriate imaging controls (HPA subcellular ICC-IF; standard IF practice). |
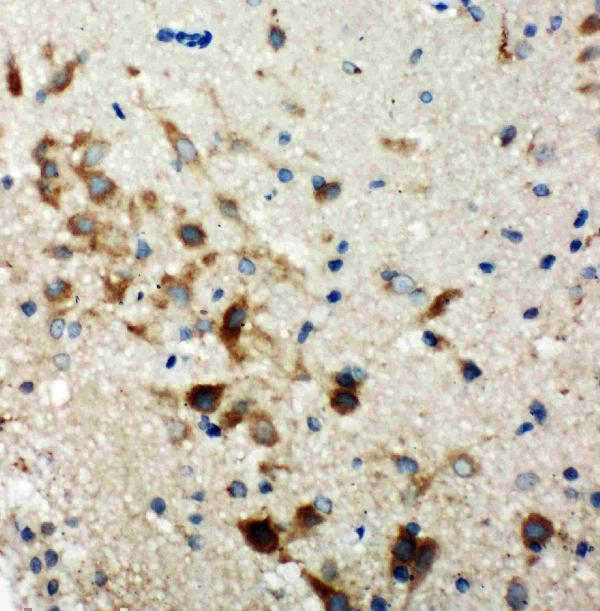
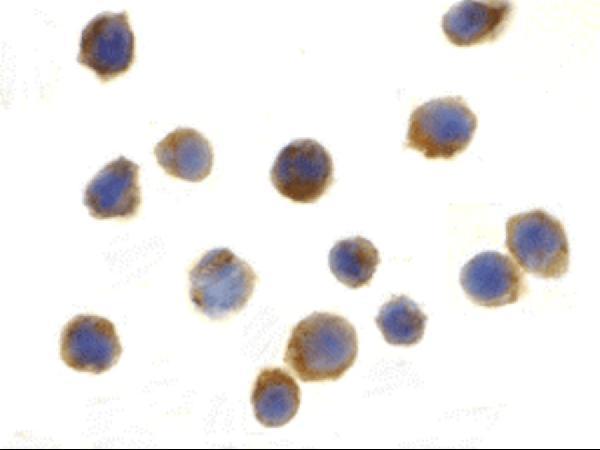
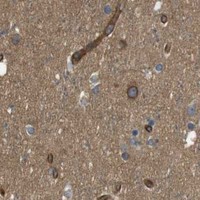


Comprehensive Human Protein Atlas IHC scoring per tissue (reliability: Supported — Medium consistency between antibody staining and RNA expression data.). Rows are taken directly from the HPA tissue chart — click any row's HPA link to view the source.
| Tissue | Cell type | Level | Evidence | Source |
|---|---|---|---|---|
| Bone marrow | Hematopoietic cells | High | Protein (IHC) | HPA → |
| Cerebellum | Cells in molecular layer | High | Protein (IHC) | HPA → |
| Heart muscle | Cardiomyocytes | High | Protein (IHC) | HPA → |
| Lung | Alveolar cells type I | High | Protein (IHC) | HPA → |
| Placenta | Cytotrophoblasts | High | Protein (IHC) | HPA → |
| Tissue | Cell type | Level | Evidence | Source |
|---|---|---|---|---|
| None in HPA: TSC1 is detected in all 45 scored tissues. Use a no-primary (secondary-only) and an isotype control instead. | ||||
Troubleshoot TSC1 chromogenic IHC in paraffin sections by checking retrieval, cell identity and cytoplasmic staining before interpreting signal intensity.
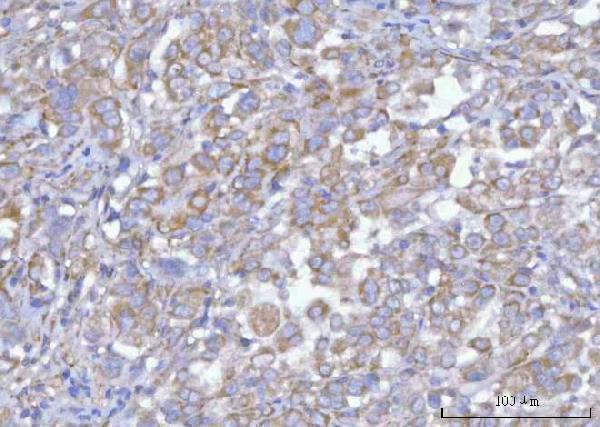
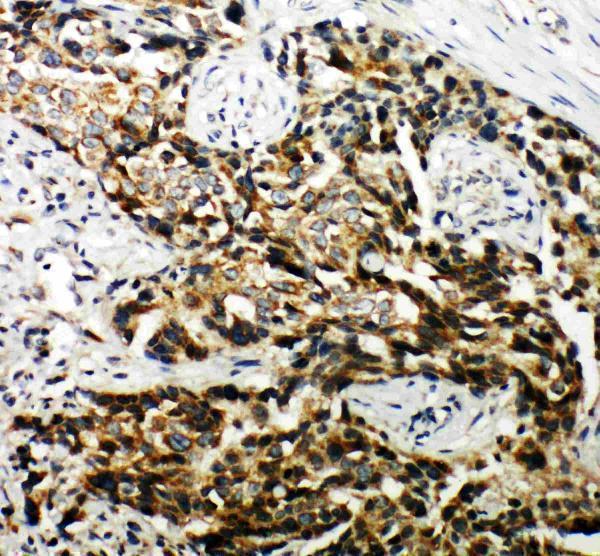
Anti-TSC1 catalog antibodies have IHC images from human paraffin sections and rat brain tissue, plus IF/ICC images from cultured cells (catalog image captions).
A00365-2 has IHC images from human paraffin sections and an IF image from A549 cells; PA2012 has IHC images from human mammary cancer and rat brain tissue (catalog image captions). A00365 has ICC and IF images from EL4 and L1210 cells, respectively (A00365 image captions).
Which to pick: Choose A00365-2 for human paraffin-section chromogenic IHC: its caption documents EDTA retrieval at pH 8.0, 2 μg/ml primary antibody, and peroxidase/DAB detection; the fixative is unreported (A00365-2 IHC caption). For IF/ICC, A00365-2 has a human A549 IF image, while A00365 has EL4 ICC and L1210 IF images (A00365-2 and A00365 image captions). For cross-species tissue IHC, PA2012 lists human, mouse, and rat reactivity and IHC-P use, with images from human mammary cancer and rat brain tissue (PA2012 catalog applications, reactivity, and IHC captions).