This website uses cookies to ensure you get the best experience on our website.


- Table of Contents
Real validated UGT1A1 Western blot protocols, expected-band and isoform facts, troubleshooting for weak or shifted signal, and recommended anti-UGT1A1 WB antibodies. Everything you need to plan the experiment before you commit precious samples.
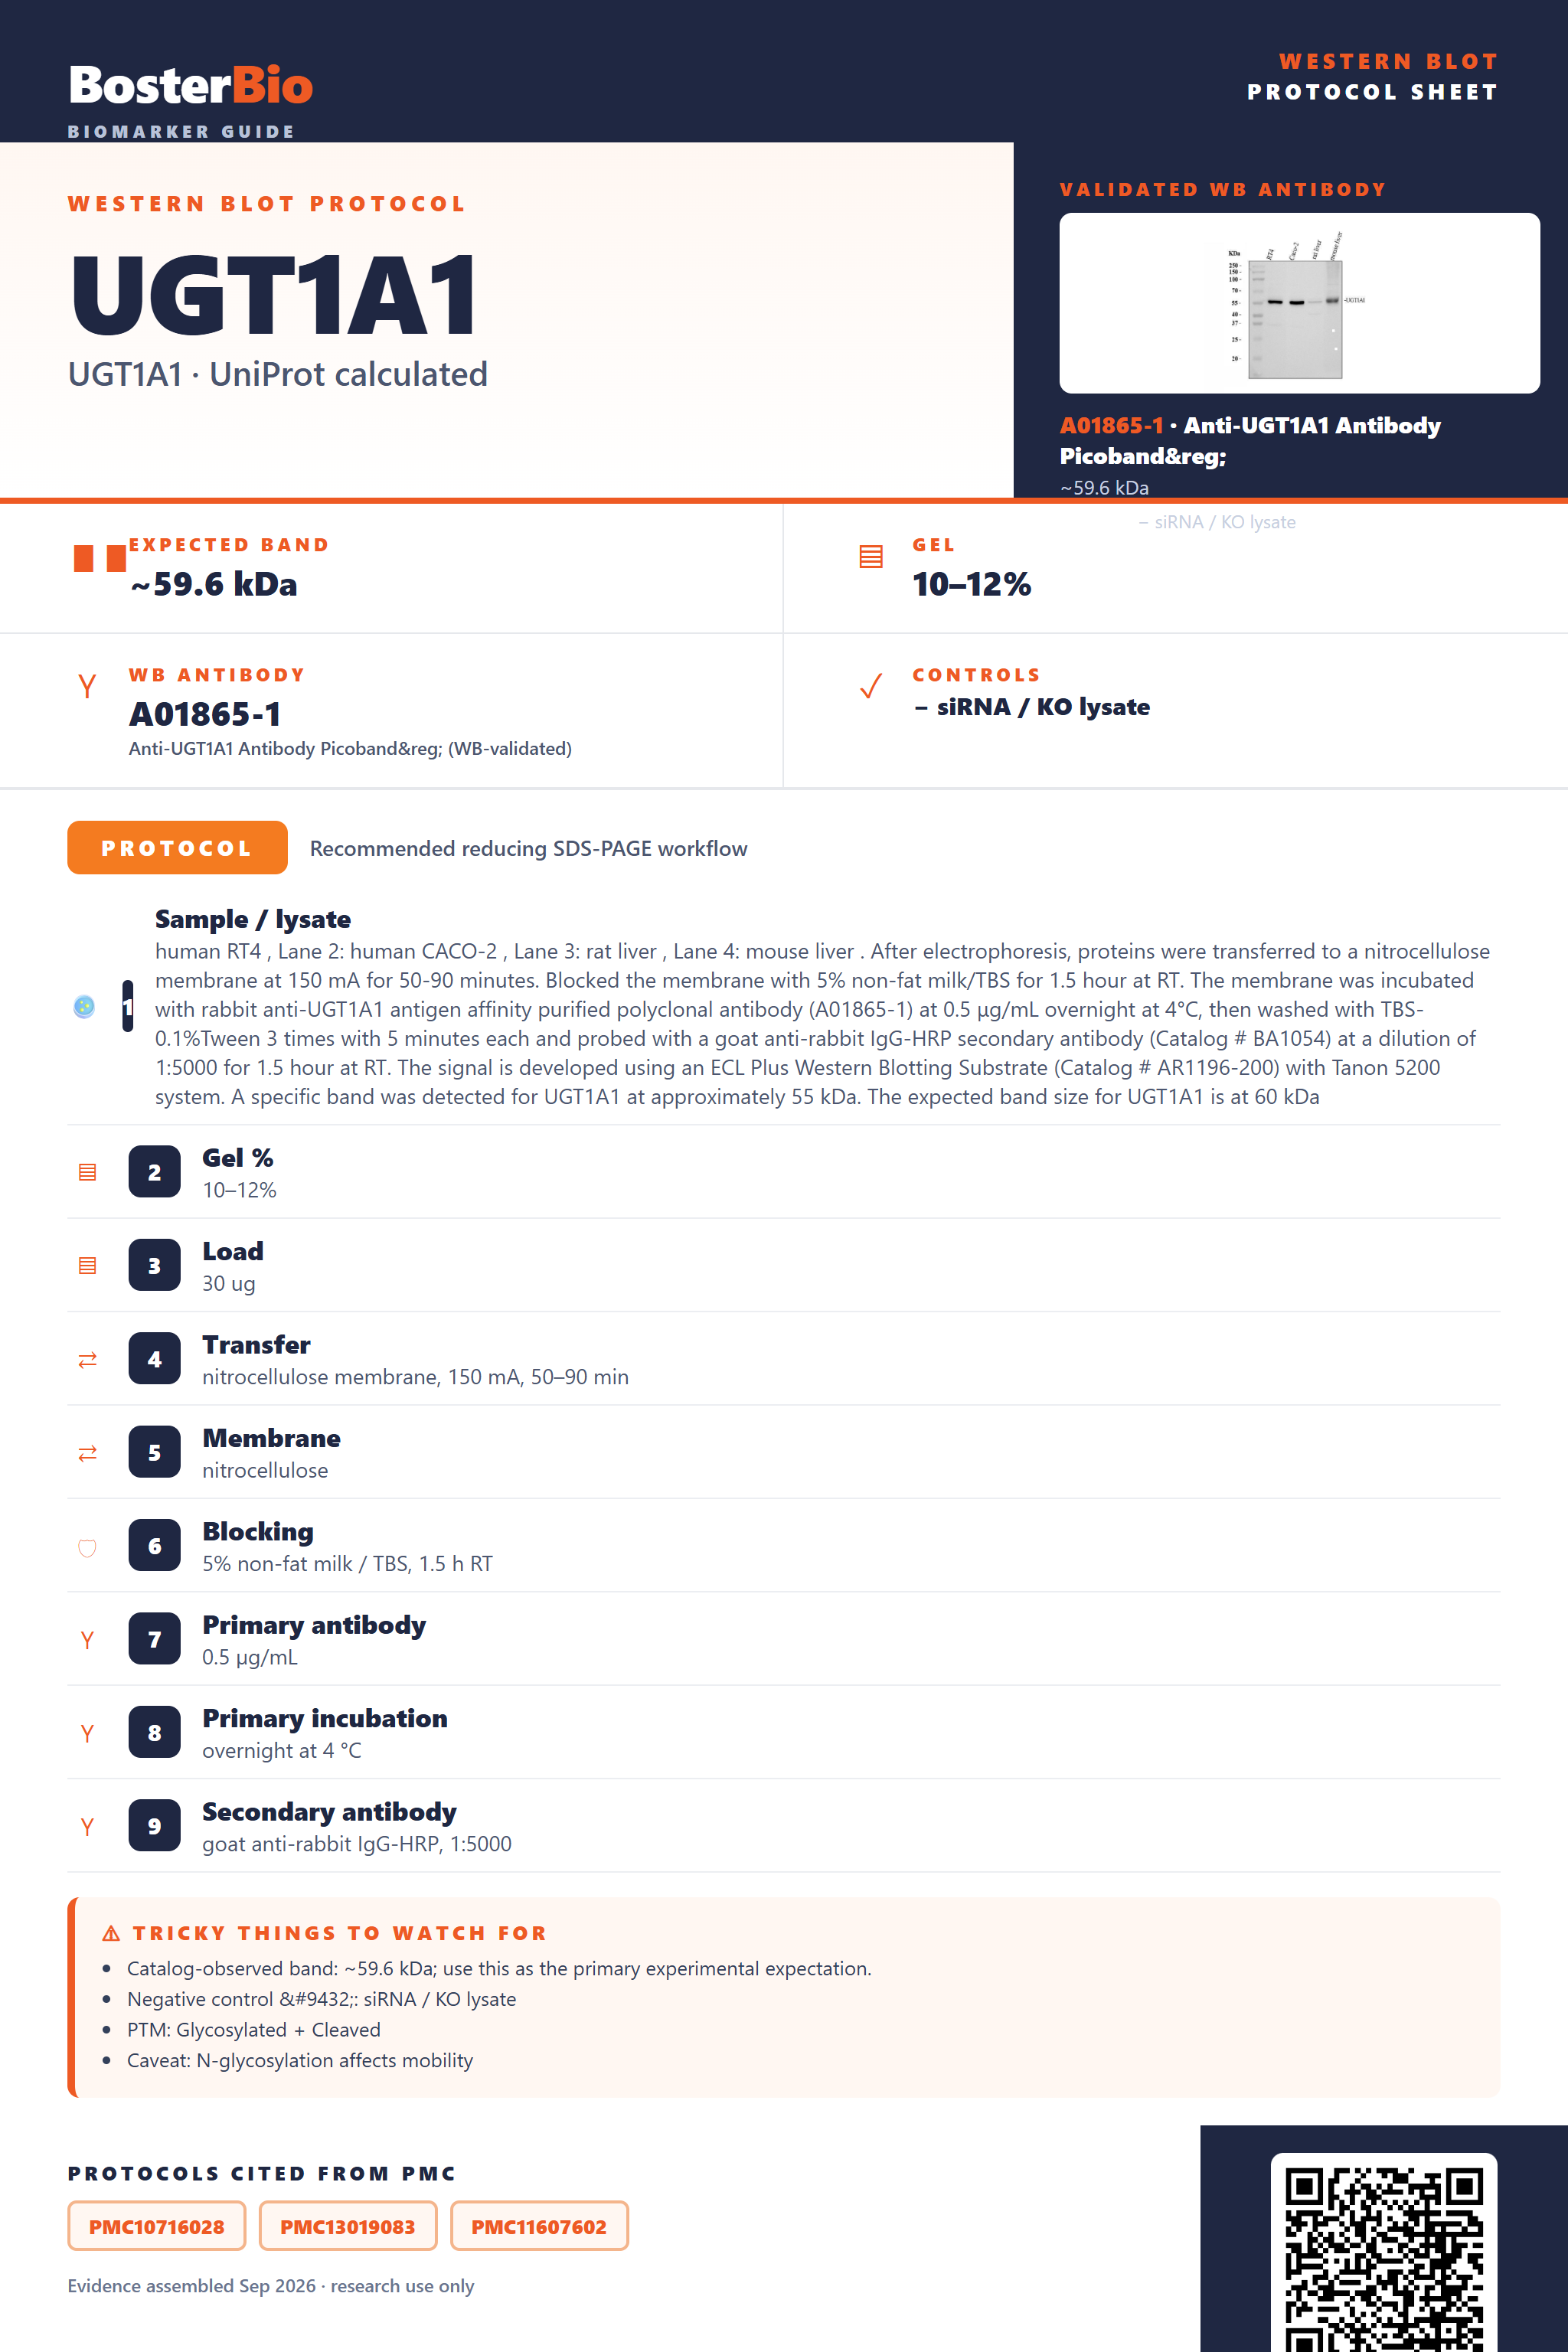
Expected bands, validated protocols, controls and antibodies — the at-a-glance facts below, then the full design guide.
| Expected band | ~59.6 kDa | |
| Observed band | ~55 kDa | |
| Gel | 10–12% | |
| Negative control | siRNA / KO lysate |
| PTM | Glycosylated + Cleaved | |
| Caveat | N-glycosylation affects mobility | |
| Regulation | Not found in UniProt | |
| Isoform | 2 isoform(s) |
Literature-validated Western blot parameters for UGT1A1 — gel percentage, transfer, blocking, antibody incubation and detection, extracted from published methods.
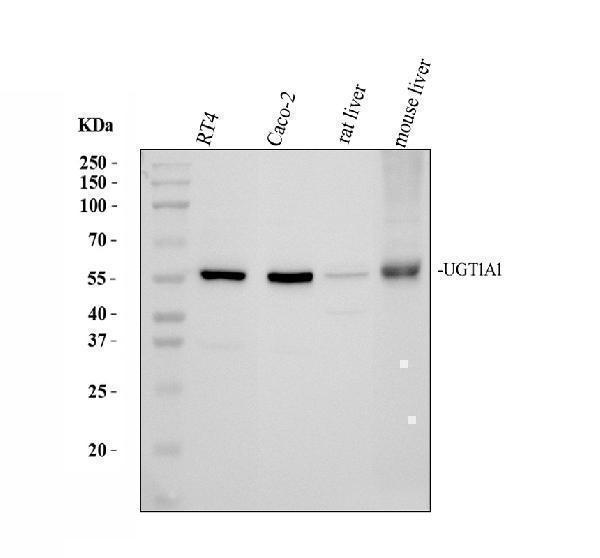
| Sample / lysate | human RT4 , Lane 2: human CACO-2 , Lane 3: rat liver , Lane 4: mouse liver . After electrophoresis, proteins were transferred to a nitrocellulose membrane at 150 mA for 50-90 minutes. Blocked the membrane with 5% non-fat milk/TBS for 1.5 hour at RT. The membrane was incubated with rabbit anti-UGT1A1 antigen affinity purified polyclonal antibody (A01865-1) at 0.5 μg/mL overnight at 4°C, then washed with TBS-0.1%Tween 3 times with 5 minutes each and probed with a goat anti-rabbit IgG-HRP secondary antibody (Catalog # BA1054) at a dilution of 1:5000 for 1.5 hour at RT. The signal is developed using an ECL Plus Western Blotting Substrate (Catalog # AR1196-200) with Tanon 5200 system. A specific band was detected for UGT1A1 at approximately 55 kDa. The expected band size for UGT1A1 is at 60 kDa |
| Gel % | 10–12% |
| Load | 30 ug |
| Transfer | nitrocellulose membrane, 150 mA, 50–90 min |
| Membrane | nitrocellulose |
| Blocking | 5% non-fat milk / TBS, 1.5 h RT |
| Primary antibody | 0.5 µg/mL |
| Primary incubation | overnight at 4 °C |
| Secondary antibody | goat anti-rabbit IgG-HRP, 1:5000 |
| Wash | TBS-0.1% Tween, 3 × 5 min |
| Detection | ECL |
| Exposure / imaging | Tanon 5200 |
| Observed band | 55 kDa |
UGT1A1 has a 59.6 kDa predicted precursor but runs at approximately 55 kDa on blots, reflecting signal peptide cleavage and anomalous membrane-protein migration despite N-glycosylation.
| Single band around 55 kDa | the expected mature, glycosylated UGT1A1 monomer seen on most blots |
| Band running below the 59.6 kDa predicted precursor mass | loss of the 25-residue signal peptide plus faster-than-predicted migration typical of single-pass ER membrane proteins |
| Diffuse or smeared band rather than one sharp line | heterogeneous occupancy of the three N-glycosylation sites at Asn102, Asn295, and Asn347 produces a range of glycoform masses |
| Two bands close together | co-expression of the two annotated splice isoforms, which differ in length |
| Weak or absent band in cytosolic-only preparations | UGT1A1 is anchored in the ER membrane with a perinuclear distribution, so it is depleted from purely soluble cytosolic fractions |
| Predicted mass from UniProt, 59.6 kDa precursor | sets the theoretical starting point before any post-translational modification is considered |
| Signal peptide cleavage at residues 1-25 | removes the N-terminal signal sequence, lowering the mature protein mass below the 59.6 kDa precursor prediction |
| N-glycosylation at Asn102, Asn295, and Asn347 | adds carbohydrate mass and heterogeneity, broadening or slightly raising the band relative to the unmodified backbone |
| Single-pass ER membrane topology | hydrophobic membrane-associated regions bind SDS atypically, causing the mature glycoprotein to migrate faster than its calculated mass, near the observed 55 kDa band |
| Splice isoforms 1 and 2 | can produce an additional band at a different apparent size when both isoforms are expressed, though no isoform-specific mass is defined |
| Situation | Likely cause | Next action |
|---|---|---|
| No band in lysate | UGT1A1 is enriched in ER microsomal membranes, so preparations lacking a membrane fraction, such as cytosol-only lysate, can miss the protein | Use whole-cell or microsomal membrane lysates and include a membrane-solubilizing detergent in the lysis buffer |
| Band lower than expected | single-pass membrane proteins often migrate faster than their calculated mass on SDS-PAGE, and signal peptide cleavage further reduces mass below the 59.6 kDa precursor prediction | Confirm identity against the empirical 55 kDa band reported for UGT1A1 rather than the 59.6 kDa calculated precursor mass |
| Broad smear instead of sharp band | heterogeneous occupancy of the three N-glycosylation sites creates a mixture of glycoforms | Run a longer resolving gel or treat lysate with PNGase F to collapse glycoforms into a single deglycosylated band for comparison |
| Multiple bands | the two annotated splice isoforms can be co-expressed, or the antibody may cross-react with other closely related UGT1A family members | Verify the target band against a UGT1A1-positive control tissue such as liver and check the immunogen region against isoform and paralog sequences |
| Weak or no signal | UGT1A1 expression is largely restricted to liver and intestine, so cell lines or tissues with low expression give minimal signal | Include a known-positive liver tissue lysate as a control and increase loading or antibody concentration if needed |
Comprehensive Human Protein Atlas IHC scoring per tissue. Rows are taken directly from the HPA tissue chart — click any row's HPA link to view the source.
| Tissue | Cell type | Level | Evidence | Source |
|---|
| Tissue | Cell type | Level | Evidence | Source |
|---|
Deeper troubleshooting and optimisation questions for UGT1A1, answered from its protein features.
BosterBio's UGT1A1 antibodies are among the best-performing WB antibodies on the market — well cited, thoroughly validated, and orthogonally cross-validated against negative tissues and complementary methods.
This UGT1A1 antibody panel currently lists a single Boster reagent (A01865-1) with a documented Western blot result, giving straightforward reagent selection for this target.
Which to pick: Only one anti-UGT1A1 antibody is catalogued: A01865-1, which includes an actual WB validation image (10% SDS-PAGE, 80V/120V). Use it as the default choice, since no alternative SKUs are listed for comparison.