Product Info Summary
| SKU: | A30379 |
|---|---|
| Size: | 100 μg/vial |
| Reactive Species: | Human |
| Host: | Rabbit |
| Application: | IHC, WB |
Customers Who Bought This Also Bought
Product info
Product Name
Anti-Hepatitis B Virus Antibody Picoband®
SKU/Catalog Number
A30379
Size
100 μg/vial
Form
Lyophilized
Description
Boster Bio Anti-Hepatitis B Virus Antibody Picoband® catalog # A30379. Tested in IHC, WB applications. This antibody reacts with Human. The brand Picoband indicates this is a premium antibody that guarantees superior quality, high affinity, and strong signals with minimal background in Western blot applications. Only our best-performing antibodies are designated as Picoband, ensuring unmatched performance.
Storage & Handling
Store at -20˚C for one year from date of receipt. After reconstitution, at 4˚C for one month. It can also be aliquotted and stored frozen at -20˚C for six months. Avoid repeated freeze-thaw cycles.
Cite This Product
Anti-Hepatitis B Virus Antibody Picoband® (Boster Biological Technology, Pleasanton CA, USA, Catalog # A30379)
Host
Rabbit
Contents
Each vial contains antibody formulated with stabilizing components, 0.9 mg NaCl, 0.2 mg Na2HPO4, and 0.05 mg NaN3.
*This antibody is supplied in a stabilized formulation.
Compatibility with conjugation reactions depends on the chemistry of the conjugation method used.
For conjugation methods that are not compatible with the stabilizing components present in this formulation, a carrier-free antibody format is required.
Clonality
Polyclonal
Isotype
Rabbit IgG
Immunogen
A synthetic peptide corresponding to a sequence at the N-terminus of human Hepatitis B Virus.
Cross-reactivity
No cross-reactivity with other proteins
Reactive Species
A30379 is reactive to S in Human
Observed Molecular Weight
6 kDa
Background of S
Hepatitis B virus, abbreviated HBV, is a species of the genus Orthohepadnavirus, which is likewise a part of the Hepadnaviridae family of viruses. This virus causes the disease hepatitis B. It consists of HBsAg, HBcAg (HBeAg is a splice variant), Hepatitis B virus DNA polymerase and HBx. Among these, HBsAg (also known as the Australia antigen) is the surface antigen of the hepatitis B virus (HBV). It indicates current hepatitis B infection. The viral envelope of an enveloped virus has different surface proteins from the rest of the virus which act as antigens. These antigens are recognized by antibody proteins that bind specifically to one of these surface proteins.
Antibody Validation
Boster validates all antibodies on WB, IHC, ICC, Immunofluorescence, and ELISA with known positive control and negative samples to ensure specificity and high affinity, including thorough antibody incubations.
Application & Images
Applications
A30379 is guaranteed for IHC, WB Boster Guarantee
Recommend Dilution
| Application | Dilution | Species |
|---|---|---|
| Immunohistochemistry (Paraffin-embedded Section) | 0.5-1μg/ml | Human |
| Western blot | 0.1-0.5μg/ml | HBV |
Tested application
Use TE buffer pH 9.0 for antigen retrieval; (*) citrate buffer pH 6.0 is an alternative.
Validation Images & Assay Conditions
Click image to see more details
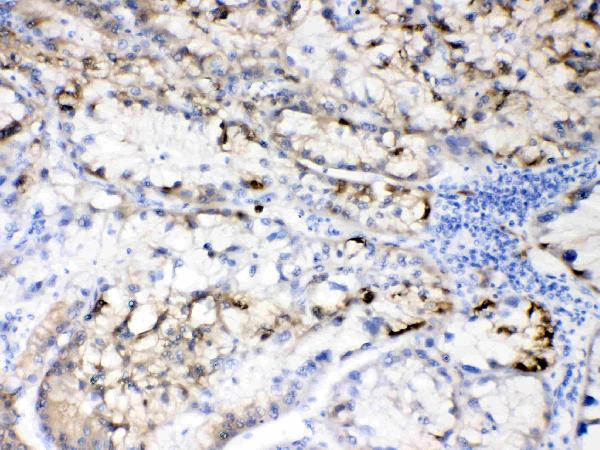
IHC analysis of Hepatitis B Virus using anti-Hepatitis B Virus antibody (A30379). Hepatitis B Virus was detected in paraffin-embedded section of human hepatitis B tissues. Heat mediated antigen retrieval was performed in citrate buffer (pH6, epitope retrieval solution) for 20 mins. The tissue section was blocked with 10% goat serum. The tissue section was then incubated with 1μg/ml rabbit anti-Hepatitis B Virus Antibody (A30379) overnight at 4°C. Biotinylated goat anti-rabbit IgG was used as secondary antibody and incubated for 30 minutes at 37°C. The tissue section was developed using Strepavidin-Biotin-Complex (SABC)(Catalog # SA1022) with DAB as the chromogen.
Click image to see more details
IHC analysis of Hepatitis B Virus using anti-Hepatitis B Virus antibody (A30379). Hepatitis B Virus was detected in paraffin-embedded section of human liver cancer tissues. Heat mediated antigen retrieval was performed in citrate buffer (pH6, epitope retrieval solution) for 20 mins. The tissue section was blocked with 10% goat serum. The tissue section was then incubated with 1μg/ml rabbit anti-Hepatitis B Virus Antibody (A30379) overnight at 4°C. Biotinylated goat anti-rabbit IgG was used as secondary antibody and incubated for 30 minutes at 37°C. The tissue section was developed using Strepavidin-Biotin-Complex (SABC)(Catalog # SA1022) with DAB as the chromogen.
Click image to see more details
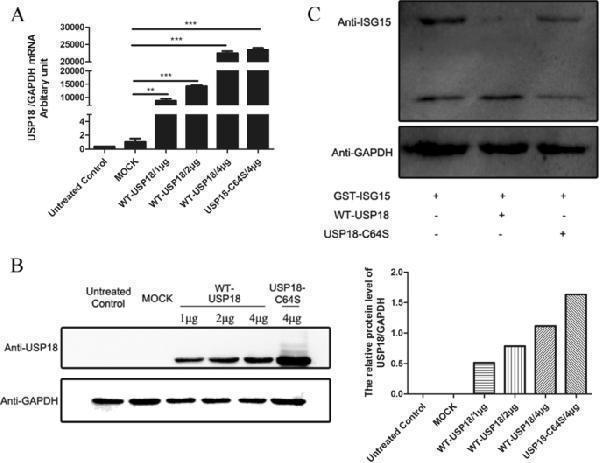
Over-expression of USP18 and its catalytic activity. HepAD38 cells were transfected with WT-USP18 plasmid, USP18-C64S plasmid or empty vector (MOCK) or left untreated. a : Twenty-four hours after transfection, USP18 mRNA was determined by real-time PCR (normalized by GAPDH). b : Forty-eight hours after transfection, USP18 protein expressions were analyzed by western blot (left). The relative expression levels of USP18 (normalized by GAPDH) were calculated by densitometry analysis (right). c : Cleavage of ISG15-GST fusion in vitro. USP18, ISG15/GST and WT-USP18 (or USP18-C64S) were co-transfected into Hela cells. Total intracellular protein was collected to perform Western blot. WT-USP18, wide type USP18; MOCK, empty plasmid. Results are presented as means ± SD ( n ≥ 3). ** p ≤ 0.01; *** p ≤ 0.001
Index in PubMed under a CC BY license. PMID: 32248821
Click image to see more details
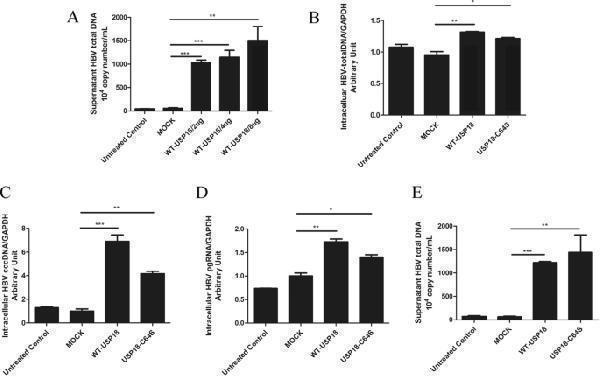
Over-expression of USP18 in HepAD38 cells promoted HBV production independent of its protease activity. HepAD38 cells were transfected with USP18 plasmids as indicated. Real-time PCR was performed to quantify HBV production. Total supernatant HBV DNA ( a ), total intracellular HBV DNA ( b ), HBV cccDNA ( c ) and HBV pgRNA ( d ) 48 h post transfection with 4 μg WT-USP18 plasmid. Supernatant HBV total DNA 48 h post transfection with 4 μg WT-USP18 or 4 μg USP18-C64S plasmid, respectively ( e ). WT-USP18, wide type USP18; MOCK, empty plasmid. Results are presented as means ± SD (n ≥ 3). * p ≤ 0.05; ** p ≤ 0.01; ***p ≤ 0.001
Index in PubMed under a CC BY license. PMID: 32248821
Click image to see more details
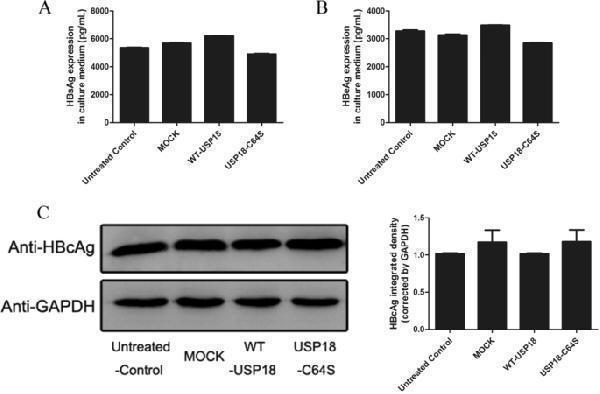
Over-expression of USP18 in HepAD38 cells did not affect expression of HBV proteins. HepAD38 cells were transfected with the 4 μg WT-USP18, 4 μg USP18-C64S or 4 μg MOCK, respectively. Forty-eight hours later, culture medium was collected to quantify HBsAg ( a ) and HBeAg ( b ) expression level by ELISA assay. Intracellular HBcAgwas detected by western blot ( c, left ) and ( c, right ) analyzed by densitometry analysis. WT-USP18, wide type USP18; MOCK, empty plasmid. Results are presented as means ± SD (n ≥ 3)
Index in PubMed under a CC BY license. PMID: 32248821
Click image to see more details
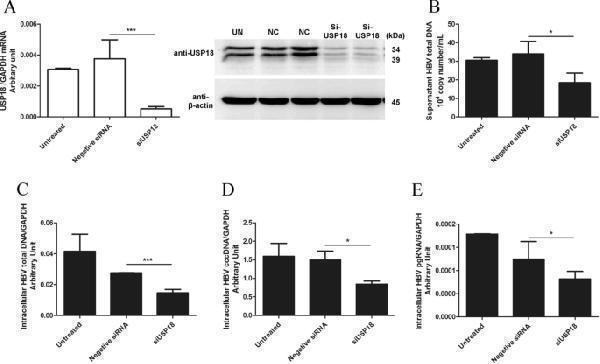
Silencing USP18 in HepAD38 suppressed HBV production. HepAD38 cells were seeded at 3 × 10 5 /ml, 2 ml per well in 6-well plates. 24 h later, the cells were left untreated or transfected with 20 nM siUSP18 or 20 nM NC. 48 h post transfection, knockdown efficiency was evaluated by detecting USP18 mRNA expression ( a, left ), which was further confirmed by western blot ( a, right ). Intracellular total RNA and DNA, as well as supernatant DNA, were collected respectively. Real-time PCR was performed to detect supernatant HBV total DNA ( b ), intracellular HBV total DNA ( c ), HBV cccDNA ( d ) and pgRNA ( e ). siUSP18, USP18 small inhibitory RNA; NC, the negative control siRNA. Results are presented as means ± SD (n ≥ 3). *p ≤ 0.05; **p ≤ 0.01; ***p ≤ 0.001
Index in PubMed under a CC BY license. PMID: 32248821
Click image to see more details
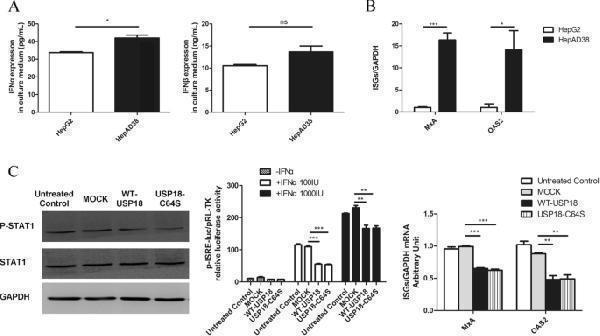
USP18 upregulation inhibited IFN-induced Jak/STAT signaling pathway. HepAD38 cells and HepG2 cells were seeded in 6-well plate without any treatment, respectively. Forty-eight hours later, supernatant IFNα ( a, left ) and IFNβ ( a, right ) and intracellular mRNA expression of ISGs ( b ) were analyzed by ELISA assay and real-time PCR, respectively. To investigate the effects of USP18 on STAT phosphorylation, HepAD38 cells were transfected with WT-USP18, USP18-C64S or MOCK for 48 h and treated with 500 IU/ml IFNα for 30 min before harvested. Western blot was used to analyze the expression of STAT1 and p-STAT1 ( c, left ). The interferon stimulated response element (ISRE) activity was quantified by dual luciferase reporter gene assay. Briefly, HepAD38 cells were co-transfected with WT-USP18, USP18-C64S or MOCK and ISRE-luc reporter plasmid /pRL-TK reporter plasmid for 24 h, and then left untreated or treated with 100 IU/ml or 1000 IU/ml IFNα for 24 h before the cells were lysed ( c, middle ). HepAD38 cells were transfected with WT-USP18, USP18-C64S or MOCK for 48 h and treated with 500 IU/ml IFNα for additional 24 h. Expression of ISGs mRNA including MxA and OAS2 were detected by real-time PCR ( c, right ). WT-USP18, wide type USP18; MOCK, empty plasmid. Results are presented as means ± SD (n ≥ 3). *p ≤ 0.05; **p ≤ 0.01; ***p ≤ 0.001
Index in PubMed under a CC BY license. PMID: 32248821
Click image to see more details
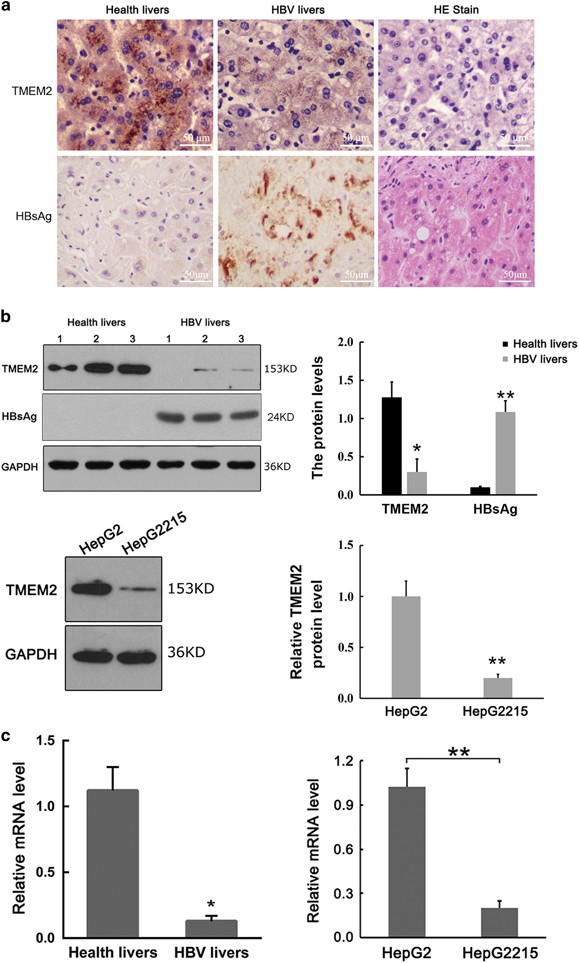
Expression of TMEM2 in liver tissues and HepG2 and HepG2.2.15 cells. ( a ) Expression of TMEM2 in liver tissues based on IHC. (Left) Grainy staining of TMEM2 was observed in the cytoplasm in normal liver tissues. (Middle) Reduced TMEM2 expression in the liver tissues from a patient with chronic HBV infection. (Right) HE staining of normal liver tissues (scale bar, 50 μ m). ( b ) Western blot results showed reduced expression of TMEM2 in the liver tissues from a patient with chronic HBV infection compared with normal liver tissues (above) (healthy livers compared with HBV livers: * P <0.05, ** P <0.01). Western blot results showed reduced expression of TMEM2 in HepG2.2.15 cells compared with HepG2 cells (below) (HepG2 versus HepG2215: ** P <0.01). ( c ) RT-qPCR results showed reduced TMEM2 mRNA levels in the liver tissues from a patient with chronic HBV infection compared with that in normal liver tissues (left) (healthy livers versus HBV livers: * P <0.05). RT-qPCR results showed reduced TMEM2 mRNA levels in HepG2.2.15 cells compared with HepG2 cells (right) (HepG2 versus HepG2215: ** P <0.01). Error bars are presented as S.D.
Index in PubMed under a CC BY license. PMID: 27253403
Click image to see more details
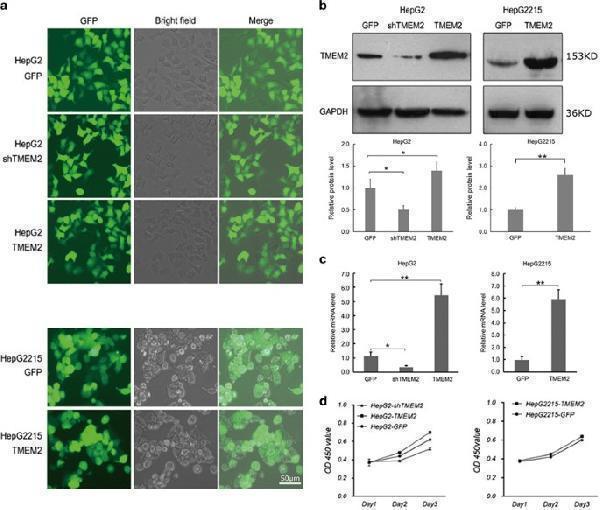
Expression of TMEM2 in stable cell lines. ( a ) HepG2 GFP cells (the control HepG2 cells), HepG2 shTMEM2 cells with TMEM2 silenced, HepG2 TMEM2 cells with TMEM2 overexpression, HepG2.2.15 GFP cells (normal HepG2.2.15 cells), and HepG2.2.15 TMEM2 cells with TMEM2 overexpression. ( b ) Western blot results showed reduced expression of TMEM2 in HepG2 shTMEM2 cells (GFP versus HepG2 shTMEM2: * P <0.05; GFP versus HepG2 TMEM2: * P <0.05) and increased expression of TMEM2 in HepG2 TMEM2 and HepG2.2.15 TMEM2 cells (GFP versus HepG2215 TMEM2: ** P <0.01). ( c ) RT-qPCR results showed reduced levels of TMEM2 mRNA in HepG2 shTMEM2 cells (GFP versus HepG2 shTMEM2: * P <0.05; GFP versus HepG2 TMEM2: ** P <0.01) and increased mRNA levels of TMEM2 in HepG2 TMEM2 and HepG2.2.15 TMEM2 cells (GFP versus HepG2215 TMEM2: ** P <0.01)). ( d ) Effect of TMEM2 silencing or overexpression on the kinetics of cell growth/cell death. Overexpression of TMEM2 slightly promoted the proliferation of HepG2 and HepG2.2.15 ( P >0.05), and TMEM2 silencing slightly repressed the proliferation of HepG2 cells ( P >0.05). Error bars are presented as S.D.
Index in PubMed under a CC BY license. PMID: 27253403
Click image to see more details
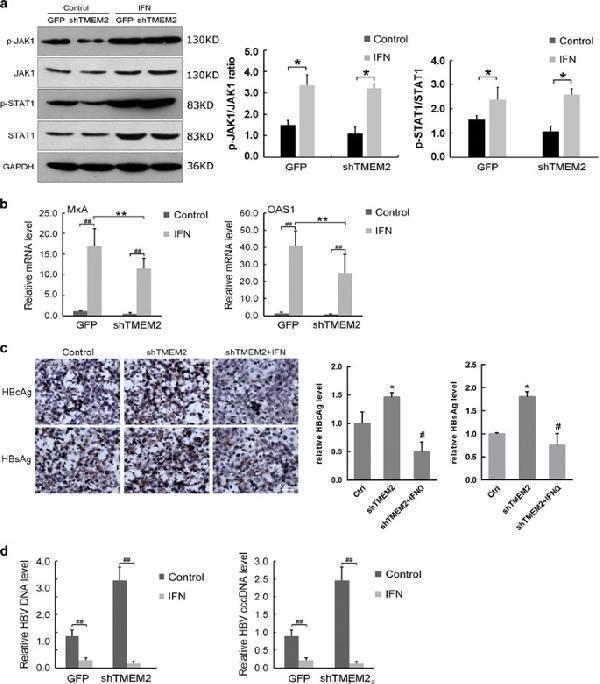
INF promoted the inhibitory effects of TMEM2 on HBV infection. ( a ) IFN pre-treatment increased the levels of p-JAK1 and p-STAT1 in HepG2 GFP and HepG2 shTMEM2 cells (Control versus IFN: * P <0.05). ( b ) IFN pre-treatment significantly increased the expression of MxA and OAS1 in HepG2 GFP and HepG2 shTMEM2 cells ( ## P <0.01). The expression of MxA and OAS1 in HepG2 shTMEM2 cells was significantly lower than that in HepG2 GFP cells (** P <0.01). ( c ) IFN pre-treatment reduced the levels of HBsAg and HBcAg in HepG2 shTMEM2 cells infected with HBV; the relative HBcAg and HBsAg levels are represented in the column graph on the right of . ( d ) IFN pre-treatment significantly reduced the mRNA levels of HBV DNA and HBV cccDNA in HepG2 GFP and HepG2 shTMEM2 cells infected with HBV ( ## P <0.01). Ctr, Control (HepG2 GFP). Error bars are presented as S.D.
Index in PubMed under a CC BY license. PMID: 27253403
Click image to see more details
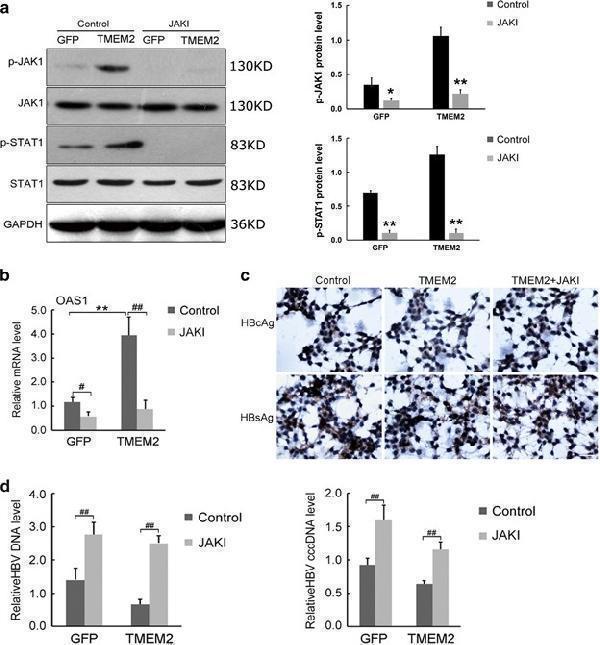
JAK1 inhibitor repressed the inhibitory effects of TMEM2 on HBV infection. ( a ) JAK1 inhibitor significantly reduced the levels of p-JAK1 and p-STAT1 in HepG2.2.15 GFP and HepG2.2.15 TMEM2 cells. However, the expression of JAK1 and STAT1 in HepG2.2.15 GFP and HepG2.2.15 TMEM2 cells was not significantly affected by JAK1 inhibitor; quantitation of p-JAK1 and p-STAT1 is shown in the column graph on the right of . ( b ) JAK1 inhibitor significantly reduced the expression of OAS1 in HepG2.2.15 GFP and HepG2.2.15 TMEM2 cells ( # P <0.05, ## P <0.01). Prior to JAK1 inhibitor pre-treatment, the expression of OAS1 in HepG2.2.15 TMEM2 cells was significantly higher than that in HepG2.2.15 GFP cells (** P <0.01). ( c ) JAK1 inhibitor increased the levels of HBsAg and HBcAg in HepG2.2.15 TMEM2 cells infected with HBV. ( d ) JAK1 inhibitor significantly increased the levels of HBV DNA and HBV cccDNA in HepG2.2.15 GFP and HepG2.2.15 TMEM2 cells infected with HBV ( ## P <0.01). Ctr, Control (HepG2.2.15 GFP). Error bars are presented as S.D.
Index in PubMed under a CC BY license. PMID: 27253403
Click image to see more details
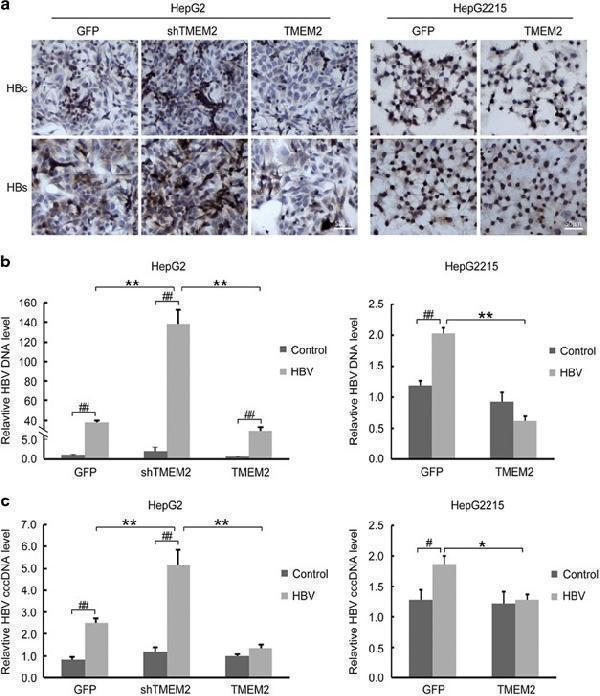
Levels of HBsAg, HBcAg, HBV DNA, and HBV cccDNA in HBV-infected HepG2 and HepG2.2.15 with TMEM2 overexpression or silencing. ( a ) IHC results showed higher levels of HBsAg and HBcAg in HepG2 shTMEM2 cells than in HepG2 GFP cells. The levels of HBsAg and HBcAg were lower in HepG2 TMEM2 cells than in HepG2 GFP cells. In addition, the levels of HBsAg and HBcAg were lower in HepG2.2.15 TMEM2 cells than in HepG2.2.15 GFP cells. HBc: HBcAg; HBs: HBsAg. ( b ) Quantitative analysis of HBV DNA in HBV-infected HepG2 and HepG2.2.15 with TMEM2 overexpression or silencing. After HBV infection, the HBV DNA level increased in all cells. After HBV infection, the level of HBV DNA in HepG2 shTMEM2 cells was higher than that in HepG2 GFP and HepG2 TMEM2 cells (left, ** P <0.01; ## P <0.01). After HBV infection, the level of HBV DNA in HepG2.2.15 GFP cells was significantly increased (right, ## P <0.01). After HBV infection, the level of HBV DNA in HepG2.2.15 TMEM2 cells was lower than that in HepG2.2.15 GFP cells (right, ** P <0.01). ( c ) Quantitative analysis of HBV cccDNA in HBV-infected HepG2 and HepG2.2.15 with TMEM2 overexpression or silencing. After HBV infection, HBV cccDNA levels were increased in HepG2 GFP and HepG2 shTMEM2 cells (left, ## P <0.01). After HBV infection, HBV cccDNA levels were increased in HepG2 shTMEM2 cells compared with HepG2 GFP and HepG2 TMEM2 cells (left, ** P <0.01). After HBV infection, HBV cccDNA were significantly increased in HepG2.2.15 GFP cells (right, # P <0.05). After HBV infection, HBV cccDNA levels were lower in HepG2.2.15 TMEM2 cells compared with HepG2.2.15 GFP cells (right, * P <0.05). Error bars are presented as S.D.
Index in PubMed under a CC BY license. PMID: 27253403
Click image to see more details
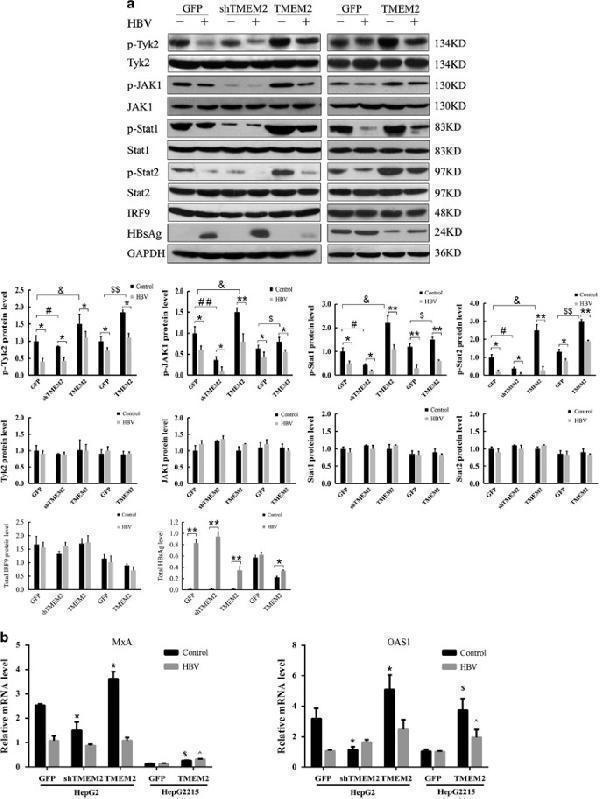
TMEM2 regulated JAK–STAT signaling pathway. ( a ) The expression levels of a number of key components of the JAK–STAT signaling pathway were evaluated by western blotting. The levels of p-Tyk2, p-JAK1, p-STAT1, and p-STAT2 were significantly reduced after HBV infection (Control versus HBV: * P <0.05, ** P <0.01). However, the levels of Tyk2, JAK1, STAT1, and STAT2 were not significantly affected by HBV infection. The levels of p-Tyk2, p-JAK1, p-STAT1, and p-STAT2 were significantly reduced in HepG2 shTMEM2 cells than compared with HepG2 GFP cells (HepG2 GFP versus HepG2 shTMEM2: # P <0.05, ## P <0.01). The levels of p-Tyk2, p-JAK1, p-STAT1, and p-STAT2 were significantly elevated in HepG2 TMEM2 cells compared with HepG2 GFP cells (HepG2 GFP versus HepG2 TMEM2: & P <0.05). The levels of p-Tyk2, p-JAK1, p-STAT1, and p-STAT2 were significantly elevated in HepG2.2.15 TMEM2 cells compared with HepG2.2.15 GFP cells (HepG2.2.15 GFP versus HepG2.2.15 TMEM2: $ P <0.05, $$ P <0.05). No significant changes in cellular levels of total IRF9 were observed by HBV infection in any groups based on western blot analysis. HBsAg was significantly induced after HBV infection (Control versus HBV: * P <0.05, ** P <0.01). ( b ) qPCR detection of the expression of MxA and OAS1 in HepG2 GFP and HepG2.2.15 cells. (* P< 0.05 compared with HepG2 GFP cells without HBV infection; $ P< 0.05 compared with HepG2.2.15 GFP cells without HBV infection; ^ P< 0.05 compared with HepG2.2.15 GFP cells infected with HBV.) Error bars are presented as S.D.
Index in PubMed under a CC BY license. PMID: 27253403
Click image to see more details
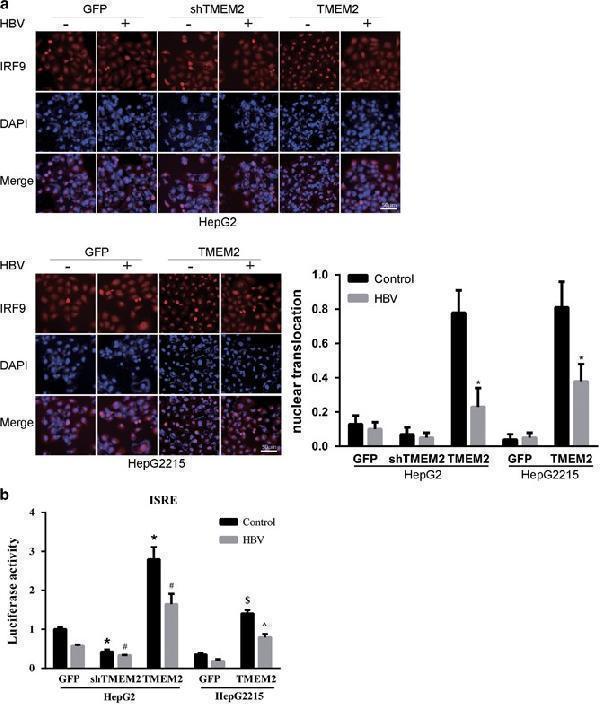
Effects of TMEM2 on the translocation of IRF9 into nuclei and the expression of MxA and OAS1. ( a ) IRF9 localization was analyzed by IFA. The level of IRF9 in the nuclei of HepG2 shTMEM2 cells did not change significantly in response to HBV infection compared with that in HepG2 GFP cells. In contrast, the level of IRF9 in the nuclei of non-HBV-infected HepG2 TMEM2 cells was remarkably higher than that in non-HBV-infected HepG2 GFP and HepG2 shTMEM2 cells. HBV infection reduced the level of IRF9 in the nuclei in HepG2 TMEM2 cells. Similar results were observed in HepG2.2.15 cells, which overexpressed TMEM2; nuclear translocation is represented by column shown on the right side of . ( b ) Using a plasmid that expresses a reporter gene (firefly luciferase) under the control of a promoter containing ISRE motifs, we showed that transfection of this plasmid into HepG2 TMEM2 cells, either with HBV infection or without, significantly increased luciferase activity compared with HepG2 GFP and HepG2 shTMEM2 cells (* P <0.05 compared with HepG2 GFP cells without HBV infection; # P <0.05 compared with HepG2 GFP cells with HBV infection). Similar results were observed in TMEM2-overexpressing HepG2.2.15 cells ( $ P <0.05 compared with HepG2.2.15 GFP cells without HBV infection, ^ P <0.05 compared with HepG2.2.15 GFP cells with HBV infection). When TMEM2 was silenced in HepG2 cells, the luciferase activity was markedly reduced. Error bars are presented as S.D.
Index in PubMed under a CC BY license. PMID: 27253403
Specific Publications For Anti-Hepatitis B Virus Antibody Picoband® (A30379)
Loading publications
Recommended Resources
Here are featured tools and databases that you might find useful.
- Boster's Pathways Library
- Protein Databases
- Bioscience Research Protocol Resources
- Data Processing & Analysis Software
- Photo Editing Software
- Scientific Literature Resources
- Research Paper Management Tools
- Molecular Biology Software
- Primer Design Tools
- Bioinformatics Tools
- Phylogenetic Tree Analysis
Customer Reviews
Have you used Anti-Hepatitis B Virus Antibody Picoband®?
Share your experimental results or join a short interview to earn up to $1,000 in product credits or other rewards.
0 Reviews For Anti-Hepatitis B Virus Antibody Picoband®
Customer Q&As
Have a question?
Find answers in Q&As, reviews.
Can't find your answer?
Submit your question
4 Customer Q&As for Anti-Hepatitis B Virus Antibody Picoband®
Question
Is this A30379 anti-Hepatitis B Virus antibody reactive to the isotypes of S?
Verified Customer
Verified customer
Asked: 2020-03-16
Answer
The immunogen of A30379 anti-Hepatitis B Virus antibody is A synthetic peptide corresponding to a sequence at the N-terminus of human Hepatitis B Virus (4-51aa WSSKPRQGMGTNLSVPNPLGFFPDHQLDPAFGANSNNPDWDFNPNKDQ). Could you tell me which isotype you are interested in so I can help see if the immunogen is part of this isotype?
Boster Scientific Support
Answered: 2020-03-16
Question
We are currently using anti-Hepatitis B Virus antibody A30379 for human tissue, and we are content with the IHC results. The species of reactivity given in the datasheet says human. Is it likely that the antibody can work on monkey tissues as well?
Verified Customer
Verified customer
Asked: 2020-02-18
Answer
The anti-Hepatitis B Virus antibody (A30379) has not been tested for cross reactivity specifically with monkey tissues, but there is a good chance of cross reactivity. We have an innovator award program that if you test this antibody and show it works in monkey you can get your next antibody for free. Please contact me if I can help you with anything.
Boster Scientific Support
Answered: 2020-02-18
Question
Is a blocking peptide available for product anti-Hepatitis B Virus antibody (A30379)?
Verified Customer
Verified customer
Asked: 2018-04-27
Answer
We do provide the blocking peptide for product anti-Hepatitis B Virus antibody (A30379). If you would like to place an order for it please contact support@bosterbio.com and make a special request.
Boster Scientific Support
Answered: 2018-04-27
Question
Can you help my question with product A30379, anti-Hepatitis B Virus antibody. I was wondering if it would be possible to conjugate this antibody with biotin. I would need it to be without BSA or sodium azide. I am planning on using a buffer exchange of sodium azide with PBS only. Would there be problems for me to conjugate the antibody and store it in -20 degrees in small aliquots?
H. Singh
Verified customer
Asked: 2013-02-28
Answer
We do not advise storing this antibody with PBS buffer only in -20 degrees. If you want to store it in -20 degrees it is best to add some cryoprotectant like glycerol. If you want carrier free A30379 anti-Hepatitis B Virus antibody, we can provide it to you in a special formula with trehalose and/or glycerol. These molecules will not interfere with conjugation chemistry and provide a good level of protection for the antibody from degradation. Please be sure to specify this in your purchase order.
Boster Scientific Support
Answered: 2013-02-28