This website uses cookies to ensure you get the best experience on our website.


- Table of Contents
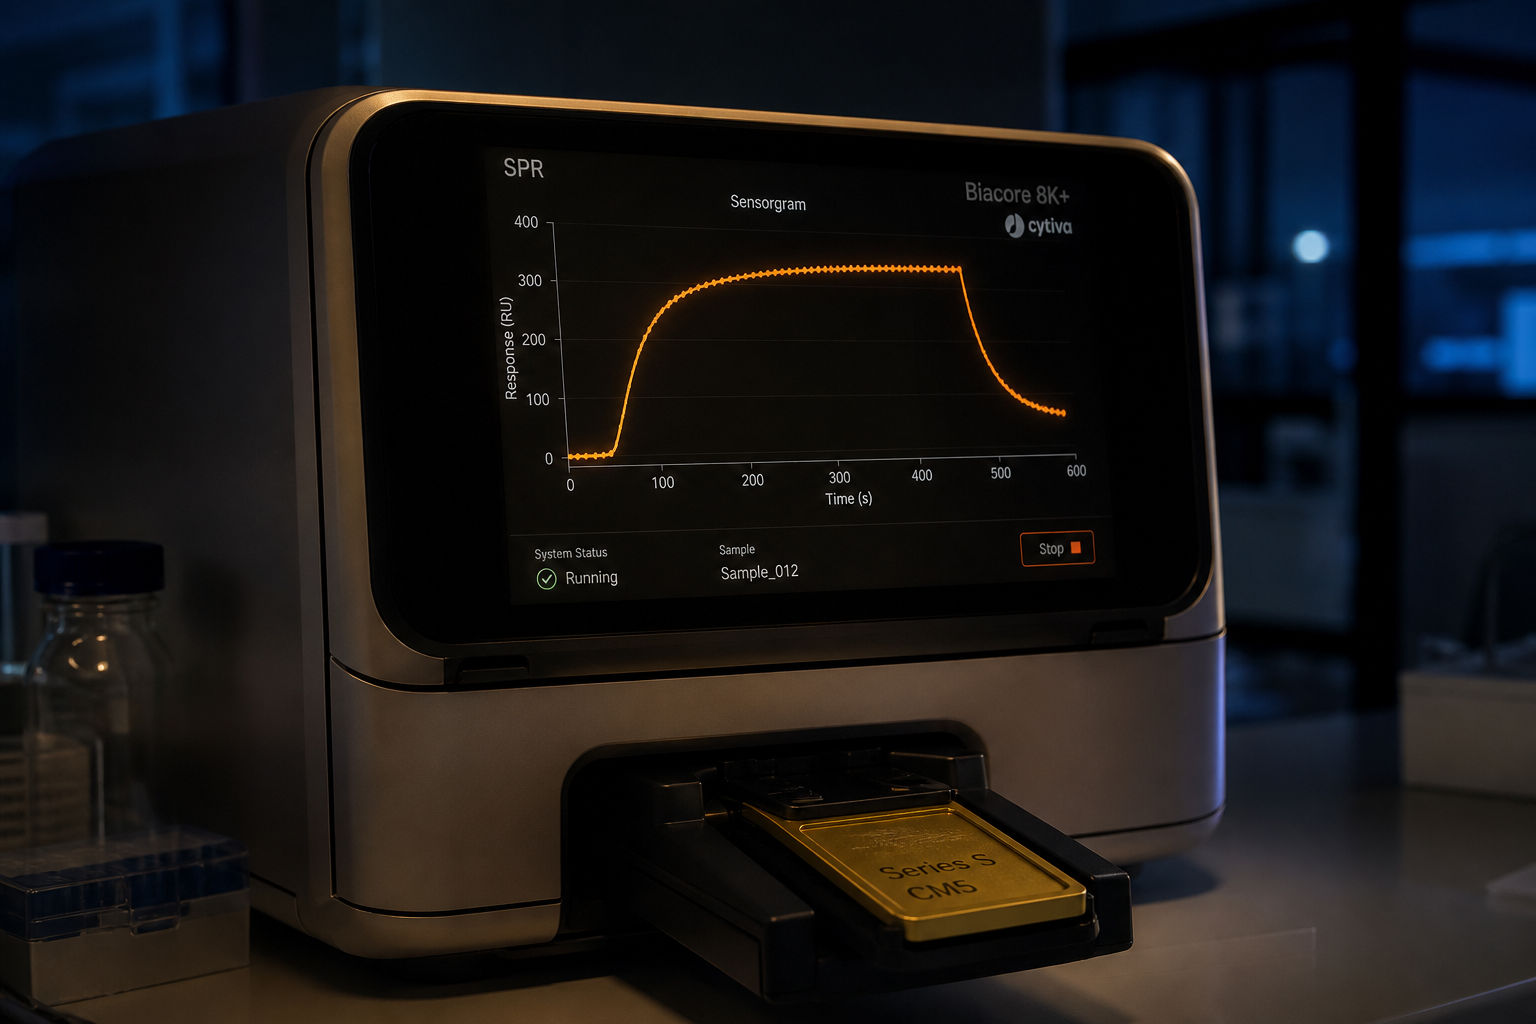
Label-free surface plasmon resonance (SPR) measurement of association rate (ka), dissociation rate (kd) and equilibrium dissociation constant (KD), with assay design and data interpretation included.
Discuss Your Binding AssaySurface plasmon resonance is widely used to measure how two biomolecules bind and release each other in real time, with no label on either partner. Boster's surface plasmon resonance services, including the SPR binding kinetics service described here and delivered through Boster and its partner labs, are built around three questions: how tightly your molecule binds its partner, how fast, and how specifically. They sit alongside Boster's other assay services. This page covers how the method works, the interaction types and surface chemistries available, the instrument formats and throughput options, what to send us, and what the report contains.
SPR is an optical, label-free way to watch molecular binding. One binding partner, the ligand, is immobilized on a thin gold film on a sensor chip. The other, the analyte, flows over that surface in solution. Polarized light reflected off the underside of the gold film excites a surface plasmon at a specific angle, and that angle depends on the refractive index within roughly 100–300 nm of the surface.
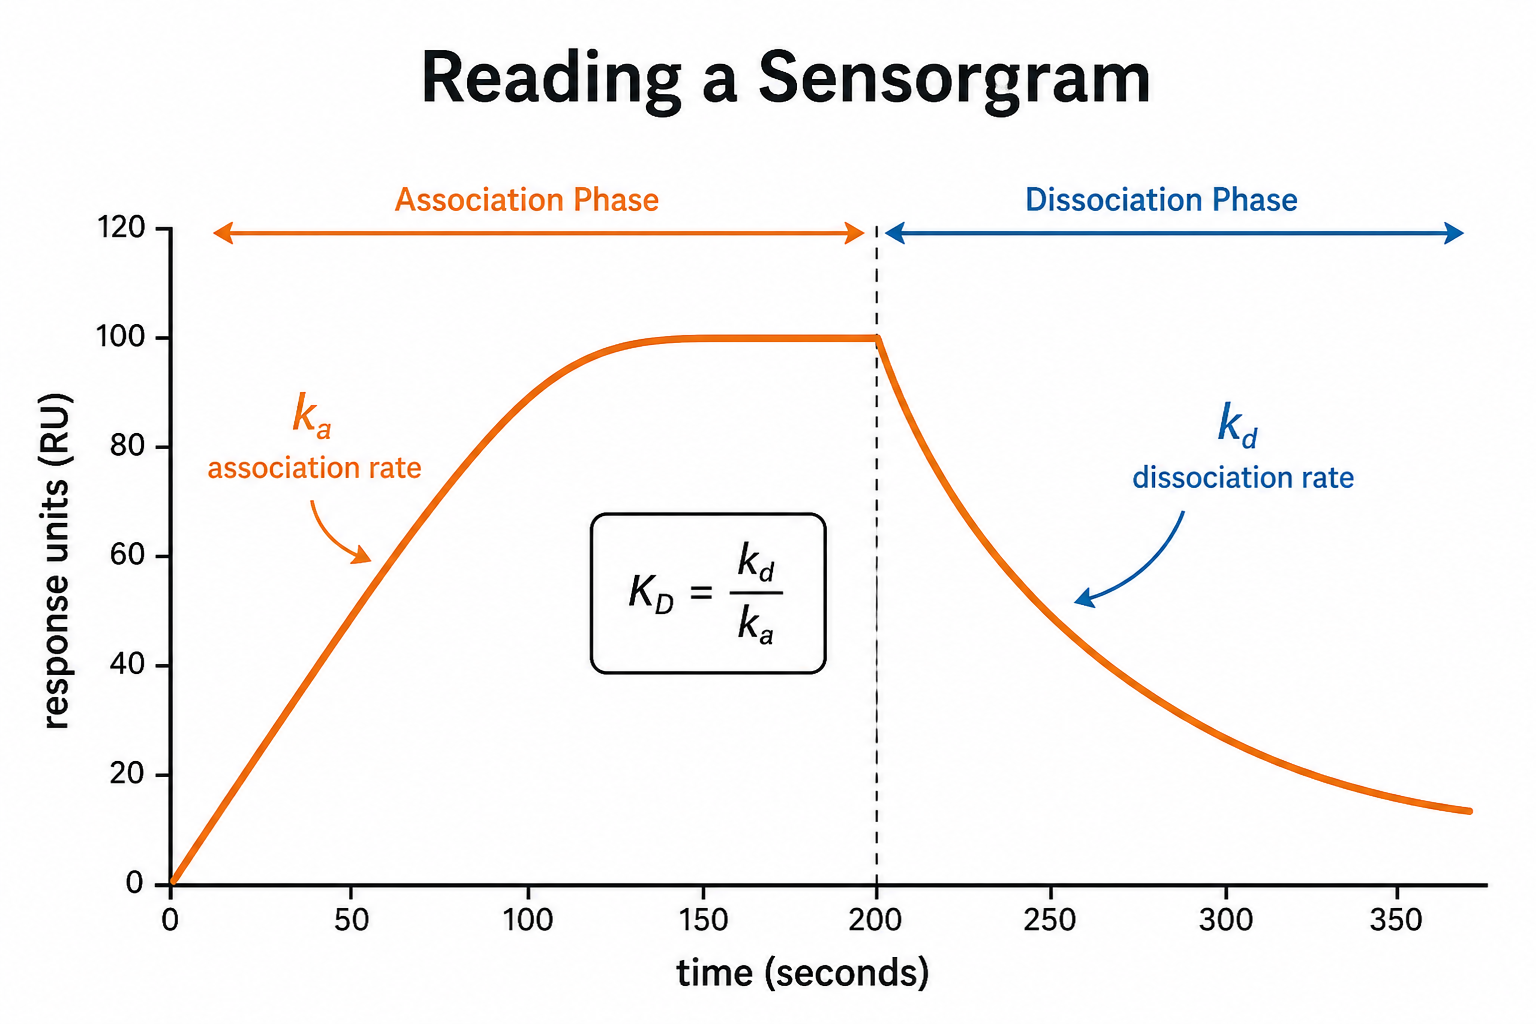
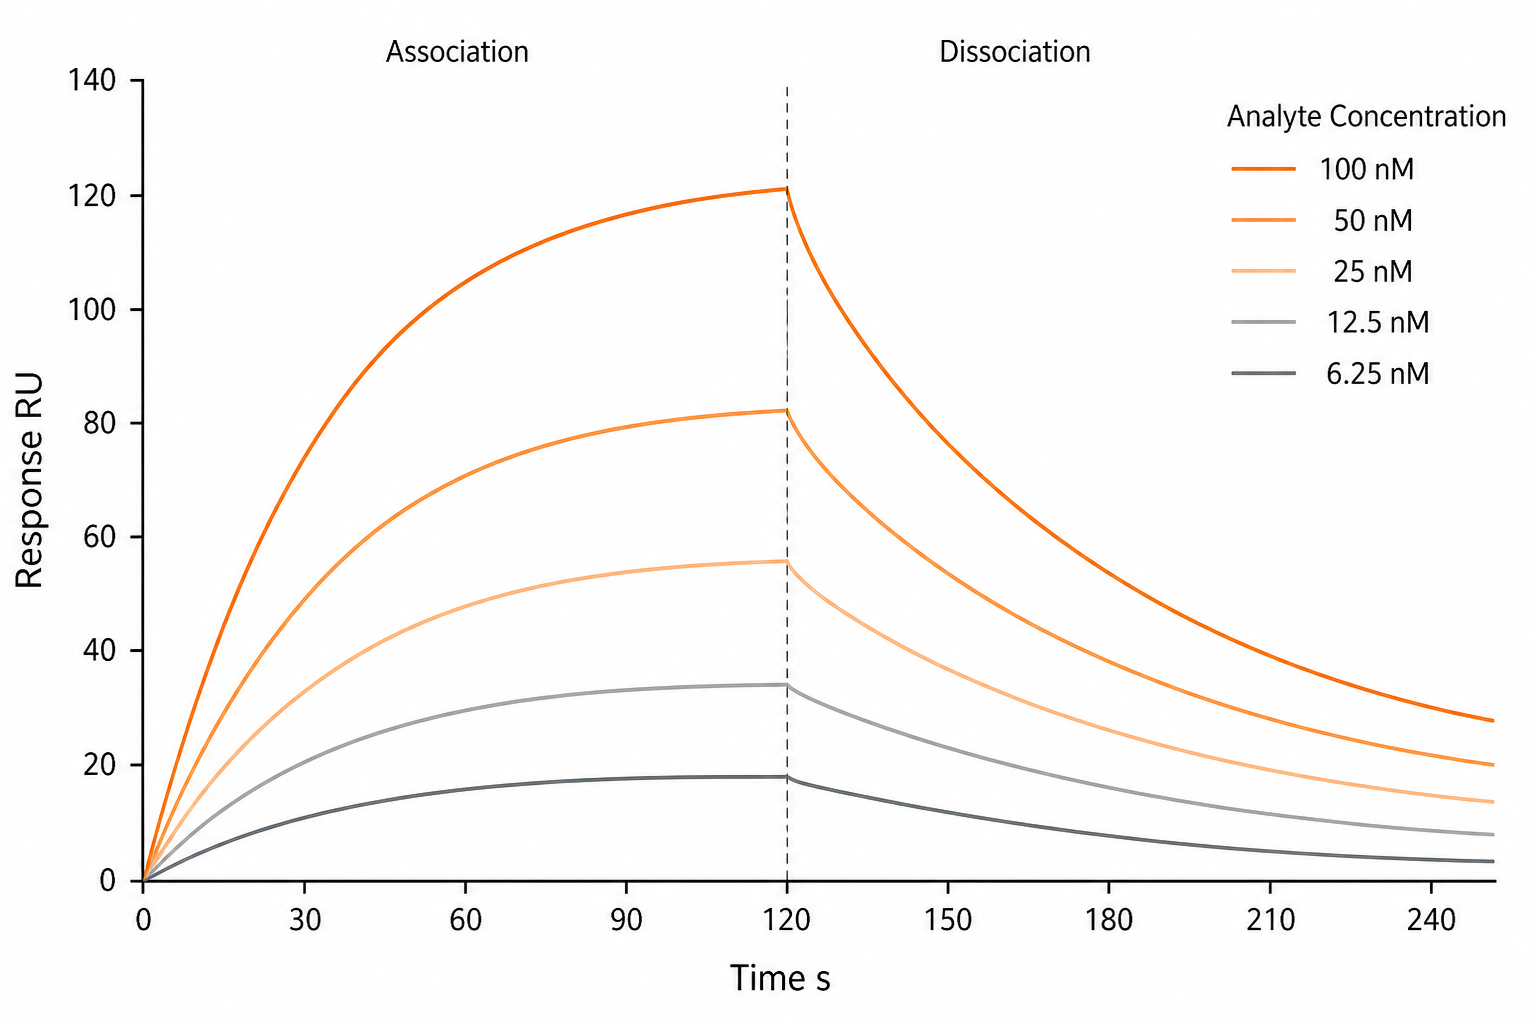
When analyte binds the ligand, mass builds up at the surface, the refractive index changes and the resonance angle shifts. The shift is recorded continuously as a sensorgram (response versus time), showing association while analyte flows and dissociation once buffer alone resumes. No fluorophore, radiolabel or enzyme tag is needed.
Because the readout follows how the resonance condition of the surface plasmon shifts as the surface changes, the technique is also called surface plasmon resonance spectroscopy. The response scales with the mass that binds, so a large protein produces a bigger signal than a small molecule at the same occupancy, which is one reason assay design starts with which partner is immobilized.
SPR data can report four things: kinetics (how fast binding and unbinding happen), affinity (equilibrium binding strength), specificity (binding to the intended partner versus reference or off-target surfaces) and concentration (an unknown analyte's concentration read against a calibration curve). One well-designed experiment often answers more than one.
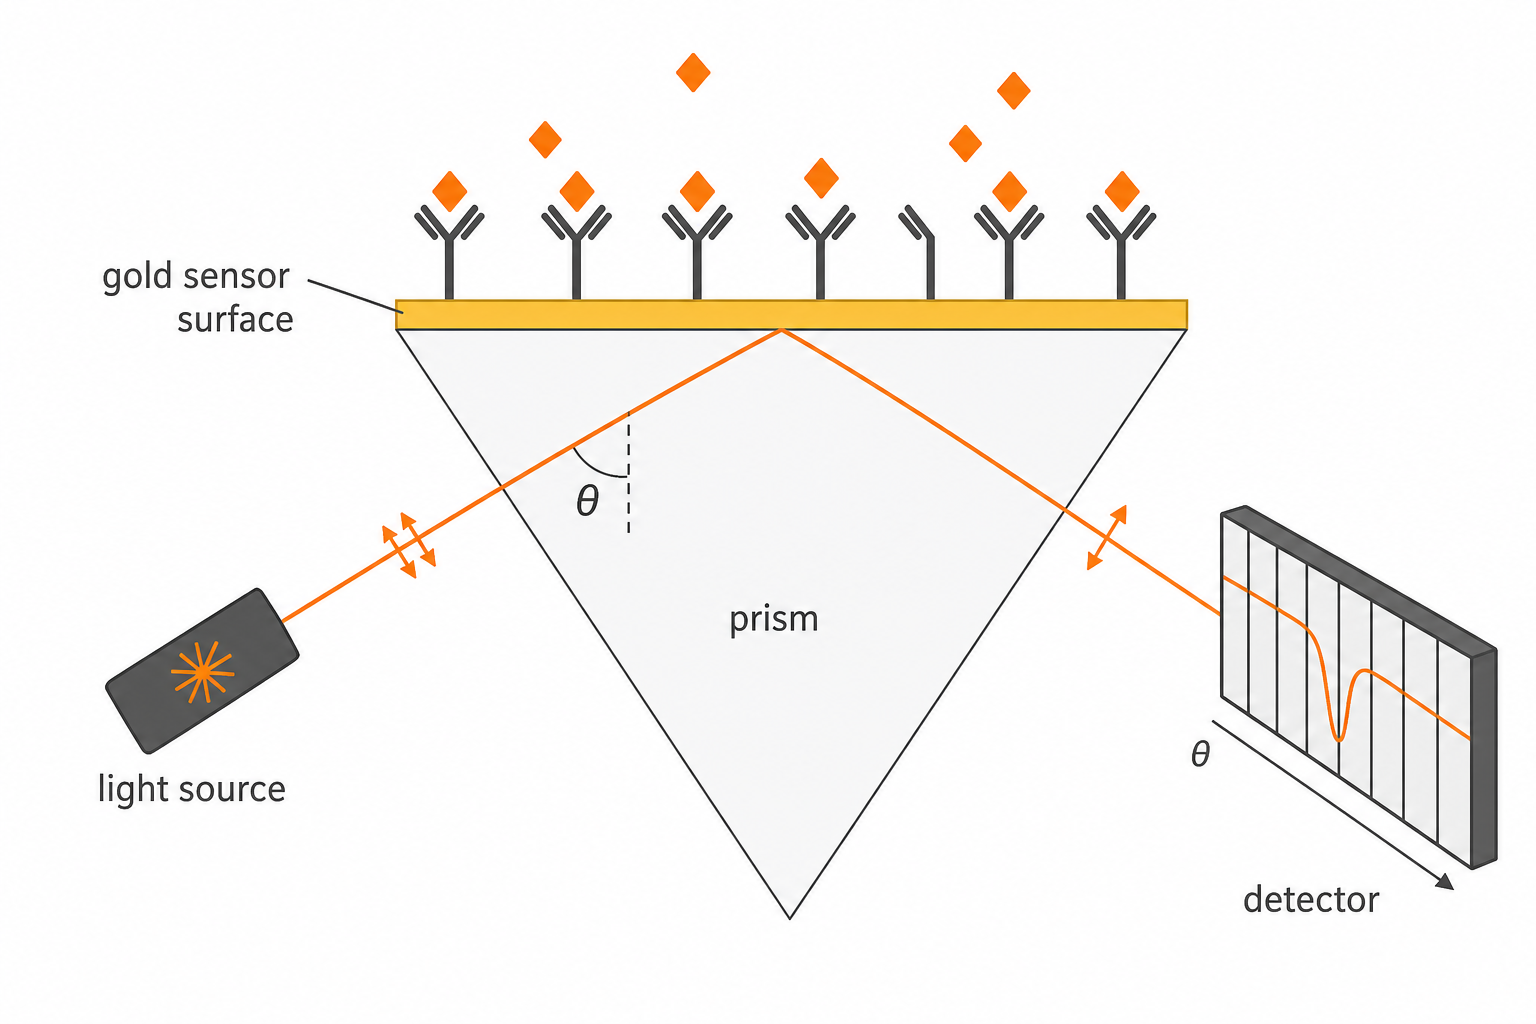
Every binding cycle in the surface plasmon resonance method follows the same sequence, and the sensorgram records each stage:
SPR detects any binding that adds mass to the surface, so it is not limited to one class of molecule. Common interaction types, their typical research uses and the discovery decisions they inform:
| Interaction type | Typical research use | Decision it informs |
|---|---|---|
| Protein–protein | Confirming target engagement, mapping complex assembly, comparing wild-type and mutant binding | Whether a target pair truly engages, and how an engineered variant changes that binding |
| Antibody–antigen | Ranking hybridoma or phage-display hits, confirming target specificity before downstream work | Which antibody hits advance, ordered by affinity and off-rate |
| Antibody–receptor | Characterizing antibodies against cell-surface receptors, Fc receptor engagement studies | Receptor engagement strength and the effect of Fc or format changes |
| Protein–small molecule | Fragment and hit validation, structure–activity relationship (SAR) support, residence-time comparison of inhibitors | Which hits are genuine binders and which analogs to make next |
| Protein–nucleic acid | Transcription factor–DNA binding, aptamer characterization, RNA-binding protein studies | Sequence preference and which aptamer or binding construct to carry forward |
| Protein–lipid / membrane protein | Peripheral membrane protein binding, liposome-based studies of transmembrane targets | Whether a target binds as expected in a bilayer context, where a soluble form may not predict it |
Each can be run as a multi-cycle titration, a single-cycle kinetic experiment or a qualitative yes/no binding check.
A kinetics experiment produces a small set of values, each useful in a different way for ranking candidates:
These values come from fitting a binding model to the sensorgrams, usually a 1:1 Langmuir model, with two-state or heterogeneous-ligand models when the data show more than one binding mechanism. Fitted curves are reported next to the raw traces so you can see how well the model describes the data.
Ranking on KD alone can hide useful differences. Two candidates with the same KD may reach it by different routes, one binding fast and releasing fast, the other binding slowly and releasing slowly. Reporting ka and kd together with KD lets you rank candidates on the property your program cares about, whether that is speed of engagement, residence time or overall affinity.
SPR data quality is mostly set before the first injection. Each project starts with a feasibility review of your ligand and analyte:
Deciding which partner to immobilize as ligand and which to flow as analyte. The smaller, more stable or more plentiful molecule is usually the analyte.
Direct amine coupling or a capture system (biotin/streptavidin, His-tag/NTA, Fc capture with Protein A/G), chosen from your reagent's tags and stability.
An analyte range that brackets the expected KD, typically about 0.1–10× that value.
A running buffer suited to the biology, plus a blank reference flow cell to subtract bulk refractive-index and non-specific signal.
A condition that strips bound analyte between cycles without damaging ligand activity.
A short pilot run to check capture level, surface stability and regeneration usually costs far less than finding a buffer problem partway through a full titration. If you do not yet have a purified ligand or binding partner, Boster can make one through custom antibody production or recombinant protein expression.
Surface chemistry is chosen to match how your ligand is best presented. Available surfaces:
| Surface | Immobilization chemistry | Suited to |
|---|---|---|
| Carboxymethyl dextran (CM5-type) | Covalent amine coupling (thiol or aldehyde coupling as alternatives) | General covalent immobilization of proteins and peptides through free amine, thiol or aldehyde groups |
| Streptavidin capture (SA-type) | Capture of biotinylated ligand through near-irreversible streptavidin–biotin binding | Biotinylated proteins, peptides or nucleic acids that need a stable, oriented surface |
| NTA / His capture | Nickel-chelate capture of His-tagged ligand | His-tagged recombinant proteins; reversible, oriented capture without chemical modification |
| Protein A capture | Capture through the antibody Fc region | Antibodies of Protein A-compatible species and subclasses, oriented by Fc |
| Protein G capture | Capture through the antibody Fc region, with broader subclass coverage than Protein A | Human and a wider range of mammalian antibody subclasses |
| Lipid capture (L1-type) | Direct capture of liposomes and vesicles with the bilayer kept intact | Membrane-protein and protein–lipid studies that need a bilayer context |
Amine coupling to carboxymethyl dextran is covalent and attaches the ligand at any accessible lysine or at the N-terminus, so it can reduce activity when an amine sits near the binding site. Capture surfaces (streptavidin, NTA/His, Protein A/G) usually give more uniformly oriented, active ligand and are the better choice when a suitable tag or Fc region is available.
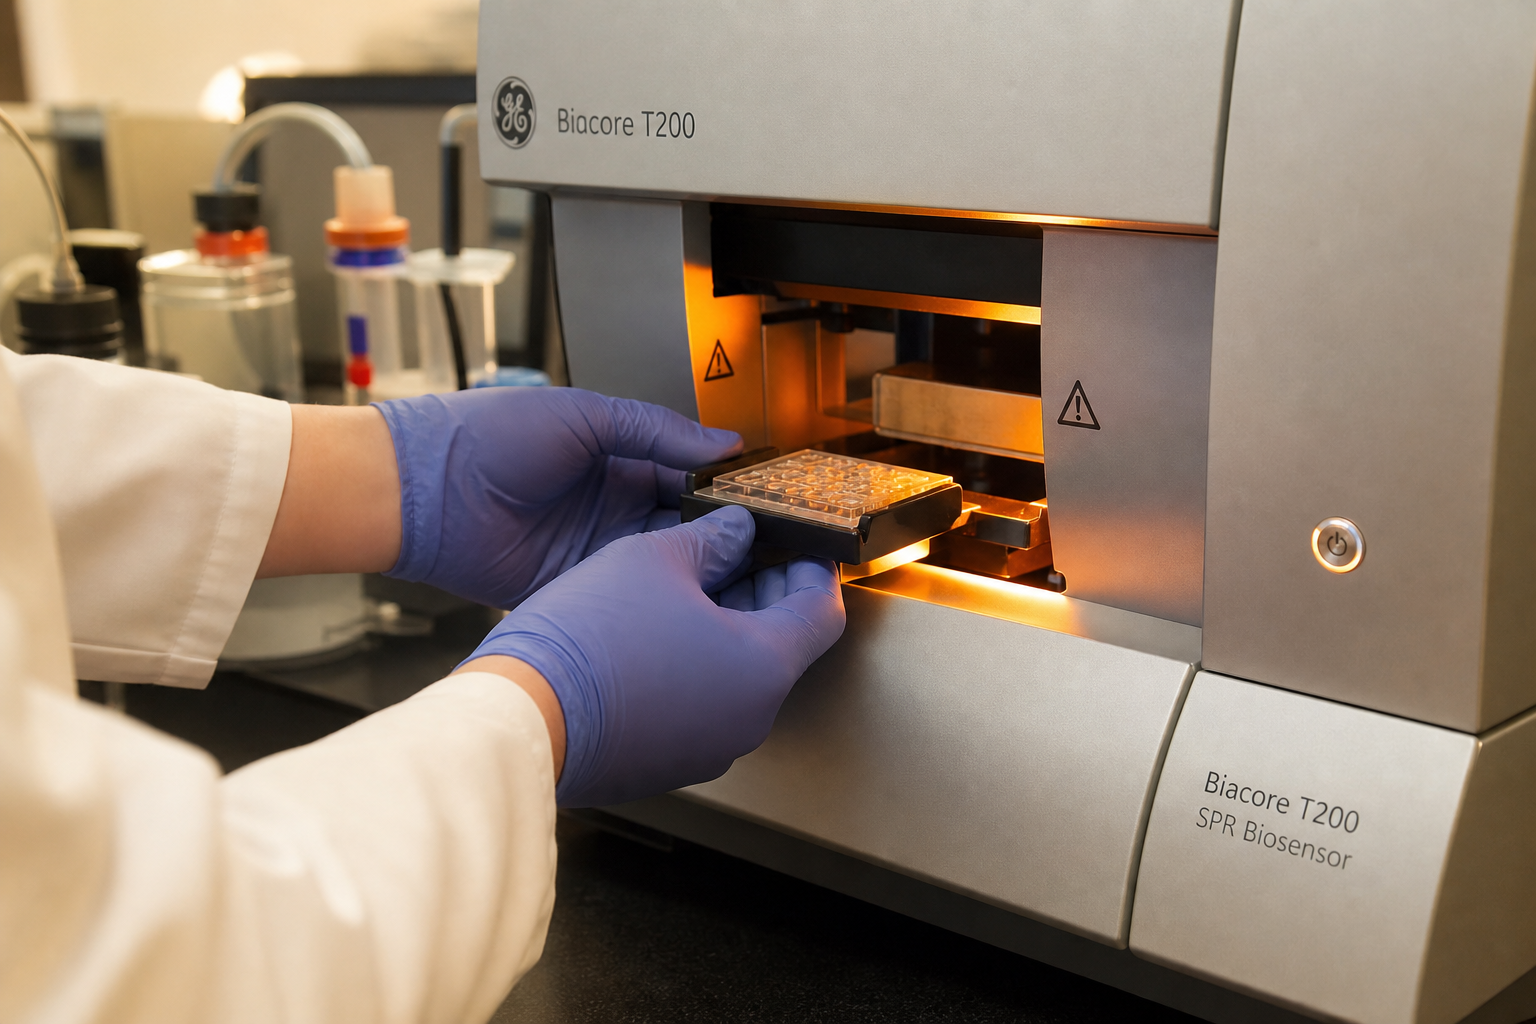
SPR instruments differ in how many interactions they can read at once, how sensitive they are to small analytes and how many samples they can run unattended. The platform for your project is matched to the question being asked and confirmed at quote. Three practical formats cover most requests:
One to a few flow cells read in sequence. Well suited to feasibility checks, surface and buffer scouting and pilot runs, where flexibility matters more than sample volume.
Best for: exploratory work and assay scoutingSeveral parallel flow channels with an automated sampler. Parallel reference surfaces and unattended cycling support full kinetic series and good sensitivity for smaller analytes.
Best for: fitted kinetics on a shortlistSurface plasmon resonance imaging reads many ligand spots on one chip at once. Multiplexing is high, but sensitivity per spot is generally lower than flow-cell systems, so it favors ranking and screening.
Best for: panel screening and ranking| Consideration | Exploratory study | Decision-critical study |
|---|---|---|
| Goal | Does binding occur, and under what conditions | A fitted ka, kd and KD you can use to select a candidate |
| Sensitivity | Adequate for large analytes; small molecules may need scouting | Matched to analyte size, with surface density tuned to the expected signal |
| Multiplexing | Many candidates, one condition, often a single concentration | Fewer candidates, full bracketed concentration series with replicates |
| Assay complexity | Simple capture, minimal optimization | Optimized capture, regeneration scouting and mass-transport checks |
| Reporting | Ranking or yes/no outcome | Fitted models, fit statistics and QC criteria for every condition |
Throughput depends on more than the instrument. A multi-cycle kinetic series needs several analyte concentrations plus blank cycles, each followed by regeneration, so sample count and cycle time grow with assay complexity. Single-cycle kinetics removes the regeneration step between concentrations and suits ligands that do not tolerate harsh regeneration. All work is performed as non-GLP research studies, so these formats suit discovery and development research rather than regulated submissions.
To scope a project we need to know what each molecule is and what buffer it is in. Amounts depend on the assay design and are confirmed at quote.
| Molecule type | What we need to know | Amount |
|---|---|---|
| Protein (ligand or analyte) | Purity, molecular weight, tags (His, biotin, Fc), buffer composition, concentration | Confirmed at quote |
| Antibody | Species and subclass (for Protein A/G capture), purity, buffer composition, concentration | Confirmed at quote |
| Nucleic acid | Sequence and length, biotin or other labels, buffer composition | Confirmed at quote |
| Small molecule | Supplied as a DMSO stock; molecular weight, stock concentration, aqueous solubility | Confirmed at quote |
| Liposome or membrane protein | Lipid composition, vesicle preparation, any detergent present | Confirmed at quote |
Flag these before you ship a sample. Several common additives interfere with immobilization or add bulk signal:
None of these rule out a project. They change the surface chemistry, buffer exchange or reference strategy, which the feasibility review sorts out.
When a sample arrives in an incompatible buffer, the usual fixes are buffer exchange by desalting or dialysis into the running buffer, dilution below the level at which an additive interferes, removal of imidazole before NTA capture, or a switch to a capture chemistry that is not affected. Samples that are aggregated or heterogeneous may need an extra polishing step before injection. Tell us what is in your buffer and we will recommend the least disruptive route.
Turnaround is quoted per project. It depends mainly on how much assay development the ligand needs and on the size of the analyte panel.
Each project report includes:
Biological samples rarely give textbook 1:1 kinetics. A KD reported without its fit quality can mislead a project, so the report states how well each model fits and notes where a two-state or other model describes the data better.
We check tags, buffer and molecule sizes, then agree the surface chemistry and reference strategy.
A short test of capture level, surface stability and regeneration before committing the full panel.
Titrations or screening cycles with blanks, duplicates and controls interspersed.
Processed data, fitted models, kinetic tables, QC notes and expert interpretation.
Early-stage work often needs a relative ranking more than full kinetics. Screening formats:
Yes/no binding checks across a candidate panel to confirm hits from a primary screen before full kinetics.
Many candidates compared against one target under identical conditions, ordered by apparent affinity or response.
Sequential or premixed injections of antibody pairs to sort a panel into groups that bind overlapping or distinct epitopes.
Testing whether a candidate blocks a known binder, to check mechanism of action against a reference ligand.
Single-cycle kinetics or a reduced concentration series across a wider panel, for an approximate ka, kd and KD ranking.
Multiplexed surface plasmon resonance imaging (SPRi) reads many ligand spots on one sensor surface at once and is available on request, for example to rank a panel of candidates against several targets in parallel.
Screening versus characterization. A screening ranking compares many candidates under identical conditions with less time per candidate. Full characterization runs a longer, bracketed concentration series on a shortlist to give a fitted KD. The two are reported as separate deliverables so a ranking is not read as a final kinetic result.
SPR also picks up signal that has nothing to do with binding. Common artifacts and how they are controlled:
| Artifact | What it looks like | How it's controlled |
|---|---|---|
| Non-specific binding | Signal on a reference surface with no immobilized ligand | Blank/reference flow-cell subtraction; surface blocking |
| Mass-transport limitation | Association looks linear rather than exponential; kinetics depend on flow rate | Lower immobilization density; higher flow rate; check that rate constants do not change with flow rate |
| Bulk refractive-index shift | An instant, uniform jump in signal at injection start unrelated to binding | Buffer-matched reference subtraction; matched DMSO and excipient levels; solvent correction |
| Aggregation | Unusually high or erratic response, poor fit to any standard model | Sample QC (SEC or DLS) before injection; filtration |
| Carryover between cycles | Baseline drifts upward cycle over cycle | Extended buffer wash; verified regeneration step; blank cycles interspersed |
| Poor surface regeneration | Capture or response amplitude declines across the run | Regeneration scouting during assay development; surface activity checks between titrations |
Before data go into a report, they are checked for reproducibility between duplicate injections, a stable reference baseline and a residuals pattern consistent with the chosen binding model. Data that fail these checks are flagged in the report with the reason, rather than forced into a fit.
SPR binding data supports several stages of discovery research:
Depending on the study, the deliverables handed back for these applications include:
Higher purity gives cleaner sensorgrams and more reliable fits, since contaminating species can bind non-specifically or interfere with immobilization. Standard chromatography-grade purity is recommended for kinetic work, and extra polishing steps can be discussed during assay design if a sample shows aggregation or heterogeneity on initial QC.
Yes, though very fast dissociation (high kd) or very weak affinity is harder to resolve. These cases often need higher analyte concentrations, careful mass-transport control and sometimes a different capture orientation. A feasibility discussion before you commit sample is worthwhile here.
Endpoint assays such as ELISA report a single signal after a fixed incubation, which folds affinity and kinetics into one number. SPR follows the whole binding event, separating how fast a complex forms from how tightly it holds. If an endpoint assay suits your project better, see Boster's ELISA assay development services.
Tell us in advance. A buffer exchange, a different capture chemistry or a modified reference strategy usually resolves it without you reformulating the sample.
They share the same physics but differ in format. Surface plasmon resonance spectroscopy usually refers to flow-cell measurements that follow the resonance shift on a few surfaces in detail, which suits full kinetics. Imaging reads many spots on one chip at once, which suits screening and ranking. The right choice depends on whether you need depth on a shortlist or breadth across a panel.
Yes. Screening formats such as hit confirmation, ranking, epitope binning and single-cycle kinetic screening handle larger panels than full kinetic characterization. They give a relative order or an approximate kinetic ranking, and a shortlist can then be taken forward to a full concentration series for fitted values.
Send your ligand and analyte details. We will go through surface chemistry, sample needs and turnaround before any sample ships.
Request a Quote