This website uses cookies to ensure you get the best experience on our website.


- Table of Contents
Real validated ABI2 Western blot protocols, expected-band and isoform facts, troubleshooting for weak or shifted signal, and recommended anti-ABI2 WB antibodies. Everything you need to plan the experiment before you commit precious samples.
Expected bands, validated protocols, controls and antibodies — the at-a-glance facts below, then the full design guide.
| Expected band | ~55.7 kDa | |
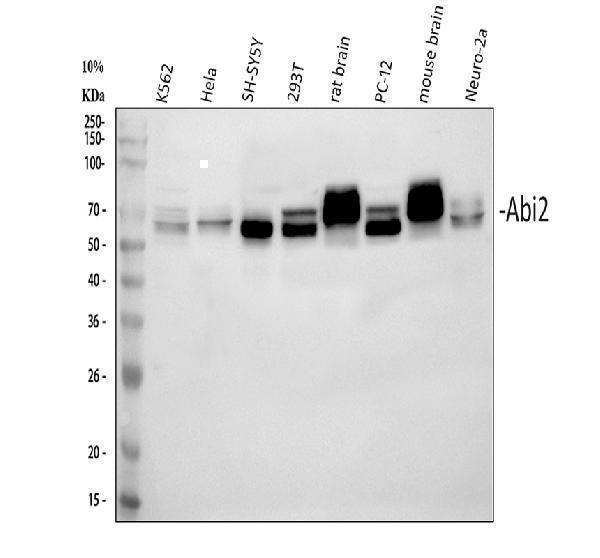
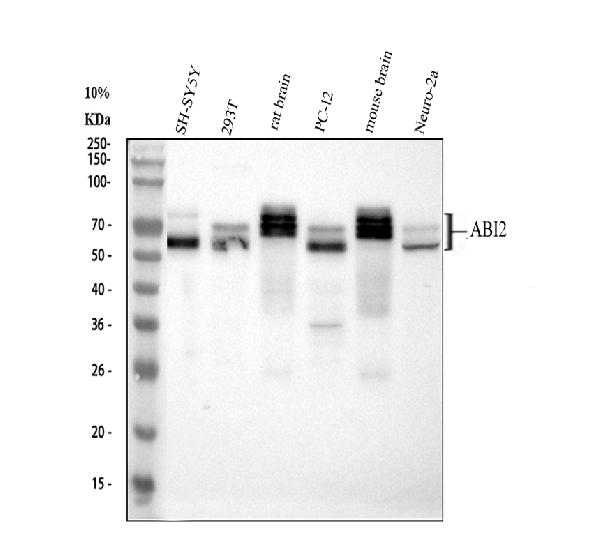
| Observed band | 60 kDa | |
| Gel | 10–12% | |
| Positive control | Adrenal gland+4 more · see all | |
| Negative control | Adipose tissue+4 more · see all |
| PTM | Phosphorylated | |
| Caveat | Phosphorylation shift | |
| Regulation | LPS-induced | |
| Isoform | 4 isoform(s) |
Literature-validated Western blot parameters for ABI2 — gel percentage, transfer, blocking, antibody incubation and detection, extracted from published methods.
| Sample / lysate | human K562, human Hela, human SH-SY5Y |
| Gel % | 5–20% |
| Load | 30 ug |
| Transfer | nitrocellulose membrane, 150 mA, 50–90 min |
| Membrane | nitrocellulose |
| Blocking | 5% non-fat milk / TBS, 1.5 h RT |
| Primary antibody | 0.5 µg/mL |
| Primary incubation | overnight at 4 °C |
| Secondary antibody | goat anti-rabbit IgG-HRP, 1:5000 |
| Wash | TBS-0.1% Tween, 3 × 5 min |
| Detection | ECL |
| Exposure / imaging | Tanon 5200 |
| Observed band | 56–70 kDa |
ABI2 has a 55.7 kDa backbone but typically runs at about 60 kDa, with extra nearby bands most plausibly reflecting phosphorylation and alternative splicing.
| Single band around 60 kDa | full-length ABI2 detected near its expected apparent size |
| Several close bands or a doublet near 60 kDa | alternative ABI2 isoforms and/or different phosphorylation states are being resolved |
| Band slightly above the 55.7 kDa prediction | apparent mobility is shifted modestly upward relative to the calculated backbone mass |
| Clear band in whole-cell lysate | fits a cytoplasmic and nuclear intracellular protein |
| 55.7 kDa predicted molecular mass | sets the backbone size expected for the full-length protein |
| phosphorylation at Ser40 | can contribute to a small upward mobility shift or band splitting |
| phosphorylation at Ser183 | can contribute to a small upward mobility shift or band splitting |
| phosphorylation at Ser227 | can contribute to a small upward mobility shift or band splitting |
| phosphorylation at Thr361 | can contribute to a small upward mobility shift or band splitting |
| phosphorylation at Ser368 | can contribute to a small upward mobility shift or band splitting |
| isoforms 1, 2, 3 and 4 | can produce multiple ABI2 bands of different relative sizes |
| Situation | Likely cause | Next action |
|---|---|---|
| Band higher than expected | phosphorylated ABI2 can migrate slightly slower than the 55.7 kDa backbone and appear near 60 kDa | treat the 60 kDa band as expected native ABI2 and compare with phosphatase-treated or differently stimulated samples if needed |
| Band lower than expected | a shorter ABI2 splice isoform may be enriched | check whether the antibody epitope is shared across isoforms and compare patterns across cell types |
| Multiple bands | ABI2 has four splice isoforms and documented phosphorylation sites | expect isoform and phosphoform heterogeneity and confirm specificity by knockdown or an independent antibody |
| Weak or no signal | ABI2 abundance may be low in the tested sample despite being intracellular | use whole-cell lysate from a known positive line or brain-derived sample and increase input or exposure |
| No band in lysate | the sample may express little ABI2 or the antibody may not recognize the present isoform well | verify expression in another positive lysate and confirm that the antibody target region is retained in expressed isoforms |
| Fragments below expected size | lower bands are more consistent with proteolysis because no signal peptide or propeptide cleavage is annotated | improve protease inhibition and sample handling and prioritize the intact 60 kDa band |
Comprehensive Human Protein Atlas IHC scoring per tissue. Rows are taken directly from the HPA tissue chart — click any row's HPA link to view the source.
| Tissue | Cell type | Level | Evidence | Source |
|---|---|---|---|---|
| Adrenal gland | glandular cells | High | Protein (IHC) | HPA → |
| Cerebellum | Purkinje cells | High | Protein (IHC) | HPA → |
| Cerebral cortex | neuronal cells | High | Protein (IHC) | HPA → |
| Breast | glandular cells | Medium | Protein (IHC) | HPA → |
| Bronchus | ciliated cells (cell body) | Medium | Protein (IHC) | HPA → |
| Tissue | Cell type | Level | Evidence | Source |
|---|---|---|---|---|
| Adipose tissue | adipocytes | Not detected | Protein (IHC) | HPA → |
| Bone marrow | hematopoietic cells | Not detected | Protein (IHC) | HPA → |
| Epididymis | glandular cells | Not detected | Protein (IHC) | HPA → |
| Heart muscle | cardiomyocytes | Not detected | Protein (IHC) | HPA → |
| Liver | cholangiocytes | Not detected | Protein (IHC) | HPA → |
Deeper troubleshooting and optimisation questions for ABI2, answered from its protein features.
BosterBio's ABI2 antibodies are among the best-performing WB antibodies on the market — well cited, thoroughly validated, and orthogonally cross-validated against negative tissues and complementary methods.
These recommended anti-ABI2 antibodies represent Boster’s best-performing, well-cited reagents for Western blot, thoroughly validated and orthogonally cross-validated against negative tissues and complementary methods to support confident ABI2 detection.
Which to pick: For ABI2 Western blot, both A04302 and PA2068 include WB validation images. Choose based on your preferred antibody format or host from the product cards, since both are catalogued with direct WB evidence.