This website uses cookies to ensure you get the best experience on our website.


- Table of Contents
Use this ANAPC2 paraffin IHC guide to plan chromogenic staining with the catalog antibody (datasheet A06153-1). Rectal glandular cells show high staining, while nuclear signal occurs in subsets of cells across tissues (HPA tissue IHC).

Expected localisation, validated protocols, controls and antibodies — the at-a-glance facts below, then the full design guide.
| Expected localisation | Nuclear staining in subsets of tissue cells (HPA tissue IHC) | |
| Staining pattern | Nuclear signal in subsets of cells across several tissues (HPA tissue IHC) | |
| Antigen retrieval | EDTA pH 8.0 HIER, heat-mediated (datasheet A06153-1) | |
| Positive control | Appendix+4 more · see all | |
| Negative control | Adipose tissue+4 more · see all |
| Fixation | Keep fixation consistent across paraffin sections (standard IHC practice; not target-specific) | |
| Caveat | Staining is restricted to cell subsets within tissues (HPA tissue IHC) | |
| Regulation | Cell-cycle activity; stain effect unknown (UniProt) | |
| Isoform / epitope | 2 isoforms; epitope coverage needs checking (UniProt) |
The catalog antibody uses EDTA pH 8.0 heat retrieval (datasheet A06153-1). The published CD34/ANAPC2 chromogenic IHC protocol below uses citrate retrieval (PMC5609928).
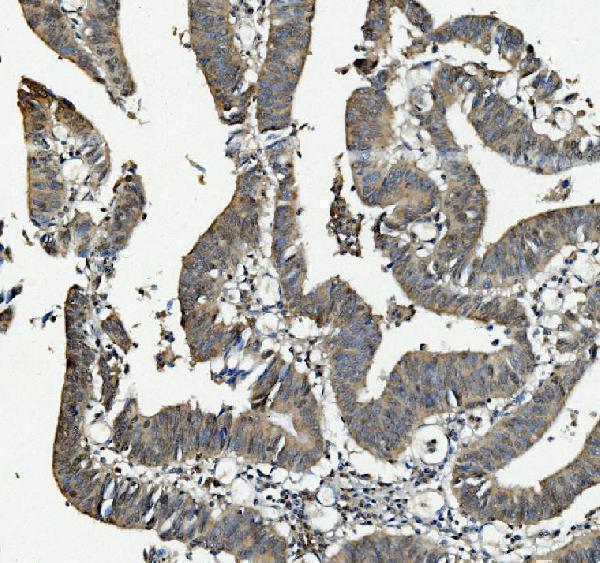
| Sample | Paraffin-embedded human rectal cancer tissue; fixative not specified (datasheet A06153-1) |
| Fixation | Image fixative and duration unreported (datasheet A06153-1); verify before use. |
| Sectioning | 4–5 µm sections on charged slides (standard) |
| Deparaffinisation | Xylene, graded ethanol series to water (standard) |
| Antigen retrieval | Heat retrieval: EDTA pH 8.0 (datasheet A06153-1); 20 min, 95–100 °C (standard) |
| Peroxidase block | 3% H2O2, 10 min, room temperature (standard) |
| Blocking | 10% goat serum (datasheet A06153-1) |
| Primary antibody | Rabbit anti-ANAPC2, 2-5μg/ml (datasheet A06153-1) |
| Primary incubation | Overnight at 4 °C (datasheet A06153-1) |
| Detection | Streptavidin-biotin complex (SABC), DAB chromogen (datasheet A06153-1) |
| Counterstain | Hematoxylin, blue, dehydrate and mount (standard) |
| Expected result | ANAPC2-positive staining in glandular cells of appendix (HPA tissue IHC: High). HPA tissue profile: Nuclear expression in a subset of cells of several different tissues. No signal in the no-primary control. |
ANAPC2 staining in paraffin sections should be predominantly nuclear in a subset of cells, including appendix and colon glandular cells and lymph node germinal center cells (HPA: tissue IHC profile; High in these cell types). The tissue IHC assessment is Enhanced, with medium consistency between staining and RNA expression (HPA: reliability). ANAPC2 has no annotated transmembrane segment (UniProt Q9UJX6 topology).
| Strong nuclear staining in glandular cells of appendix, colon, duodenum or rectum, or germinal center cells of tonsil or lymph node (HPA: High in these cell types). | This fits the reported IHC pattern when staining is confined to a subset of cells (HPA: nuclear expression in a subset of cells). Compare nuclei within the same tissue; a uniformly positive section is not the reported pattern. |
| Predominantly membranous, extracellular or diffuse cytoplasmic staining, with little nuclear signal (HPA: nuclear tissue IHC profile). | Treat this as a compartment mismatch and investigate staining artefact or antibody specificity. The absence of a transmembrane segment does not support a membrane pattern (UniProt Q9UJX6 topology). Mitochondrial signal is an additional ICC-IF observation, not the principal tissue IHC pattern (HPA: subcellular). |
| Prominent staining of adipocytes, cardiomyocytes or skeletal myocytes (HPA: Not detected in these cell types). | Suspect cross-reactivity or endogenous detection activity if these cells are strongly positive, especially without the expected nuclear staining in a control section (HPA: tissue IHC profile; general IHC practice). A reported negative is a comparison point, not proof that every specimen must be blank. |
| Broad haze across nuclei, cytoplasm and tissue spaces, obscuring individual positive cells (HPA: nuclear staining in a subset of cells). | The distribution cannot be scored reliably as ANAPC2. Check background controls, blocking, washes and detection conditions using general IHC practice; diffuse colour alone does not establish where the target is expressed. |
| No nuclear signal in appendix or colon glandular cells, or lymph node germinal center cells (HPA: High in these cell types). | Consider failed detection, inadequate assay sensitivity or specimen variation before calling the target absent (general IHC practice). HPA reports cell-specific staining, so confirm that the expected cell population is present and assess a control section. |
| Tissue and cell selection (HPA: tissue IHC) | HPA reports High staining in specified glandular, hematopoietic and germinal center cells, but Not detected in several other named cell populations (HPA: tissue IHC). Select and read controls by cell type, since a tissue name alone can conceal a mixed population. |
| Antibody evidence (HPA: antibody validation) | The tissue IHC assessment is Enhanced, and CAB018692 has Enhanced IHC validation; HPA066539 has no supplied IHC rating (HPA: antibody list; tissue reliability). Apply the observed tissue pattern to an IHC-validated antibody and evaluate another reagent on its own evidence. |
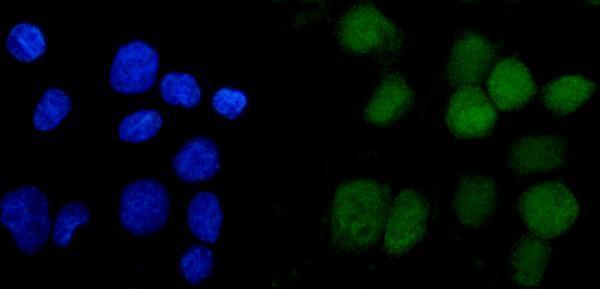
| IF/ICC: where should ANAPC2 appear? (HPA: subcellular) | Mainly in the nucleoplasm, with an additional mitochondrial location in ICC-IF (HPA: supported nucleoplasm; approved mitochondria). This answers the IF/ICC localisation question; the mitochondrial observation should not override the predominantly nuclear paraffin IHC expectation (HPA: tissue IHC profile). |
| Protein form and epitope (UniProt Q9UJX6) | UniProt lists 2 isoforms and no signal peptide, propeptide or transmembrane segment (UniProt Q9UJX6). The supplied record gives no antibody epitope, so isoform coverage and epitope-dependent staining cannot be predicted from it. |
| Detection chemistry (general IHC practice) | Endogenous enzyme activity and nonspecific reagent binding can add chromogenic colour (general IHC practice). Review controls before interpreting colour in an HPA Not detected cell type as ANAPC2; this is a general assay consideration, not an ANAPC2-specific property. |
| Situation | Likely cause | Next action |
|---|---|---|
| Expected positive cells are blank (HPA: High in appendix and colon glandular cells). | The relevant cells may be absent from the section, or the assay may lack detectable signal (general IHC practice). | Verify the cell population on the counterstain, then check an appropriate positive control and the IHC-validated antibody's documented conditions (HPA: tissue IHC; general IHC practice). Do not infer ANAPC2 fixation sensitivity from this result. |
| Colour appears mainly at membranes or outside cells (HPA: nuclear tissue IHC profile). | This differs from the reported nuclear distribution and may reflect background or nonspecific binding (HPA: tissue IHC; general IHC practice). | Compare with a negative detection control and inspect nuclei in a known-positive cell population. Reassess antibody specificity before scoring this colour as ANAPC2 (general IHC practice). |
| Adipocytes or cardiomyocytes stain strongly (HPA: Not detected in these cell types). | Cross-reactivity or endogenous detection activity is possible; the HPA pattern does not support these cells as routine positive controls (HPA: tissue IHC; general IHC practice). | Examine a control omitting primary antibody and compare the suspect cells with an expected nuclear-positive population in a separate control section (HPA: tissue IHC; general IHC practice). |
| Diffuse colour hides the boundary between positive and negative cells (HPA: subset nuclear profile). | Excess background may come from nonspecific binding, incomplete washing or detection chemistry (general IHC practice). | Check negative controls and review blocking, washes and detection settings. Score only discrete nuclear staining in identifiable cells (general IHC practice; HPA: tissue IHC profile). |
| Every cell is called positive despite visibly mixed staining (HPA: nuclear expression in a subset of cells). | A tissue-wide score can miss the reported cell-specific pattern; HPA also reports low tissue RNA specificity (HPA: tissue IHC and RNA specificity). | Record the stained cell type, nuclear localisation and fraction of cells rather than assigning one score to the whole tissue (HPA: tissue IHC profile; general IHC practice). |
| Mitochondrial-looking IF signal is treated as the expected paraffin IHC result (HPA: subcellular ICC-IF). | The additional mitochondrial location comes from ICC-IF, while tissue IHC reports nuclear expression in a subset of cells (HPA: subcellular; tissue IHC). | Interpret each application against its own HPA observation: assess nucleoplasm and possible mitochondria in IF/ICC, and cell-specific nuclear staining in paraffin IHC (HPA: subcellular; tissue IHC). |
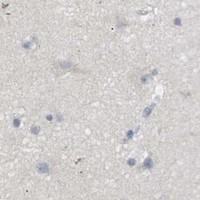


Comprehensive Human Protein Atlas IHC scoring per tissue (reliability: Enhanced — Medium consistency between antibody staining and RNA expression data.). Rows are taken directly from the HPA tissue chart — click any row's HPA link to view the source.
| Tissue | Cell type | Level | Evidence | Source |
|---|---|---|---|---|
| Appendix | Glandular cells | High | Protein (IHC) | HPA → |
| Bone marrow | Hematopoietic cells | High | Protein (IHC) | HPA → |
| Colon | Glandular cells | High | Protein (IHC) | HPA → |
| Duodenum | Glandular cells | High | Protein (IHC) | HPA → |
| Lymph node | Germinal center cells | High | Protein (IHC) | HPA → |
| Tissue | Cell type | Level | Evidence | Source |
|---|---|---|---|---|
| Adipose tissue | Adipocytes | Not detected | Protein (IHC) | HPA → |
| Cerebral cortex | Endothelial cells | Not detected | Protein (IHC) | HPA → |
| Heart muscle | Cardiomyocytes | Not detected | Protein (IHC) | HPA → |
| Hippocampus | Glial cells | Not detected | Protein (IHC) | HPA → |
| Ovary | Ovarian stroma cells | Not detected | Protein (IHC) | HPA → |
Troubleshoot ANAPC2 staining in paraffin sections by checking retrieval, nuclear localization, cell type, controls, and scoring before interpreting chromogenic signal.
The catalog antibody A06153-1 has IHC data from a human paraffin section and IF data from A431 cells (IHC/IF captions). Listed reactivity includes human, monkey, mouse, and rat (catalog).
A06153-1 will render with an IHC image from a paraffin section of human rectal cancer tissue (IHC caption). The same SKU supports IF/ICC and has an IF image from A431 cells (catalog applications; IF caption).
Which to pick: For tissue IHC, choose A06153-1 at 2–5 μg/mL for human paraffin sections (catalog IHC dilution; IHC caption); the fixative is unreported (IHC caption). For IF/ICC, the same SKU is listed at 5 μg/mL for human samples, with IF shown in A431 cells (catalog applications and IF dilution; IF caption). For cross-species work, this SKU lists monkey, mouse, and rat reactivity, although the supplied IHC and IF images show human samples only (catalog reactivity; IHC/IF captions); clonality is unreported (catalog clone field).