ANXA3 / Annexin A3 · IHC design guide

Design Immunohistochemistry for ANXA3

Plan ANXA3 staining in paraffin sections using the cytoplasmic tissue pattern reported by HPA (HPA tissue IHC). Compare cell-specific staining with suitable positive and negative controls (HPA tissue IHC).

Evidence assembled Oct 2026 · For research use; verify linked source records and product datasheet before use
Immunohistochemistry protocol sheet for ANXA3 (IHC for ANXA3): expected localisation Variable cytoplasmic staining (HPA tissue IHC), antibody A04796, validated IHC image, and IHC protocol steps
Printable ANXA3 IHC protocol sheet — expected localisation Variable cytoplasmic staining (HPA tissue IHC), antibody A04796, controls and protocol steps. Open the full ANXA3 IHC guide →

ANXA3 Immunohistochemistry Experimental Design Guide

Expected localisation, validated protocols, controls and antibodies — the at-a-glance facts below, then the full design guide.

Must know before staining
Expected localisation Variable cytoplasmic staining (HPA tissue IHC)
Staining pattern Cytoplasmic staining in variable cell populations across most tissues (HPA tissue IHC)
Antigen retrieval Citrate pH 6 HIER, heat-mediated (datasheet A04796)
Positive control ⓘ Appendix+4 more · see all
Negative control ⓘ Adrenal gland+4 more · see all
Important caveats
Reasons your staining may differ from the expected pattern.
Fixation Matched tissue-IHC evidence does not establish the fixation claim. Validate the specimen-specific method before use. (selected-SKU IHC image A04796)
Caveat Cell-specific staining may be missed in whole-section scoring (HPA tissue IHC)
Regulation Staining intensity varies by tissue (HPA tissue IHC)
Isoform / epitope No isoforms annotated; chain spans residues 2–323 (UniProt)
Section 1

Recommended ANXA3 IHC & IF Protocols

The catalog antibody protocol is followed by published ANXA3 IHC methods for colon carcinoma (PMC9273664), breast cancer (PMC5406736), and interspinous ligament (PMC9019158).

Recommended immunohistochemistry (IHC-P) protocol parameters
SampleParaffin-embedded human intestinal cancer tissue; fixative not specified (datasheet A04796)
FixationImage fixative and duration unreported (datasheet A04796); verify before use.
Sectioning4–5 µm sections on charged slides (standard)
DeparaffinisationXylene, graded ethanol series to water (standard)
Antigen retrievalHeat retrieval: Citrate pH 6, 20 min (datasheet A04796)
Peroxidase block3% H2O2, 10 min, room temperature (standard)
Blocking10% goat serum (datasheet A04796)
Primary antibodyRabbit anti-ANXA3, 0.5-1μg/ml (datasheet A04796)
Primary incubationOvernight at 4 °C (datasheet A04796)
DetectionStreptavidin-biotin complex (SABC), DAB chromogen (datasheet A04796)
CounterstainHematoxylin, blue, dehydrate and mount (standard)
Expected resultANXA3-positive staining in endocrine cells of appendix (HPA tissue IHC: High). HPA tissue profile: Cytoplasmic expression at variable levels in most tissues. No signal in the no-primary control.
💡Decision noteStart with citrate pH 6 heat retrieval (datasheet: A04796); the colon carcinoma method also uses microwaved citrate buffer (PMC9273664).
Section 2

What Is the Expected ANXA3 Staining Pattern?

In paraffin-section IHC, expect variable cytoplasmic ANXA3 staining in most tissues, with high staining reported in appendix and duodenal endocrine cells, kidney Bowman’s capsule, and lung type I alveolar cells (HPA: tissue IHC). Tissue reliability is Enhanced, with medium consistency between staining and RNA expression (HPA: tissue reliability). ANXA3 has no transmembrane segment or signal peptide in the supplied record (UniProt P12429 topology and processing).

What am I looking at on my slide?
Cytoplasmic staining is strongest in appendix or duodenal endocrine cells, kidney Bowman’s capsule, or lung type I alveolar cells.This matches the named High cell populations (HPA: tissue IHC). Judge the specified cells within each section; an entire organ need not stain at the same intensity.
A crisp nuclear-only pattern dominates an otherwise interpretable IHC section.Treat it as a possible artefact: the reported tissue IHC pattern is cytoplasmic (HPA: tissue IHC). Check the positive control and detection controls before assigning nuclear ANXA3.
Strong staining appears in adrenal glandular cells, heart cardiomyocytes, or esophageal squamous epithelial cells.Those specified populations are Not detected in the supplied atlas (HPA: tissue IHC). Cross-reactivity or endogenous detection activity are possibilities; confirm with controls.
Brown signal spreads across cells, lumina, and tissue edges without clear cell boundaries.This is difficult to score as ANXA3 because the atlas describes cell-associated cytoplasmic staining (HPA: tissue IHC). Check background and detection controls using general IHC practice.
No signal appears in a section containing an expected High cell population.A negative run is unresolved until that population is confirmed in the section (HPA: tissue IHC). Then assess staining and detection steps with a control using general IHC practice.
💡Expected ANXA3 appearanceCall a result positive when identifiable expected cells show cytoplasmic signal at the atlas-reported level (HPA: tissue IHC); isolated nuclear-only staining or uniform tissue-wide color warrants control review.
How each factor affects the staining
Cell-resolved tissue referenceHPA reports variable cytoplasmic staining across most tissues and names specific High, Medium, and Not detected cell populations (HPA: tissue IHC). Compare like cell types, not organ-wide averages.
Evidence strengthThe tissue profile is Enhanced but has medium staining–RNA consistency (HPA: tissue reliability). Both listed antibodies have Enhanced IHC validation (HPA: HPA013398 and HPA013431); these ratings do not validate every unexpected stain.
Topology and processingThe supplied record lists no transmembrane segment or signal peptide and a chain spanning residues 2–323 (UniProt P12429 topology and processing). It supplies no epitope position or target-specific retrieval response.
IF/ICC: where should signal appear?Mainly at the plasma membrane in the supplied ICC-IF summary (HPA: subcellular, supported). That observation and the cytoplasmic tissue IHC profile come from different applications; interpret each against its own reference.
Why is my staining missing, weak or wrong?
SituationLikely causeNext action
The expected positive population is unstained.The target cells may be absent from the section, or a staining step may have failed; the named High populations are the reference (HPA: tissue IHC).Verify the cells on the counterstained section, then check the IHC-validated antibody, retrieval, dilution, and detection against the validated run conditions (general IHC practice).
Nuclear-only staining dominates.This differs from the reported cytoplasmic tissue profile (HPA: tissue IHC); the stain’s identity remains uncertain.Compare a known-positive section and appropriate detection controls before scoring nuclei as positive (general IHC practice).
An HPA Not detected cell population stains strongly.Cross-reactivity or endogenous detection activity may contribute; the stated negative applies to that cell population (HPA: tissue IHC).Check cell identity and a primary-antibody omission control; review blocking and chromogen development (general IHC practice).
Color is diffuse or concentrated at tissue edges.Nonspecific background or uneven staining is possible; this does not resemble the cell-resolved cytoplasmic profile (HPA: tissue IHC).Inspect wash, blocking, and detection controls, then score only clearly localized cellular signal (general IHC practice).
Bone marrow is weaker than a High tissue control.Hematopoietic cells are reported at Medium protein staining, despite bone marrow tissue-enhanced RNA specificity (HPA: tissue IHC and RNA specificity).Use the protein-level cell reference when judging the slide; do not require bone marrow to match a High IHC population (HPA: tissue IHC).
An IF/ICC image appears membrane-associated while IHC appears cytoplasmic.The supplied ICC-IF summary supports plasma membrane localization, while tissue IHC reports cytoplasmic expression (HPA: subcellular; tissue IHC).Evaluate the IF/ICC image against its supported localization and the paraffin section against its tissue IHC profile (HPA: subcellular; tissue IHC).

Sample controls for ANXA3 IHC & IF

🧪Run appendix first and look for staining in endocrine cells (HPA: High in appendix endocrine cells). Use adrenal gland glandular cells as a negative tissue comparator (HPA: Not detected in adrenal gland glandular cells); on the appendix slide, compare the endocrine-cell signal with nearby cells that show only background, without assuming every other cell type is negative (HPA: High in appendix endocrine cells).
Positive control tissue: Appendix (Endocrine cells, HPA High)
Negative control tissue: Adrenal gland (HPA Not detected)
ICC-IF cell lines (HPA subcellular resource): HPA ICC-IF images show ANXA3 in A-431, U-251MG, U2OS, with annotated localisation: Plasma membrane (supported) (HPA subcellular).
Technical controls: Include a no-primary, secondary-only control and a concentration-matched rabbit IgG isotype control for the rabbit catalog antibody, plus ANXA3 knockout tissue as a biological negative if available (caption: rabbit anti-ANXA3; standard IHC practice). For the appendix slide, block endogenous peroxidase and check endogenous biotin background because the reported detection uses an avidin–biotin complex and DAB (caption: SABC/DAB; standard IHC practice).
⚠️Feasibility: No target-specific fixation window or fixation effect is reported, and the selected A04796 tissue-IHC caption does not state a fixative (caption: fixative not stated). The reported paraffin-section procedure uses heat retrieval in citrate buffer at pH 6 for 20 minutes; its dependence on retrieval has not been established by a comparison (caption: retrieval conditions). Frozen-section performance and whether IF is easier are unreported; for intestinal sections using the reported avidin–biotin/DAB detection, assess endogenous biotin background (caption: human intestinal cancer section and SABC/DAB; standard IHC practice).

HPA tissue IHC evidence for ANXA3

Comprehensive Human Protein Atlas IHC scoring per tissue (reliability: Enhanced — Medium consistency between antibody staining and RNA expression data.). Rows are taken directly from the HPA tissue chart — click any row's HPA link to view the source.

Positive expression · recommended positive controls

TissueCell typeLevelEvidenceSource
Appendix Endocrine cells High Protein (IHC) HPA →
Duodenum Endocrine cells High Protein (IHC) HPA →
Kidney Bowman's capsule High Protein (IHC) HPA →
Lung Alveolar cells type I High Protein (IHC) HPA →
Bone marrow Hematopoietic cells Medium Protein (IHC) HPA →

Undetected expression · recommended negative controls

TissueCell typeLevelEvidenceSource
Adrenal gland Glandular cells Not detected Protein (IHC) HPA →
Caudate Glial cells Not detected Protein (IHC) HPA →
Cerebellum Cells in granular layer Not detected Protein (IHC) HPA →
Esophagus Squamous epithelial cells Not detected Protein (IHC) HPA →
Heart muscle Cardiomyocytes Not detected Protein (IHC) HPA →
Section 3

Advanced ANXA3 IHC Tips

Troubleshoot ANXA3 staining in paraffin-section chromogenic IHC using the A04796 tissue example and cell-specific reference patterns (caption A04796; HPA tissue IHC).

How should I adjust retrieval when ANXA3 staining is weak or uneven?
Start with heat-mediated citrate retrieval at pH 6 for 20 minutes on paraffin sections (datasheet A04796; caption A04796). If staining is weak, vary heating time in matched sections while keeping the antibody incubation and DAB development constant, and inspect morphology for retrieval damage (standard IHC practice). The reported example used 1 µg/mL primary antibody overnight at 4°C, providing a starting condition for that comparison (caption A04796). Judge improvement in the expected cells rather than by overall brown intensity, since ANXA3 staining varies among tissue cell types (HPA tissue IHC).
Could fixation explain weak ANXA3 staining in my paraffin sections?
The A04796 paraffin-section caption does not state the fixative, so ANXA3-specific fixation sensitivity remains unknown (caption A04796). Record each specimen’s fixation and processing history, then compare matched sections using pH 6 citrate retrieval and the same chromogenic detection conditions (standard IHC practice; datasheet A04796). For the catalog antibody, the reported primary condition is 1 µg/mL overnight at 4°C; hold it constant while assessing specimen differences (caption A04796; standard IHC practice). Check morphology and no-primary controls before attributing reduced signal to fixation, because processing variation and background can alter apparent staining (standard IHC practice).
Should ANXA3 staining appear cytoplasmic or at the plasma membrane?
Assess cytoplasmic staining in tissue sections first, because the HPA tissue profile describes variable cytoplasmic expression across most tissues (HPA tissue IHC). Membrane accentuation can also be plausible: HPA subcellular data support a plasma-membrane location, while the ANXA3 record describes calcium/phospholipid binding and no transmembrane segment (HPA subcellular; UniProt P12429). These sources do not establish a required compartment in every paraffin-section cell type, so record cytoplasmic and membrane patterns separately rather than combining their scores (HPA tissue IHC; HPA subcellular; standard IHC practice). Compare each pattern with cell identity, tissue morphology, and no-primary controls before treating it as specific ANXA3 signal (standard IHC practice).
Can epitope masking or ANXA3 processing explain discordant IHC results?
The supplied ANXA3 record lists 0 isoforms and a chain spanning residues 2–323, but it does not map the A04796 antibody epitope (UniProt P12429; caption A04796). It records N-terminal acetylation at residue 2 and phosphorylation at residue 267; neither establishes an effect on this antibody’s paraffin-section staining without epitope information (UniProt P12429). When staining differs across specimens, compare matched retrieval and detection conditions before assigning the difference to processing or modification (standard IHC practice). If an independently validated ANXA3 antibody with a documented distinct epitope is available, concordant cell-specific staining can strengthen interpretation (standard IHC practice).
How can IF help assess an ambiguous ANXA3 IHC pattern?
Use IF as a separate localisation check by multiplexing ANXA3 with an established marker for the expected cell population, such as endocrine cells in appendix or duodenum (HPA tissue IHC; standard IF practice). Choose a fluorophore channel with low measured autofluorescence in the specimen, and compare unstained and single-label controls before interpreting overlap (standard IF practice). Test permeabilised and nonpermeabilised conditions when assessing cytoplasmic versus membrane signal, because the antibody epitope’s membrane side is unspecified and ANXA3 has no transmembrane segment (UniProt P12429; standard IF practice). Relate any IF pattern back to the chromogenic IHC cell identity and morphology, without treating IF intensity as an IHC score (standard IHC/IF practice).
What causes diffuse brown background in ANXA3 chromogenic IHC?
The A04796 example used 10% goat serum blocking, a biotinylated secondary antibody, a streptavidin-biotin complex, and DAB detection (caption A04796). Run no-primary and secondary-only controls to identify detection-system staining, and include a peroxidase block when using DAB (standard IHC practice). With a biotin-based system, assess endogenous biotin if control sections remain brown, while checking whether excessive DAB development or drying produced diffuse deposits (standard IHC practice). Adjust blocking, washes, primary exposure, or development one variable at a time, then compare cell-specific signal against the same controls and morphology (standard IHC practice).
How should I score ANXA3 IHC across heterogeneous tissue regions? ⚠ ANSWER MARKED FOR VERIFICATION
Define the cell population and compartment before scoring, because the HPA tissue profile reports variable cytoplasmic expression and its subcellular profile supports plasma-membrane localisation (HPA tissue IHC; HPA subcellular). For a cell population, report percent positive cells and an H-score from 0–300, calculated from intensity categories 0–3 weighted by their cell percentages (standard IHC practice). For dispersed positive cells, density per mm² can supplement the score when the measured tissue area and counting rules are specified (standard IHC practice). Normalise to eligible cells or evaluable tissue area, exclude folds and necrosis, and apply identical thresholds across sections (standard IHC practice).
How do I distinguish true ANXA3 staining from artefact?
Look for reproducible staining in morphologically intact, expected cells: HPA reports high ANXA3 in appendix endocrine cells and kidney Bowman’s capsule, but no detection in heart cardiomyocytes (HPA tissue IHC). Treat these as reference patterns rather than absolute controls for every specimen, since the HPA tissue assessment reports medium agreement between staining and RNA data (HPA tissue IHC). Question signal confined to section edges, folds, or necrotic areas, and check no-primary and peroxidase-block controls for detection artefacts (standard IHC practice). Cytoplasmic staining and membrane accentuation both warrant evaluation, whereas a pattern restricted to an unexpected compartment or cell population needs independent confirmation (HPA tissue IHC; HPA subcellular; standard IHC practice).
Boster reagents

Best ANXA3 / Annexin A3 IHC Antibodies

The catalog shows ANXA3 staining in paraffin sections of human and mouse tissues (A04796 and M04796-2 image captions); IF/ICC is listed for PB9420, with no IF figure supplied (PB9420 applications and image payload).

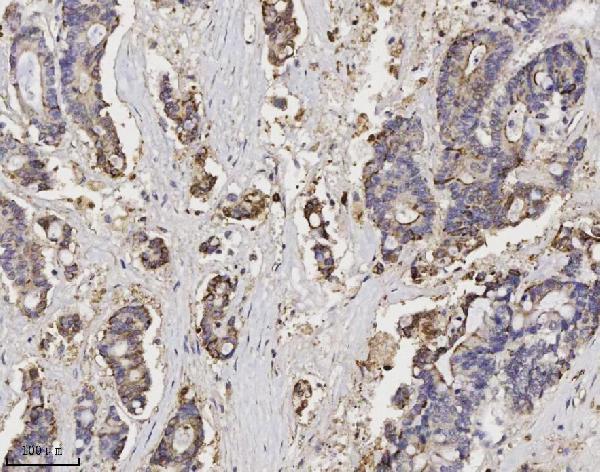
Real IHC data IHC analysis of ANXA3 using anti-ANXA3 antibody (A04796). ANXA3 was detected in paraffin-embedded section of human intestinal cancer tissue. Heat mediated antigen retrieval was performed in citrate buffer (pH6, epitope retrieval solution) for 20 mins. The tissue section was blocked with 10% goat serum. The tissue section was then incubated with 1μg/ml rabbit anti-ANXA3 Antibody (A04796) overnight at 4°C. Biotinylated goat anti-rabbit IgG was used as secondary antibody and incubated for 30 minutes at 37°C. The tissue section was developed using Strepavidin-Biotin-Complex (SABC)(Catalog # SA1022) with DAB as the chromogen.
Anti-Annexin A3/ANXA3 Antibody ®
Cat # A04796
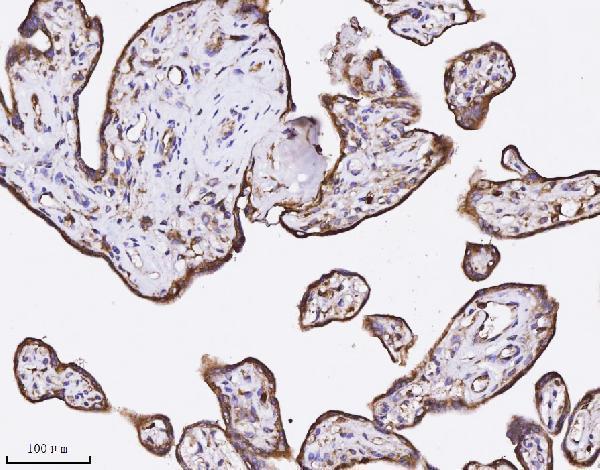
Real IHC data IHC analysis of Annexin A3 using anti-Annexin A3 antibody (M04796-2). Annexin A3 was detected in a paraffin-embedded section of human placenta tissue. Heat mediated antigen retrieval was performed in EDTA buffer (pH 8.0, epitope retrieval solution). The tissue section was blocked with 10% goat serum. The tissue section was then incubated with 2 μg/ml mouse anti-Annexin A3 Antibody (M04796-2) overnight at 4°C. Peroxidase Conjugated Goat Anti-mouse IgG was used as secondary antibody and incubated for 30 minutes at 37°C. The tissue section was developed using HRP Conjugated Mouse IgG Super Vision Assay Kit (Catalog # SV0001) with DAB as the chromogen.
Anti-Annexin A3 Antibody ® (monoclonal, 2H3H8)
Cat # M04796-2

A04796 will render with a human intestinal cancer paraffin-section IHC figure; its catalog lists IHC and human, mouse, and rat reactivity (A04796 image caption and applications/reactivity). M04796-2 will render with a human placenta paraffin-section IHC figure; its catalog lists IHC and human reactivity (M04796-2 image caption and applications/reactivity).

Which to pick: Choose A04796 for cross-species tissue IHC: its catalog lists human, mouse, and rat reactivity, and its captions show human and mouse paraffin-section staining (A04796 reactivity and image captions). Choose M04796-2 when a human-reactive monoclonal is preferred; its placenta caption shows paraffin-section IHC with EDTA pH 8.0 retrieval, but does not report the fixative (M04796-2 catalog: clone 2H3H8, human reactivity; M04796-2 image caption). For IF/ICC, PB9420 is the catalog-listed option at 5 μg/ml; no IF figure is supplied, so establish the staining conditions for your samples (PB9420 applications, dilution, and image payload).

Each figure is that product's own IHC / IF validation image from its datasheet.

References

  1. UniProt Consortium. UniProt entry P12429 (ANXA3_HUMAN, Annexin A3).
  2. Human Protein Atlas. ANXA3 tissue IHC expression (reliability: Enhanced).
  3. Human Protein Atlas. ANXA3 subcellular location (ICC-IF): Mainly localized to the plasma membrane..
  4. Human Protein Atlas. ANXA3 antibody validation summary (2 antibodies).
  5. Expression of HIF-1α, ANXA3, CD133 and their associations with clinicopathological parameters in human colon carcinoma. Translational cancer research 2022 — PMC9273664.
  6. Overexpression of ANXA3 is an independent prognostic indicator in gastric cancer and its depletion suppresses cell proliferation and tumor growth. Oncotarget 2016 — PMC5349965.
  7. Annexin A3 as a Prognostic Biomarker for Breast Cancer: A Retrospective Study. BioMed research international 2017 — PMC5406736.
  8. Upregulated of ANXA3, SORL1, and Neutrophils May Be Key Factors in the Progressionof Ankylosing Spondylitis. Frontiers in immunology 2022 — PMC9019158.
  9. PubMed PMID:2968983 — UniProt-cited evidence.
  10. PubMed PMID:1830024 — UniProt-cited evidence.
  11. PubMed PMID:8276419 — UniProt-cited evidence.