This website uses cookies to ensure you get the best experience on our website.


- Table of Contents
Plan chromogenic ATF5 staining in paraffin sections using the documented M02792 tissue workflow (datasheet: M02792). Compare nuclear staining with HPA tissue observations, while accounting for their uncertain reliability (HPA tissue IHC).

Expected localisation, validated protocols, controls and antibodies — the at-a-glance facts below, then the full design guide.
| Expected localisation | General nuclear tissue staining (HPA tissue IHC) | |
| Staining pattern | Nuclear staining across tissue cell types (HPA tissue IHC) | |
| Antigen retrieval | EDTA pH 8.0 HIER, heat-mediated (datasheet M02792) | |
| Positive control | Adrenal gland+4 more · see all | |
| Negative control | Adipose tissue |
| Fixation | Keep paraffin-section fixation consistent across samples. (standard IHC practice; not target-specific) | |
| Caveat | Staining and RNA data show low consistency; verify the pattern (HPA tissue IHC) | |
| Regulation | HSPA1A/B interaction stabilizes ATF5 (UniProt) | |
| Isoform / epitope | No recorded isoforms; one 1–282 chain (UniProt) |
The catalog antibody uses EDTA pH 8.0 retrieval (datasheet M02792). These published ATF5 IHC protocols cover thyroid, rat heart, and human nucleus pulposus sections (PMC5067000; PMC8677764; PMC13202852).
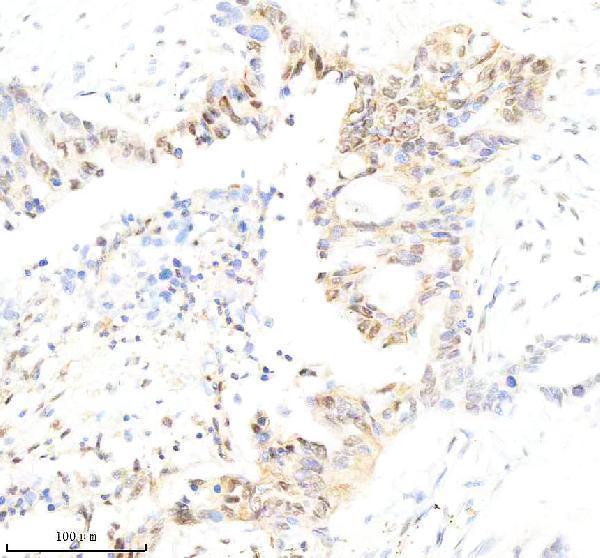
| Sample | Paraffin-embedded human pancreas cancer tissue; fixative not specified (datasheet M02792) |
| Fixation | Image fixative and duration unreported (datasheet M02792); verify before use. |
| Sectioning | 4–5 µm sections on charged slides (standard) |
| Deparaffinisation | Xylene, graded ethanol series to water (standard) |
| Antigen retrieval | Heat retrieval: EDTA pH 8.0 (datasheet M02792); 20 min, 95–100 °C (standard) |
| Peroxidase block | 3% H2O2, 10 min, room temperature (standard) |
| Blocking | 10% goat serum (datasheet M02792) |
| Primary antibody | Rabbit monoclonal (clone HDD-1) anti-ATF5, 1:50 recommended; image 1:100 (datasheet M02792) |
| Primary incubation | Overnight at 4 °C (datasheet M02792) |
| Detection | HRP-conjugated secondary, DAB chromogen (datasheet M02792) |
| Counterstain | Hematoxylin, blue, dehydrate and mount (standard) |
| Expected result | ATF5-positive staining in glandular cells of adrenal gland (HPA tissue IHC: High). HPA tissue profile: General nuclear expression. No signal in the no-primary control. |
ATF5 staining should be predominantly nuclear in paraffin sections, with high staining reported in selected epithelial, glandular, glomerular and Purkinje cells (HPA: general nuclear expression; HPA: tissue IHC). Cytoplasmic and centrosomal localization is also described (UniProt Q9Y2D1: subcellular location). Interpret tissue patterns cautiously: HPA rates its tissue IHC profile Uncertain because antibody staining and RNA expression have low consistency (HPA: reliability). ATF5 has no transmembrane segment (UniProt Q9Y2D1: topology).
| Distinct nuclear staining in bronchial respiratory epithelial cells or cerebellar Purkinje cells, with little surrounding background. | This fits the reported general nuclear pattern and High staining in those cell types (HPA: tissue IHC). It is a useful positive pattern, but the overall tissue profile remains Uncertain (HPA: reliability). Compare cell identity and nuclear location before treating staining intensity alone as evidence of specificity. |
| Membrane-dominant staining, or signal confined to extracellular material, without a convincing nuclear component. | Treat this as a possible artefact: ATF5 has no transmembrane segment, and HPA describes general nuclear expression (UniProt Q9Y2D1: topology; HPA: tissue IHC). Cytoplasmic signal alone is less decisive because cytoplasmic and centrosomal localization is reported (UniProt Q9Y2D1: subcellular location). |
| Strong staining in adipocytes while expected positive cells on the same run stain weakly or inconsistently. | HPA reports ATF5 as Not detected in adipocytes, so investigate antibody cross-reactivity or endogenous detection activity before scoring this as positive (HPA: adipose tissue IHC). The Uncertain tissue validation limits how firmly any single tissue comparison can establish specificity (HPA: reliability). |
| Uniform chromogen across nuclei, cytoplasm and tissue-free areas, obscuring cell boundaries. | This is diffuse background rather than an interpretable ATF5 distribution; the reported tissue pattern is generally nuclear (HPA: tissue IHC). Check the no-primary control, blocking, washes and detection reagents as general IHC troubleshooting steps. Reassess localization only after the background clears. |
| No staining in a section containing a reported High-staining cell population. | If bronchial respiratory epithelial cells or cerebellar Purkinje cells are identifiable yet unstained, first check the run controls and detection sequence (HPA: High in those cells). A blank slide does not by itself show biological absence, especially given the Uncertain tissue profile (HPA: reliability). |
| Which cells provide an IHC comparison? | HPA reports High staining in adrenal glandular cells, bronchial respiratory epithelial cells, Purkinje cells and glomerular cells; adipocytes are Not detected (HPA: tissue IHC). Use the named cell populations when comparing sections, because a tissue name alone does not define which cells should stain. |
| How should liver staining be interpreted? | Hepatocytes have Low staining in HPA tissue IHC, although liver is RNA-enriched in HPA and has higher expression in the UniProt tissue summary (HPA: liver IHC; HPA: RNA specificity; UniProt Q9Y2D1: tissue specificity). Do not require strong hepatocyte chromogen as the IHC positive criterion. |
| How strong is the antibody evidence? | The listed rabbit polyclonal HPA030187 is rated Uncertain for IHC and Supported for ICC (HPA: antibody validation). HPA also rates the overall tissue IHC profile Uncertain because staining and RNA show low consistency (HPA: reliability). Treat a matching pattern as supportive rather than conclusive. |
| Which compartment should be scored? | HPA describes general nuclear tissue expression, while UniProt also lists cytoplasm and centrosome, with centrosomal accumulation during G1 to M and movement to the midbody late in cell division (HPA: tissue IHC; UniProt Q9Y2D1: subcellular location). Score the dominant, cell-resolved pattern and record focal nonnuclear signal separately. |
| IF/ICC Q&A: where can ATF5 appear? | HPA reports mainly nucleoplasmic signal, with additional vesicular and cytosolic localization in ICC-IF (HPA: subcellular). Those observations can inform compartment interpretation here; the separate IF/ICC guide covers its experimental workflow. HPA030187 is Supported for ICC (HPA: antibody validation). |
| Does the record establish a fixation effect? | No target-specific fixation sensitivity is reported in the supplied UniProt or HPA evidence. ATF5 is listed as a 1–282 chain without a signal peptide or propeptide, and with no transmembrane segment (UniProt Q9Y2D1: processing; topology); those facts do not predict retrieval performance. |
| Situation | Likely cause | Next action |
|---|---|---|
| Expected nuclei are faint or blank across the run. | A failed staining or detection step is possible; HPA reports High staining in several named cell populations, but its tissue profile is Uncertain (HPA: tissue IHC; HPA: reliability). | Inspect a reported High-staining cell population and the run controls; verify primary-antibody, detection and counterstain steps. If repeating retrieval, treat the adjustment as general IHC optimization, since target-specific fixation sensitivity is unreported. |
| The tissue is positive, but the wrong cells carry most of the signal. | Cell identity may be misread, or staining may reflect cross-reactivity or endogenous detection activity. HPA reports High staining in specified cell populations and Not detected in adipocytes (HPA: tissue IHC). | Compare cell morphology with the named HPA cell population and inspect a no-primary control. Avoid assigning ATF5 positivity from whole-tissue color alone; the HPA tissue profile is Uncertain (HPA: reliability). |
| Signal is predominantly membranous. | This conflicts with HPA's general nuclear tissue pattern and with the absence of a transmembrane segment (HPA: tissue IHC; UniProt Q9Y2D1: topology). | Check whether the apparent membrane signal follows tissue edges or persists in a no-primary control. Reassess nuclear staining before calling the section positive; cytoplasmic or centrosomal signal can occur (UniProt Q9Y2D1: subcellular location). |
| Brown haze covers both cells and empty areas. | Diffuse background prevents compartment scoring against the reported nuclear pattern (HPA: tissue IHC). Nonspecific reagent deposition or endogenous detection activity is possible under standard chromogenic IHC practice. | Review the no-primary control, blocking, washes and chromogen development. Repeat scoring only when nuclei and cell borders can be distinguished; do not count uniform haze as ATF5-positive cells. |
| Hepatocytes look weak despite liver-enriched RNA. | The measurements differ: HPA lists Low hepatocyte IHC staining and liver-enriched RNA, while UniProt describes higher liver expression (HPA: liver IHC; HPA: RNA specificity; UniProt Q9Y2D1: tissue specificity). | Keep the IHC observation separate from RNA abundance. Check a reported High-staining cell population for run performance before interpreting weak hepatocyte signal; avoid raising the positivity threshold from RNA data. |
| Small extranuclear puncta appear beside convincing nuclear staining. | UniProt describes centrosomal localization and movement to the midbody during cell division; HPA ICC-IF also reports additional vesicular and cytosolic signal (UniProt Q9Y2D1: subcellular location; HPA: subcellular). | Record puncta separately from nuclear intensity and compare their position with cell morphology. In chromogenic sections, do not identify a punctum as a centrosome or vesicle solely from its appearance; retain the nuclear pattern as the principal IHC comparison (HPA: tissue IHC). |


Comprehensive Human Protein Atlas IHC scoring per tissue (reliability: Uncertain — Low consistency between antibody staining and RNA expression data. Pending external verification.). Rows are taken directly from the HPA tissue chart — click any row's HPA link to view the source.
| Tissue | Cell type | Level | Evidence | Source |
|---|---|---|---|---|
| Adrenal gland | Glandular cells | High | Protein (IHC) | HPA → |
| Bronchus | Respiratory epithelial cells | High | Protein (IHC) | HPA → |
| Cerebellum | Purkinje cells | High | Protein (IHC) | HPA → |
| Cervix | Glandular cells | High | Protein (IHC) | HPA → |
| Endometrium | Glandular cells | High | Protein (IHC) | HPA → |
| Tissue | Cell type | Level | Evidence | Source |
|---|---|---|---|---|
| Adipose tissue | Adipocytes | Not detected | Protein (IHC) | HPA → |
Troubleshoot ATF5 chromogenic IHC by checking retrieval, staining compartment, controls, and scoring; use IF as a localization check.
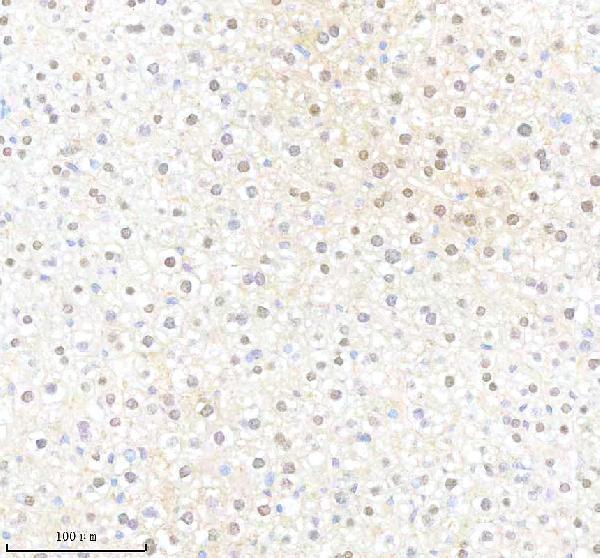
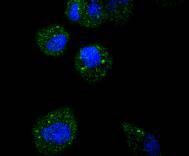
Anti-ATF5 antibodies have IHC images from human pancreas cancer and mouse liver paraffin sections (M02792 IHC captions) and an IF/ICC image from HeLa cells (A02792 IF caption).
M02792 is listed for IHC, IF and ICC in Human, Mouse and Rat, with IHC images from human pancreas cancer and mouse liver paraffin sections (catalog applications/reactivity; M02792 IHC captions). A02792 is listed for IHC, IF and ICC in those three species, with an ICC image from paraformaldehyde-fixed HeLa cells (catalog applications/reactivity; A02792 IF caption).
Which to pick: For tissue IHC, choose M02792: monoclonal clone HDD-1 has paraffin-section IHC examples; their captions do not report the fixative (catalog clone; M02792 IHC captions). For IF/ICC, choose A02792 for its HeLa staining image with paraformaldehyde fixation and Triton permeabilisation (A02792 IF caption). For cross-species studies, both list Human, Mouse and Rat reactivity and IHC, IF and ICC applications (catalog reactivity/applications).