This website uses cookies to ensure you get the best experience on our website.


- Table of Contents
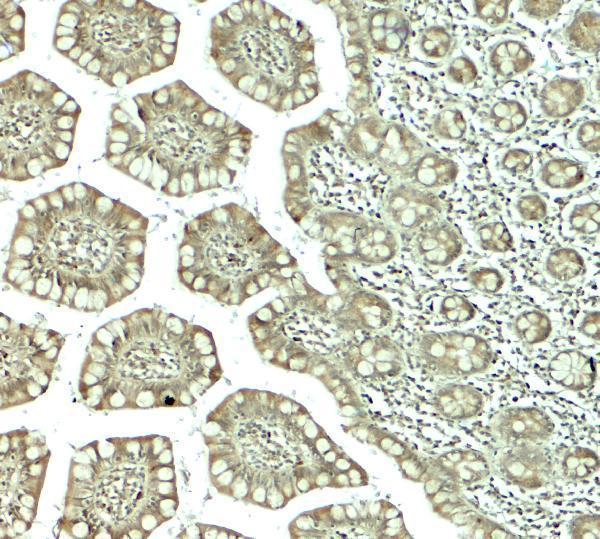
Plan CTHRC1 chromogenic IHC in paraffin sections with the catalog antibody at 0.5–1 μg/mL (datasheet A05203-1). Use human small intestine as a high-staining reference and assess glandular-cell staining alongside a no-primary control (HPA tissue IHC).

Expected localisation, validated protocols, controls and antibodies — the at-a-glance facts below, then the full design guide.
| Expected localisation | Cytoplasmic staining in several tissues (HPA tissue IHC) | |
| Staining pattern | Cytoplasmic staining in gut glandular cells (HPA tissue IHC) | |
| Antigen retrieval | EDTA pH 8.0 HIER, heat-mediated (datasheet A05203-1) | |
| Positive control | Appendix+4 more · see all | |
| Negative control | Adipose tissue+4 more · see all |
| Fixation | Keep fixation consistent across sections (standard IHC practice; not target-specific); assess results empirically. | |
| Caveat | Secreted protein may cause RNA and tissue staining to differ (HPA tissue IHC) | |
| Regulation | Isoform 1 is expressed in calcified plaque (UniProt) | |
| Isoform / epitope | 3 isoforms; signal peptide 1–30 is removed; no cytoplasmic segment (UniProt) |
The catalog antibody protocol uses EDTA retrieval (datasheet: A05203-1). Published paraffin-section IHC methods below provide CTHRC1 examples from pituitary and other tissues (PMC3466254; PMC4091966; PMC13235751).
| Sample | Paraffin-embedded human mammary cancer tissue; fixative not specified (datasheet A05203-1) |
| Fixation | Image fixative and duration unreported (datasheet A05203-1); verify before use. |
| Sectioning | 4–5 µm sections on charged slides (standard) |
| Deparaffinisation | Xylene, graded ethanol series to water (standard) |
| Antigen retrieval | Heat retrieval: EDTA pH 8.0 (datasheet A05203-1); 20 min, 95–100 °C (standard) |
| Peroxidase block | 3% H2O2, 10 min, room temperature (standard) |
| Blocking | 10% goat serum (datasheet A05203-1) |
| Primary antibody | Rabbit anti-CTHRC1, 0.5-1μg/ml (datasheet A05203-1) |
| Primary incubation | Overnight at 4 °C (datasheet A05203-1) |
| Detection | Streptavidin-biotin complex (SABC), DAB chromogen (datasheet A05203-1) |
| Counterstain | Hematoxylin, blue, dehydrate and mount (standard) |
| Expected result | CTHRC1-positive staining in glandular cells of appendix (HPA tissue IHC: High). HPA tissue profile: Cytoplasmic expression in several tissues. No signal in the no-primary control. |
CTHRC1 is a secreted protein found in extracellular space and matrix, with no transmembrane segment (UniProt Q96CG8 topology). In paraffin-section IHC, expect cytoplasmic staining in selected glandular cells, kidney tubules, and placental trophoblasts (HPA tissue IHC: High). HPA rates its tissue staining Approved, pending external verification; secretion can make tissue RNA and protein patterns difficult to correlate (HPA tissue IHC: reliability description).
| Strong cytoplasmic staining in intestinal glandular cells or kidney tubules. | This matches reported high staining in glandular cells of the colon, duodenum, rectum, and small intestine, and in kidney tubular cells (HPA tissue IHC: High). Assess the named cell population within the section; staining elsewhere in the same tissue does not establish the expected pattern (HPA tissue IHC: cell-specific observations). |
| Prominent nuclear-only staining in an otherwise positive tissue. | Treat this as an IHC localisation discrepancy and review controls and detection conditions. HPA describes tissue IHC as cytoplasmic, while UniProt places CTHRC1 in the secretory and extracellular pathway (HPA tissue IHC: profile; UniProt Q96CG8 subcellular location). Nuclear staining alone does not confirm a positive paraffin-section result. |
| Strong staining in adipocytes or prostate glandular cells. | These cell populations are reported as not detected (HPA tissue IHC: adipose tissue and prostate). Compare an unstained or detection-only control and a known-positive tissue before assigning the signal to CTHRC1. Unexpected staining may reflect antibody cross-reactivity or endogenous detection activity (general IHC practice); its cause cannot be determined from appearance alone. |
| Diffuse colour across cells, matrix, and blank areas. | Poorly confined staining is difficult to score against HPA’s cell-specific cytoplasmic observations (HPA tissue IHC: profile and positive tissues). Check whether colour also appears in a detection-only control, and review wash, blocking, antibody concentration, and chromogen development (general chromogenic IHC practice). Extracellular CTHRC1 localisation alone does not validate uniform background (UniProt Q96CG8 subcellular location). |
| No staining in a known-positive cell population. | A blank result in colon glandular cells, kidney tubules, or placental trophoblasts conflicts with reported high staining (HPA tissue IHC: High). Confirm that the expected cells are present, then examine antibody and detection controls and the retrieval conditions used (general IHC practice). HPA’s Approved rating remains pending external verification (HPA tissue IHC: reliability description). |
| Secreted protein and tissue localisation | CTHRC1 has a signal peptide at residues 1–30 and is annotated in extracellular space and matrix (UniProt Q96CG8 topology and subcellular location). HPA nevertheless reports cytoplasmic tissue IHC; secretion can separate the site of synthesis from where protein accumulates, so interpret extracellular colour in its tissue context (HPA tissue IHC: reliability description). |
| Processing, glycosylation, and isoforms | UniProt lists a chain at residues 31–243, one glycosylation site at residue 186, and 3 isoforms (UniProt Q96CG8 processing, glycosylation, isoforms). The supplied sources do not map the IHC antibody’s epitope, so these annotations cannot predict which molecular form it detects or explain a missing stain. |
| Evidence strength and tissue choice | The tissue IHC pattern is Approved but awaits external verification; the supplied HPA antibody record lists IHC Approved for HPA059806, without an Enhanced IHC designation (HPA tissue IHC: reliability; HPA antibodies: HPA059806). Use a reported high-staining cell population alongside a reported not-detected population when judging a new result (HPA tissue IHC: positive and negative observations). |
| IF/ICC: should nuclear signal guide IHC scoring? | No. HPA reports approved nucleoplasmic localisation in ICC-IF and lists ICC Approved for HPA061896, while its tissue IHC profile is cytoplasmic and HPA059806 is IHC Approved (HPA subcellular ICC-IF; HPA antibodies; HPA tissue IHC: profile). Treat these as assay-specific observations; the ICC-IF result does not establish a nuclear paraffin-section IHC pattern. |
| Situation | Likely cause | Next action |
|---|---|---|
| No signal in colon glands or kidney tubules. | Those cells are reported High, so a blank slide may indicate an assay problem or absence of the expected cells in the section (HPA tissue IHC: colon and kidney; general IHC practice). | Verify cell identity and section quality, then inspect the positive control, antibody application, detection reagents, and retrieval conditions (general IHC practice). No CTHRC1-specific retrieval requirement is supplied. |
| Nuclear staining dominates the chromogenic section. | This differs from the reported cytoplasmic tissue IHC profile (HPA tissue IHC: profile). Appearance alone does not identify whether the source is nonspecific binding or detection background (general IHC practice). | Compare detection-only and known-positive controls, then reassess scoring in the expected cell population (general IHC practice; HPA tissue IHC: High cell populations). |
| Strong colour appears in adipocytes or smooth muscle cells. | Both are reported not detected, making the result discordant with those HPA observations (HPA tissue IHC: adipose tissue and smooth muscle). Cross-reactivity or endogenous detection activity are possible causes (general IHC practice). | Check a detection-only control and review blocking and chromogen development; compare with a reported positive cell population before assigning target-specific staining (general IHC practice; HPA tissue IHC: High). |
| Background obscures glandular cell borders. | Diffuse colour can arise from excessive antibody or detection signal, insufficient washing, or endogenous activity (general chromogenic IHC practice). It prevents a clear comparison with HPA’s cell-specific profile (HPA tissue IHC: profile). | Review the detection-only control, washing, blocking, and development time; adjust conditions according to the antibody and detection-system instructions (general IHC practice). |
| Placenta stains, but adjacent cell populations differ. | HPA’s high placental observation names trophoblastic cells; it does not assign the same level to every cell in placenta (HPA tissue IHC: placenta). | Score trophoblastic cells separately, document the compartment and distribution, and compare the pattern with a negative control (HPA tissue IHC: placenta; general IHC practice). |
| Tissue RNA and protein results appear inconsistent. | HPA cautions that secreted protein variants can make RNA location and tissue protein location difficult to correlate (HPA tissue IHC: reliability description). | Interpret the slide using its cell-specific protein staining and appropriate IHC controls; report the RNA discrepancy without treating it alone as proof that the stain is false (HPA tissue IHC: profile and reliability description; general IHC practice). |




Comprehensive Human Protein Atlas IHC scoring per tissue (reliability: Approved — Pending external verification. At least one protein variant secreted, tissue location of RNA and protein might differ and correlation is complex.). Rows are taken directly from the HPA tissue chart — click any row's HPA link to view the source.
| Tissue | Cell type | Level | Evidence | Source |
|---|---|---|---|---|
| Appendix | Glandular cells | High | Protein (IHC) | HPA → |
| Colon | Glandular cells | High | Protein (IHC) | HPA → |
| Duodenum | Glandular cells | High | Protein (IHC) | HPA → |
| Kidney | Cells in tubules | High | Protein (IHC) | HPA → |
| Placenta | Trophoblastic cells | High | Protein (IHC) | HPA → |
| Tissue | Cell type | Level | Evidence | Source |
|---|---|---|---|---|
| Adipose tissue | Adipocytes | Not detected | Protein (IHC) | HPA → |
| Bone marrow | Hematopoietic cells | Not detected | Protein (IHC) | HPA → |
| Epididymis | Glandular cells | Not detected | Protein (IHC) | HPA → |
| Lymph node | Germinal center cells | Not detected | Protein (IHC) | HPA → |
| Ovary | Ovarian stroma cells | Not detected | Protein (IHC) | HPA → |
Troubleshoot CTHRC1 staining in paraffin sections by checking retrieval, compartment, controls, and scoring before interpreting chromogenic signal.
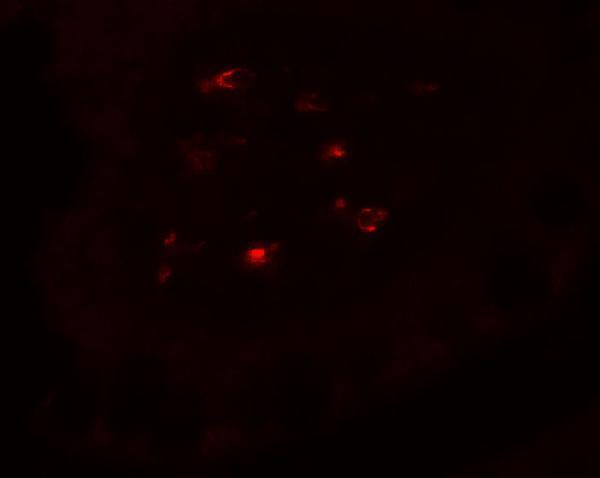
Both antibodies have human tissue IHC images; IF images show human small intestine for A05203 and mouse HEPA1-6 cells for A05203-1 (catalog image captions). Both list Human, Mouse and Rat reactivity (catalog).
A05203 has human small intestine IHC and IF images (catalog image captions). A05203-1 has an IHC image from a paraffin-embedded human mammary cancer section and an IF/ICC image from mouse HEPA1-6 cells (catalog image captions).
Which to pick: For tissue IHC requiring a documented paraffin-section workflow, choose A05203-1: its image caption reports EDTA retrieval at pH 8.0 and 1 μg/mL antibody; the fixative is unreported (A05203-1 IHC image caption). For tissue IF, choose A05203 based on its human small intestine IF image; for cell IF/ICC, choose A05203-1 based on its mouse HEPA1-6 image and listed ICC application (catalog image captions; A05203-1 applications). Both list Human, Mouse and Rat reactivity, but the supplied IHC images show human samples only (catalog reactivity; catalog IHC image captions).