This website uses cookies to ensure you get the best experience on our website.


- Table of Contents
Plan chromogenic CYP1B1 IHC-P around cytoplasmic staining in tissue sections (HPA tissue IHC). Use kidney tubules as a high-staining reference and colon glandular cells as a low-staining comparison (HPA tissue IHC), then optimize the catalog antibody within 0.5–1 μg/ml (datasheet PB9546).

Expected localisation, validated protocols, controls and antibodies — the at-a-glance facts below, then the full design guide.
| Expected localisation | Mainly cytoplasmic in tissue sections (HPA tissue IHC) | |
| Staining pattern | Cytoplasmic staining in kidney tubules and neurons (HPA tissue IHC) | |
| Antigen retrieval | Citrate pH 6 HIER, heat-mediated (datasheet PB9546) | |
| Positive control | Cerebral cortex+4 more · see all | |
| Negative control | Colon+4 more · see all |
| Fixation | Keep fixation consistent across sections (standard IHC practice; not target-specific); its effect on staining is uncertain. | |
| Caveat | Antibody staining has low consistency with RNA expression (HPA tissue IHC) | |
| Regulation | No staining-intensity regulator documented (UniProt) | |
| Isoform / epitope | No annotated isoforms or processing; epitope map unresolved (UniProt) |
The catalog antibody’s IHC-P protocol uses citrate pH 6 retrieval (datasheet: PB9546). Three published chromogenic IHC protocols provide tissue-specific examples (PMC10167314; PMC12567446; PMC10879803).
| Sample | Paraffin-embedded Mouse Kidney tissue; fixative not specified (datasheet PB9546) |
| Fixation | Image fixative and duration unreported (datasheet PB9546); verify before use. |
| Sectioning | 4–5 µm sections on charged slides (standard) |
| Deparaffinisation | Xylene, graded ethanol series to water (standard) |
| Antigen retrieval | Heat retrieval: Citrate pH 6, 20 min (datasheet PB9546) |
| Peroxidase block | 3% H2O2, 10 min, room temperature (standard) |
| Blocking | 10% goat serum (datasheet PB9546) |
| Primary antibody | Rabbit anti-CYP1B1, 0.5-1μg/ml (datasheet PB9546) |
| Primary incubation | Overnight at 4 °C (datasheet PB9546) |
| Detection | Streptavidin-biotin complex (SABC), DAB chromogen (datasheet PB9546) |
| Counterstain | Hematoxylin, blue, dehydrate and mount (standard) |
| Expected result | CYP1B1-positive staining in neuronal cells of cerebral cortex (HPA tissue IHC: High). HPA tissue profile: Mainly cytoplasmic expression in most tissues. No signal in the no-primary control. |
CYP1B1 should appear mainly cytoplasmic in tissue IHC, with strong staining reported in cerebral cortex neurons, kidney tubular cells, and skeletal muscle myocytes (HPA tissue IHC). It is primarily associated with the endoplasmic reticulum and has no annotated transmembrane segment (UniProt Q16678 localisation and topology). Interpret intensity cautiously: HPA rates the tissue profile Approved but reports low consistency between antibody staining and RNA expression data (HPA tissue IHC).
| Cytoplasmic staining in kidney tubular cells, cerebral cortex neurons, or skeletal muscle myocytes. | This fits HPA's mainly cytoplasmic tissue pattern and its High staining calls for these cell types (HPA tissue IHC). Assess the specified cells, rather than treating every stained structure in the section as an expected positive. |
| Predominantly nuclear or sharply cell-surface staining, without a convincing cytoplasmic pattern. | That differs from the reported tissue IHC pattern (HPA tissue IHC) and from CYP1B1's primary endoplasmic reticulum location (UniProt Q16678 localisation). Treat it as a possible artefact and check controls before assigning it to CYP1B1. |
| Strong staining in colon glandular cells or splenic red-pulp cells. | Those specific cells are Not detected in the HPA tissue IHC profile (HPA tissue IHC). Unexpected signal may reflect cross-reactivity or endogenous detection activity; inspect the negative control and staining distribution before interpreting it as expression. |
| Diffuse colour across cells, stroma, and tissue edges. | A widespread pattern is difficult to reconcile with the mainly cytoplasmic cell-associated profile (HPA tissue IHC). In a chromogenic IHC workflow, inspect blocking, washing, and the no-primary control for nonspecific signal or endogenous detection activity (general IHC practice). |
| No signal in kidney tubular cells, cerebral cortex neurons, or skeletal muscle myocytes. | These are High-staining cell types in the HPA tissue IHC profile (HPA tissue IHC). First check whether the appropriate cells are present and the assay controls worked; an absent signal alone cannot establish that the specimen lacks CYP1B1. |
| Tissue and cell selection | HPA reports High staining in cerebral cortex neurons, kidney tubular cells, and skeletal muscle myocytes, but Not detected in colon glandular cells (HPA tissue IHC). Score the named cell population, since a tissue-level label can conceal different cellular patterns. |
| Evidence strength | HPA calls the tissue profile Approved while reporting low consistency between antibody staining and RNA expression data (HPA tissue IHC). Its IHC antibody entries HPA026863 and CAB011705 are Approved, without an Enhanced designation in the supplied record (HPA antibodies). |
| Compartment and assay context | UniProt places CYP1B1 primarily at the endoplasmic reticulum and also notes mitochondrial targeting after TCDD treatment (UniProt Q16678 localisation). HPA tissue IHC is mainly cytoplasmic, whereas its ICC-IF mitochondrial assignment is uncertain (HPA tissue IHC; HPA subcellular). |
| Topology and molecular annotations | UniProt lists no transmembrane segment, signal peptide, propeptide, annotated isoforms, glycosylation sites, or modified residues (UniProt Q16678 topology and annotations). Those entries do not establish an optimal retrieval condition or a target-specific fixation effect. |
| Retrieval and detection settings | Target-specific fixation effects are not established by the supplied assay evidence. Verify with a matched IHC source before attributing a result to fixation. |
| Situation | Likely cause | Next action |
|---|---|---|
| Known High-staining cells show no chromogenic signal. | A missed cell population or failed staining run is possible; the expected High calls apply to specified cells (HPA tissue IHC). | Confirm those cells are present, then review the run control, antibody dilution, retrieval, and detection steps against the catalog IHC-P instructions (general IHC practice). |
| Colon glandular cells stain strongly. | HPA reports these cells as Not detected (HPA tissue IHC); cross-reactivity or endogenous detection activity is possible. | Compare a no-primary control and the cell-level pattern, then repeat with an independently validated IHC antibody if the finding matters (general IHC practice). |
| Signal is mainly nuclear or sharply outlines the cell surface. | The pattern conflicts with mainly cytoplasmic tissue staining (HPA tissue IHC) and the primary endoplasmic reticulum location (UniProt Q16678 localisation). | Check counterstain and chromogen localisation, inspect controls, and verify the pattern with an independent IHC antibody before scoring it (general IHC practice). |
| Colour covers stroma or tissue edges as well as cells. | Diffuse deposition obscures the cell-associated pattern described by HPA (HPA tissue IHC); nonspecific detection is possible (general IHC practice). | Review the no-primary control, blocking, washes, and chromogen development; score only interpretable cellular staining (general IHC practice). |
| ICC-IF appears mitochondrial while paraffin IHC appears cytoplasmic. | HPA's ICC-IF mitochondrial location is uncertain (HPA subcellular); its tissue IHC profile is mainly cytoplasmic (HPA tissue IHC). UniProt also describes conditional mitochondrial targeting after TCDD treatment (UniProt Q16678 localisation). | Keep the assay interpretations separate. Use the dedicated IF/ICC guide for IF controls and localisation; judge this IHC result against tissue IHC controls and cell-level pattern. |
| A weakly stained section is hard to classify. | HPA reports low consistency between antibody staining and RNA expression data despite an Approved tissue profile (HPA tissue IHC). Weak colour alone may therefore be inconclusive. | Compare matched positive and no-primary controls, confirm the intended cells, and record intensity with its distribution before calling the specimen positive or negative (general IHC practice). |


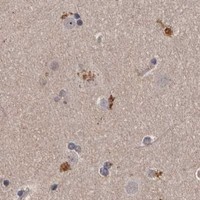


Comprehensive Human Protein Atlas IHC scoring per tissue (reliability: Approved — Low consistency between antibody staining and RNA expression data.). Rows are taken directly from the HPA tissue chart — click any row's HPA link to view the source.
| Tissue | Cell type | Level | Evidence | Source |
|---|---|---|---|---|
| Cerebral cortex | Neuronal cells | High | Protein (IHC) | HPA → |
| Kidney | Cells in tubules | High | Protein (IHC) | HPA → |
| Skeletal muscle | Myocytes | High | Protein (IHC) | HPA → |
| Adipose tissue | Adipocytes | Medium | Protein (IHC) | HPA → |
| Adrenal gland | Glandular cells | Medium | Protein (IHC) | HPA → |
| Tissue | Cell type | Level | Evidence | Source |
|---|---|---|---|---|
| Colon | Glandular cells | Not detected | Protein (IHC) | HPA → |
| Duodenum | Glandular cells | Not detected | Protein (IHC) | HPA → |
| Lymph node | Germinal center cells | Not detected | Protein (IHC) | HPA → |
| Oral mucosa | Squamous epithelial cells | Not detected | Protein (IHC) | HPA → |
| Spleen | Cells in red pulp | Not detected | Protein (IHC) | HPA → |
Troubleshoot CYP1B1 staining in paraffin sections by checking retrieval, controls, cellular localisation and scoring before interpreting chromogenic signal.
CYP1B1 antibodies PB9546 and M00515 list IHC and human, mouse, and rat reactivity (catalog applications and reactivity); PB9546 has paraffin section IHC figures, while neither lists IF/ICC (catalog applications and image captions).
PB9546 has IHC figures from paraffin sections of mouse kidney, rat kidney, and human liver cancer tissue (PB9546 image captions). M00515 lists IHC and human, mouse, and rat reactivity, but provides no IHC figure in this payload (M00515 catalog applications, reactivity, and image captions).
Which to pick: Choose PB9546 for tissue IHC when a matching paraffin section example matters; its captions show those three tissues, and its fixative is unreported (PB9546 image captions). For cross species IHC, both SKUs list human, mouse, and rat reactivity, but only PB9546 has figures across those species; M00515 is monoclonal and PB9546 is listed without a clone (catalog reactivity, clone fields, and PB9546 image captions). Neither SKU lists IF/ICC validation, so there is no supported IF/ICC pick here (catalog applications).