This website uses cookies to ensure you get the best experience on our website.


- Table of Contents
Real validated EPHA2 Western blot protocols, expected-band and isoform facts, troubleshooting for weak or shifted signal, and recommended anti-EPHA2 WB antibodies. Everything you need to plan the experiment before you commit precious samples.
Expected bands, validated protocols, controls and antibodies — the at-a-glance facts below, then the full design guide.
| Expected band | ~108.3 kDa | |
| Gel | 8–10% | |
| Negative control | siRNA / KO lysate |
| PTM | Glycosylated + Phosphorylated | |
| Caveat | N-glycosylation | |
| Regulation | p53 up | |
| Isoform | 2 isoform(s) |
Literature-validated Western blot parameters for EPHA2 — gel percentage, transfer, blocking, antibody incubation and detection, extracted from published methods.
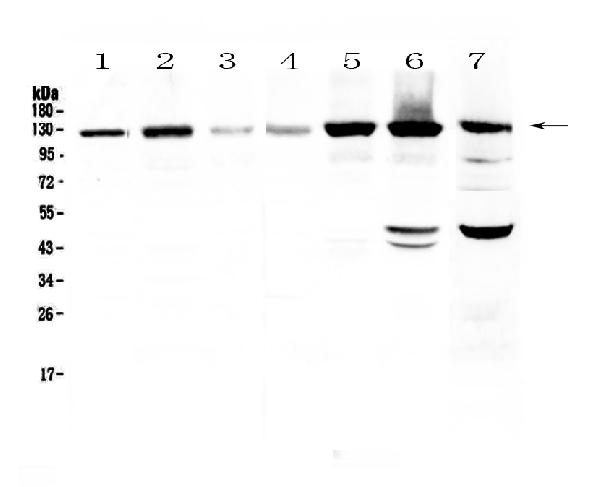
| Sample / lysate | human Hela , Lane 2: human U-87MG , Lane 3: human SHG-44 , Lane 4: human COLO-320 , Lane 5: human SK-OV-3 , Lane 6: human A549 , Lane 7: mouse HEPA1-6 . After Electrophoresis, proteins were transferred to a Nitrocellulose membrane at 150mA for 50-90 minutes. Blocked the membrane with 5% Non-fat Milk/ TBS for 1.5 hour at RT. The membrane was incubated with rabbit anti-Eph receptor A2 antigen affinity purified polyclonal antibody (Catalog # A00578) at 0.5 μg/mL overnight at 4°C, then washed with TBS-0.1%Tween 3 times with 5 minutes each and probed with a goat anti-rabbit IgG-HRP secondary antibody at a dilution of 1:10000 for 1.5 hour at RT. The signal is developed using an Enhanced Chemiluminescent detection (ECL) kit (Catalog # EK1002) with Tanon 5200 system. A specific band was detected for Eph receptor A2 at approximately 125KD. The expected band size for Eph receptor A2 is at 108KD |
| Gel % | 8–10% |
| Load | 50ug |
| Transfer | nitrocellulose membrane, 150 mA, 50–90 min |
| Membrane | nitrocellulose |
| Blocking | 5% non-fat milk / TBS, 1.5 h RT |
| Primary antibody | 0.5 µg/mL |
| Primary incubation | overnight at 4 °C |
| Secondary antibody | goat anti-rabbit IgG-HRP, 1:10000 |
| Wash | TBS-0.1% Tween, 3 × 5 min |
| Detection | ECL |
| Exposure / imaging | Tanon 5200 |
| Observed band | 125 kDa |
EPHA2 has a 108.3 kDa calculated backbone but typically runs modestly higher due to N-glycosylation at Asn407/Asn435 and possible residual homodimer species.
| Major band running above the ~108 kDa predicted mass, sometimes appearing slightly diffuse rather than crisp | N-linked glycosylation at Asn407 and Asn435 adds carbohydrate mass and glycoform heterogeneity to the core polypeptide |
| Faint higher-molecular-weight species near roughly twice the main band, most visible without full reduction/denaturation | EPHA2 functions as a homodimer at the cell surface, and residual dimeric complex can persist if samples are incompletely reduced |
| Mature receptor band running slightly below the full calculated 108.3 kDa precursor mass | Cleavage of the N-terminal 23-residue signal peptide during maturation removes a small amount of mass from the translated precursor |
| Two (or more) distinct bands separated by a modest molecular weight difference | EPHA2 is alternatively spliced into two annotated isoforms that differ in sequence length |
| Subtle upward shift or closely spaced doublet comparing stimulated versus resting lysates | Extensive serine/threonine/tyrosine phosphorylation, including autophosphorylation upon activation, can slightly alter apparent mobility |
| Predicted mass (108.3 kDa, 976 aa) | sets the baseline backbone size before any modification is accounted for |
| N-glycosylation at Asn407 and Asn435 | adds carbohydrate mass and can broaden or shift the band above the calculated 108.3 kDa mass |
| Homodimer formation | EPHA2 dimerizes at the cell surface, so a higher-order species near twice the monomer mass may appear alongside the resolved monomer if reduction/denaturation is incomplete |
| Signal peptide cleavage (residues 1-23) | removes the N-terminal signal sequence during maturation, making the mature membrane-bound receptor slightly smaller than the full translated precursor |
| Alternative splicing (isoforms 1 and 2) | produces two receptor variants that can appear as separate bands of differing apparent size, though their individual masses are not defined here |
| Extensive Ser/Thr/Tyr phosphorylation (15 modified residues, including autophosphorylation) | can cause a subtle mobility shift or doublet appearance between resting and activated receptor pools |
| Situation | Likely cause | Next action |
|---|---|---|
| No band in lysate | EPHA2 is a single-pass transmembrane cell-surface receptor that requires effective membrane solubilization; poor extraction leaves it in the insoluble fraction | use a detergent-based lysis buffer with sufficient incubation to solubilize membrane proteins and avoid discarding the pellet before loading |
| Band higher than expected | heterogeneous N-glycosylation at Asn407/Asn435 and/or persistence of homodimeric species under incomplete reduction | ensure samples are fully reduced and denatured with fresh reducing agent and adequate heating, and consider PNGase F treatment to collapse glycoform smearing |
| Broad smear instead of sharp band | heterogeneous glycan occupancy at the two N-glycosylation sites produces a range of apparent masses rather than one discrete band | treat lysate with PNGase F before SDS-PAGE to remove N-glycans and use a gradient gel for better resolution |
| Multiple bands | alternative splicing generates two annotated EPHA2 isoforms, and differential phosphorylation states can add closely spaced species | confirm which isoform region the antibody targets and compare against phosphatase-treated controls to distinguish splice variants from phospho-shifted forms |
| Band lower than expected | loss of the cleaved N-terminal signal peptide or reduced glycosylation in non-native expression systems yields a smaller, less modified species than native tissue receptor | compare against mammalian lysate controls and include protease inhibitors during lysis to prevent degradation |
| Weak or no signal | low native EPHA2 expression in some cell or tissue types, or loss of a phospho-specific epitope when the receptor is not actively signaling | confirm expression with a pan-EPHA2 antibody, load more total protein, and stimulate with ephrin-A1 ligand before lysis if using a phospho-specific antibody |
Comprehensive Human Protein Atlas IHC scoring per tissue. Rows are taken directly from the HPA tissue chart — click any row's HPA link to view the source.
| Tissue | Cell type | Level | Evidence | Source |
|---|
| Tissue | Cell type | Level | Evidence | Source |
|---|
Deeper troubleshooting and optimisation questions for EPHA2, answered from its protein features.
BosterBio's EPHA2 antibodies are among the best-performing WB antibodies on the market — well cited, thoroughly validated, and orthogonally cross-validated against negative tissues and complementary methods.
Our recommended anti-EPHA2 western blot antibodies are top-performing, extensively cited reagents validated through rigorous internal and third-party testing, including orthogonal confirmation against negative-control tissues and complementary detection methods, ensuring specific, reproducible detection of Eph receptor A2 across experimental systems.
Which to pick: Only one EPHA2 WB antibody is catalogued here: A00578, which includes an authentic western blot validation image showing specific Eph receptor A2 detection, making it the clear, single recommended choice for your experiment.