This website uses cookies to ensure you get the best experience on our website.


- Table of Contents
Plan ERAP1 chromogenic IHC using the cytoplasmic tissue pattern reported by HPA and its ER membrane location annotated by UniProt. Compare staining with HPA high expressing cells, including kidney tubule cells and hepatocytes, while keeping fixation consistent across sections.

Expected localisation, validated protocols, controls and antibodies — the at-a-glance facts below, then the full design guide.
| Expected localisation | Cytoplasmic tissue staining (HPA tissue IHC); ER membrane (UniProt) | |
| Staining pattern | General cytoplasmic staining in several tissues (HPA tissue IHC) | |
| Antigen retrieval | Citrate pH 6.0 HIER, 95–98 °C, 20 min (rule: cytoplasmic / membrane antigen) | |
| Positive control | Adipose tissue+4 more · see all | |
| Negative control | None in HPA (detected in all 45 tissues); use no-primary + isotype controls |
| Fixation | Keep fixation consistent across sections (standard IHC practice; not target-specific) | |
| Caveat | A secreted variant may alter tissue staining (HPA tissue IHC) | |
| Regulation | No specific expression regulator reported (UniProt) | |
| Isoform / epitope | 2 isoforms; epitope differences unreported; mostly luminal (UniProt) |
The catalog antibody protocol is accompanied by published paraffin section IHC protocols for placental tissue and classical Hodgkin lymphoma (PMC7076169; PMC7865538).
| Sample | Tissue sections; selected-image fixative not specified (standard IHC workflow) |
| Fixation | Image fixative and duration unreported (datasheet A02021-1); verify before use. |
| Sectioning | 4–5 µm sections on charged slides (standard) |
| Deparaffinisation | Xylene, graded ethanol series to water (standard) |
| Antigen retrieval | Heat-induced epitope retrieval in citrate buffer, pH 6.0, 20 min at 95–98 °C (standard rule: cytoplasmic / membrane antigen) |
| Peroxidase block | 3% H2O2, 10 min, room temperature (standard) |
| Blocking | 10% normal serum of the secondary host, 30 min, room temperature (standard) |
| Primary antibody | Rabbit anti-ERAP1, 1:100–1:500 starting range (standard) |
| Primary incubation | Overnight at 4 °C (standard) |
| Detection | HRP-polymer secondary, DAB chromogen 5–10 min (standard) |
| Counterstain | Hematoxylin, blue, dehydrate and mount (standard) |
| Expected result | ERAP1-positive staining in adipocytes of adipose tissue (HPA tissue IHC: High). HPA tissue profile: General cytoplasmic expression in several tissues. No signal in the no-primary control. |
In paraffin IHC, expect chiefly cytoplasmic ERAP1 staining in several tissues, including kidney tubule cells, hepatocytes, adipocytes and selected glandular cells (HPA tissue IHC: Approved; High in these cells). UniProt places ERAP1 at the endoplasmic reticulum membrane, with residues 22–941 lumenal (UniProt Q9NZ08: topology). HPA rates its tissue IHC profile Approved but reports only medium consistency with RNA expression (HPA tissue IHC: reliability description).
| Cytoplasmic chromogen is strongest in kidney tubule cells, hepatocytes or the listed glandular cells. | This fits HPA's general cytoplasmic profile and its High ratings in those cells (HPA tissue IHC: profile; High in kidney, liver, colon, duodenum, fallopian tube and gallbladder). Compare cell types within the section; a High rating does not prescribe identical intensity in every specimen (standard IHC interpretation). |
| Strong, isolated nuclear or sharply cell-surface staining dominates the paraffin section. | Treat this as a compartment mismatch with HPA's tissue IHC profile and investigate specificity and detection artefact (HPA tissue IHC: general cytoplasmic expression; standard IHC practice). HPA separately reports approved nucleoplasm, cytosol and additional plasma-membrane locations by ICC-IF; those observations do not establish the dominant paraffin IHC pattern (HPA subcellular: approved locations). |
| A low-rated cell population stains more strongly than nearby High-rated cells. | Check cell identity and specificity before calling it ERAP1 enrichment (HPA tissue IHC: Low in salivary glandular cells, vaginal squamous cells, smooth muscle cells and skeletal myocytes; High in listed positive cells). Cross-reactivity or endogenous chromogenic activity can mimic staining (standard IHC practice); HPA's Low rating is not an absence claim. |
| Chromogen spreads across tissue, blank areas or many cell types without a readable cytoplasmic pattern. | This is background until controls support a cellular signal (standard IHC practice). Review the detection-only control and section edges, then assess blocking, washing and detection conditions (standard IHC practice). HPA's Approved tissue rating does not validate background in a particular run (HPA tissue IHC: Approved). |
| No signal appears in a known High-rated positive tissue. | First assess section quality, control performance, retrieval and antibody detection in that run (standard IHC practice). A blank kidney tubule, hepatocyte or other listed High-rated population conflicts with the HPA reference pattern, but one failed stain cannot establish biological absence (HPA tissue IHC: High in kidney tubules and hepatocytes; standard IHC interpretation). |
| Cell-type reference | Use HPA's High-rated populations as positive references and its Low-rated populations as intensity comparators, not proven negatives (HPA tissue IHC: High and Low lists). ERAP1 is described as ubiquitous, so a strict tissue-negative prediction is unsupported (UniProt Q9NZ08: tissue specificity). |
| Topology and compartment | ERAP1 has one membrane segment at residues 2–21 and a lumenal region at 22–941 (UniProt Q9NZ08: topology). This supports an ER-associated interpretation, while HPA describes the visible paraffin IHC profile broadly as cytoplasmic (HPA tissue IHC: profile). |
| Protein forms and assay limits | UniProt lists 2 isoforms and 5 glycosylation sites (UniProt Q9NZ08: isoforms; glycosylation). The supplied evidence gives no antibody epitope or isoform coverage, so it cannot predict which forms a particular IHC stain detects (UniProt Q9NZ08: record; HPA antibodies: validation summary). |
| Tissue-profile reliability | HPA calls tissue IHC Approved while noting medium agreement with RNA and that at least one variant is secreted; RNA and protein locations may differ (HPA tissue IHC: reliability description). Judge the stained cells and compartment directly instead of treating RNA abundance as a slide-level intensity rule (standard IHC interpretation). |
| IF/ICC Q&A: Should IF match the paraffin IHC pattern? | ICC-IF reports approved nucleoplasm and cytosol locations, plus an additional plasma-membrane location, in its own assay (HPA subcellular: approved locations). Interpret those results in the separate IF/ICC context; the tissue IHC reference remains general cytoplasmic expression (HPA tissue IHC: profile). |
| Situation | Likely cause | Next action |
|---|---|---|
| A High-rated control tissue is blank. | The run may have inadequate retrieval, antibody detection or chromogen development (standard IHC practice); the blank result disagrees with the HPA reference (HPA tissue IHC: High list). | Check a matched positive section and detection controls, then optimize the IHC workflow using the antibody's validated instructions (standard IHC practice). No ERAP1-specific retrieval condition is supplied (HPA tissue IHC: supplied record). |
| Signal is mainly nuclear in paraffin IHC. | It differs from the general cytoplasmic tissue pattern, although nuclear localization is reported separately by ICC-IF (HPA tissue IHC: profile; HPA subcellular: nucleoplasm approved). | Check whether cytoplasmic staining is also present in High-rated cells, review controls and confirm the pattern with an independent specificity check before scoring it as expected tissue IHC (standard IHC practice). |
| Smooth muscle or skeletal myocytes dominate the stain. | Both are Low-rated HPA populations; strong staining there raises a cell-identification, specificity or background question (HPA tissue IHC: Low in smooth muscle and skeletal muscle; standard IHC interpretation). | Compare with adjacent High-rated cells where available and inspect detection-only controls; do not label Low-rated cells definitively negative (HPA tissue IHC: High and Low lists; standard IHC practice). |
| Brown signal appears in the detection-only control. | Endogenous enzyme activity or nonspecific detection can create chromogen without primary antibody (standard chromogenic IHC practice). | Address the relevant endogenous activity and detection background, repeat the control, and score ERAP1 only when the primary-dependent cellular pattern is clear (standard chromogenic IHC practice). |
| All cells and extracellular spaces look diffusely stained. | Nonspecific background can obscure the cell-resolved cytoplasmic profile (standard IHC practice; HPA tissue IHC: general cytoplasmic expression). | Review blocking, washing, section edges and chromogen development alongside controls; reassess cell-type intensity only after the background is resolved (standard IHC practice). |
| RNA abundance and tissue staining seem discordant. | HPA reports medium RNA–antibody consistency and warns that a secreted variant can make RNA and protein locations differ (HPA tissue IHC: reliability description). | Record the observed stained cell type and compartment, compare with HPA's IHC profile, and avoid inferring a failed stain from RNA alone (HPA tissue IHC: profile and reliability description; standard IHC interpretation). |


Comprehensive Human Protein Atlas IHC scoring per tissue (reliability: Approved — Medium consistency between antibody staining and RNA expression data. At least one protein variant secreted, tissue location of RNA and protein might differ and correlation is complex.). Rows are taken directly from the HPA tissue chart — click any row's HPA link to view the source.
| Tissue | Cell type | Level | Evidence | Source |
|---|---|---|---|---|
| Adipose tissue | Adipocytes | High | Protein (IHC) | HPA → |
| Colon | Glandular cells | High | Protein (IHC) | HPA → |
| Duodenum | Glandular cells | High | Protein (IHC) | HPA → |
| Fallopian tube | Glandular cells | High | Protein (IHC) | HPA → |
| Gallbladder | Glandular cells | High | Protein (IHC) | HPA → |
| Tissue | Cell type | Level | Evidence | Source |
|---|---|---|---|---|
| None in HPA: ERAP1 is detected in all 45 scored tissues. Use a no-primary (secondary-only) and an isotype control instead. | ||||
Troubleshoot ERAP1 staining in paraffin sections by checking retrieval, compartment patterns, controls and cell level scoring before interpreting chromogenic signal.
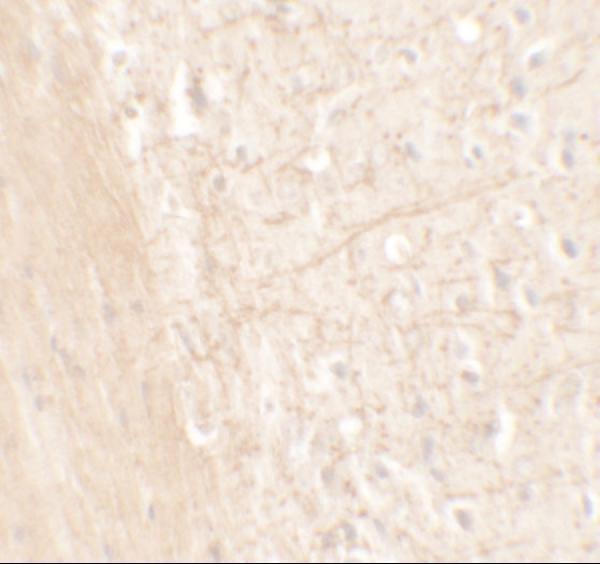
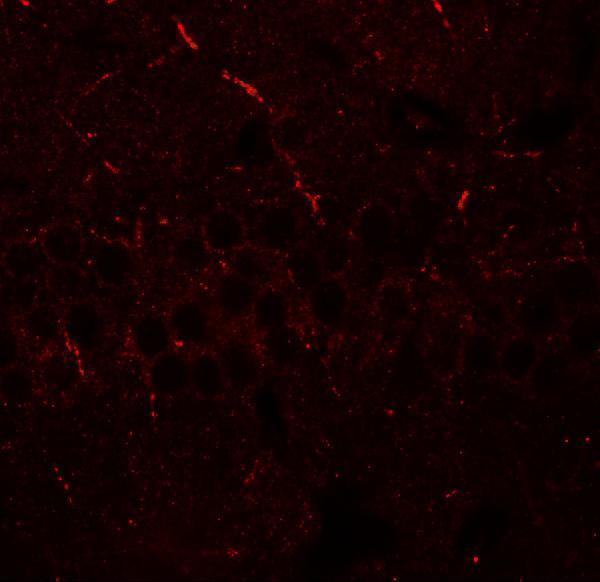
A02021-1 has mouse-brain IHC and IF images and lists human and mouse reactivity (catalog image captions; catalog reactivity). M02021-1 lists IHC and human, mouse and rat reactivity (catalog applications/reactivity).
A02021-1 is the SKU with a rendered card; its IHC image shows mouse brain stained at 5 μg/mL (IHC image caption). Its IF image also shows mouse brain, stained at 20 μg/mL (IF image caption).
Which to pick: For tissue IHC, choose A02021-1 for its IHC-P listing and mouse-brain IHC image; the caption does not report the fixative (catalog applications; IHC image caption). For IF, choose A02021-1 based on its mouse-brain IF image; ICC validation is unreported (IF image caption; catalog applications). If rat reactivity is needed, M02021-1 lists rat and IHC and is rabbit monoclonal, but its payload provides no IHC image or rat IHC validation (catalog reactivity/applications; catalog host/clone; catalog image captions).