This website uses cookies to ensure you get the best experience on our website.


- Table of Contents
Plan FLOT1 staining in paraffin sections using 2–5 μg/mL catalog antibody (datasheet PA2033). Assess cytoplasmic and membranous staining, with breast glandular cells as a reported high expression reference (HPA tissue IHC).

Expected localisation, validated protocols, controls and antibodies — the at-a-glance facts below, then the full design guide.
| Expected localisation | Cytoplasmic and membranous staining in most tissues (HPA tissue IHC) | |
| Staining pattern | Cells in most tissues show cytoplasmic and membranous staining (HPA tissue IHC) | |
| Antigen retrieval | EDTA pH 8.0 HIER, heat-mediated (datasheet PA2033) | |
| Positive control | Bone marrow+4 more · see all | |
| Negative control | Oral mucosa |
| Fixation | Keep fixation consistent across sections (standard IHC practice; not target-specific) | |
| Caveat | Oral squamous cells may show no staining (HPA tissue IHC) | |
| Regulation | Regulation not specified (UniProt) | |
| Isoform / epitope | 2 isoforms; epitope differences unspecified (UniProt) |
The catalog antibody’s IHC protocol is paired here with published FLOT1 staining methods for liver and ovarian paraffin sections (datasheet PA2033; PMC3694104; PMC12070024).
| Sample | Paraffin-embedded human stomach camcer tissue; fixative not specified (datasheet PA2033) |
| Fixation | Image fixative and duration unreported (datasheet PA2033); verify before use. |
| Sectioning | 4–5 µm sections on charged slides (standard) |
| Deparaffinisation | Xylene, graded ethanol series to water (standard) |
| Antigen retrieval | Heat retrieval: EDTA pH 8.0 (datasheet PA2033); 20 min, 95–100 °C (standard) |
| Peroxidase block | 3% H2O2, 10 min, room temperature (standard) |
| Blocking | 10% goat serum (datasheet PA2033) |
| Primary antibody | Rabbit anti-FLOT1, 2-5 μg/ml (datasheet PA2033) |
| Primary incubation | Overnight at 4 °C (datasheet PA2033) |
| Detection | HRP-conjugated secondary, DAB chromogen (datasheet PA2033) |
| Counterstain | Hematoxylin, blue, dehydrate and mount (standard) |
| Expected result | FLOT1-positive staining in hematopoietic cells of bone marrow (HPA tissue IHC: High). HPA tissue profile: Cytoplasmic and membranous expression in most tissues. No signal in the no-primary control. |
Expect membranous and cytoplasmic FLOT1 staining across many tissues, including high staining in breast glandular cells and cerebral cortical neurons (HPA tissue IHC: Enhanced; medium consistency with RNA). FLOT1 associates with cell membranes, caveolae and endosomes without a transmembrane segment (UniProt O75955 localization and topology).
| Distinct membrane-associated and cytoplasmic chromogen in breast glandular cells or cerebral cortical neurons. | This fits the reported compartments and high staining in those cell types (HPA tissue IHC). Compare staining within intact cells; diffuse color over the whole section is less convincing than a cell-resolved pattern. |
| Strong nuclear staining dominates while the membrane and cytoplasm show little or no signal. | Nuclear localization is absent from the supplied localization records (UniProt O75955; HPA tissue IHC). Treat a predominantly nuclear result as suspect and check controls, detection background and antibody specificity before scoring it as FLOT1. |
| Strong signal appears in oral mucosal squamous epithelium, with the expected glandular or neuronal pattern absent. | HPA reports FLOT1 as not detected in oral mucosal squamous cells and high in the listed glandular cells and neurons (HPA tissue IHC). Investigate cross-reactivity or endogenous detection activity; a single discrepant section cannot establish the cause. |
| Pale, diffuse chromogen covers cells and surrounding tissue without clear cell boundaries. | This does not resolve the reported cytoplasmic and membranous pattern (HPA tissue IHC). Review background in the negative control and optimize blocking, antibody concentration and chromogen development using general IHC practice. |
| No staining appears in a well-preserved breast glandular-cell or cerebral cortical neuronal region. | Those cells are reported as high staining (HPA tissue IHC). Check whether the positive control worked, then review retrieval, antibody incubation and detection as general IHC troubleshooting steps; absence alone does not identify which step failed. |
| Compartment and topology | FLOT1 is associated with cell membranes, caveolae and endosomes and has no transmembrane segment (UniProt O75955). In paraffin IHC, assess membrane-associated and cytoplasmic staining together; this topology alone does not predict an antibody's epitope accessibility. |
| Choice of positive and comparison tissue | HPA reports high staining in breast glandular cells, cerebral cortical neurons and several other listed populations, but no detection in oral mucosal squamous cells (HPA tissue IHC). Use the latter as a pattern comparison, not proof of absolute biological absence. |
| Breadth and reliability of tissue staining | The tissue profile describes cytoplasmic and membranous expression in most tissues, with low RNA tissue specificity (HPA tissue IHC). Its Enhanced reliability carries a stated caveat: antibody staining and RNA expression have medium consistency (HPA tissue IHC). |
| Antibody validation | Both listed antibodies, HPA001393 and CAB007766, have Enhanced IHC validation (HPA antibodies). That supports comparison with the reported IHC pattern; it does not make every positive cell or staining compartment specific without suitable section controls. |
| Isoforms and modified residues | UniProt lists 2 isoforms and annotated phosphorylation sites, including residues 19, 163, 385 and 387 (UniProt O75955). Antibody epitope data are absent from this payload, so no isoform-specific staining or retrieval effect can be predicted. |
| IF/ICC Q&A | Q: Should IF/ICC look identical to paraffin IHC? A: HPA places IF signal mainly at the Golgi apparatus, marked uncertain, with supported plasma-membrane localization and uncertain vesicles (HPA subcellular). Interpret that separate assay on its own evidence. |
| Situation | Likely cause | Next action |
|---|---|---|
| The expected positive tissue is blank. | A failed retrieval, primary-antibody incubation or detection step is possible; HPA reports high staining in breast glandular cells (HPA tissue IHC). | Check a known-positive section in the same run. Review retrieval and reagent steps against the antibody's validated IHC instructions; the supplied sources give no FLOT1-specific retrieval condition. |
| Every section shows diffuse brown haze. | Nonspecific binding or overdeveloped chromogen can create diffuse IHC background (general IHC practice). | Inspect the negative control, then adjust blocking, antibody concentration and development time according to the validated assay. Score only staining with recognizable cell boundaries and compartments. |
| Chromogen appears in the negative control. | Endogenous enzyme activity or the detection reagents may contribute signal in chromogenic IHC (general IHC practice). | Confirm the primary-antibody omission control and apply the detection system's appropriate endogenous-activity block. Reassess the tissue pattern only after the control background is resolved. |
| Nuclear staining dominates. | The supplied records describe membrane and cytoplasmic or endosomal localization, not nuclear localization (HPA tissue IHC; UniProt O75955). | Compare with a positive control and negative control, examine whether cytoplasmic and membranous staining is also present, and investigate antibody or detection background before assigning a FLOT1 score. |
| Oral mucosal squamous cells stain strongly. | HPA reports FLOT1 as not detected in that cell population (HPA tissue IHC); cross-reactivity or background is possible, but the observation alone cannot distinguish them. | Review tissue identity and control slides, then compare intensity and compartment with an HPA high-staining population processed in the same run (HPA tissue IHC). |
| IF/ICC shows a Golgi-rich pattern that differs from the paraffin IHC section. | HPA's main Golgi IF location is marked uncertain; plasma-membrane IF localization is supported, while tissue IHC is cytoplasmic and membranous (HPA subcellular; HPA tissue IHC). | Interpret each assay against its own HPA record and controls. Do not treat the uncertain IF Golgi call as a required paraffin IHC pattern. |
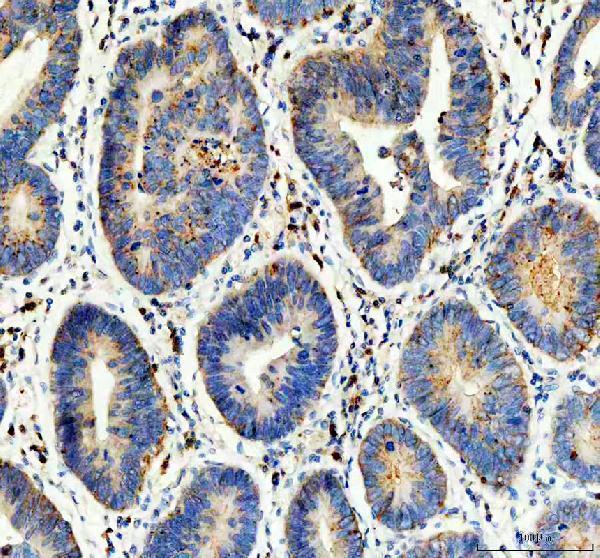
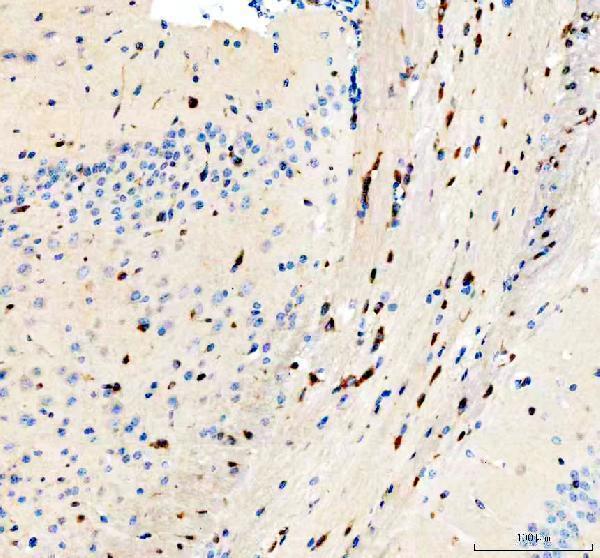
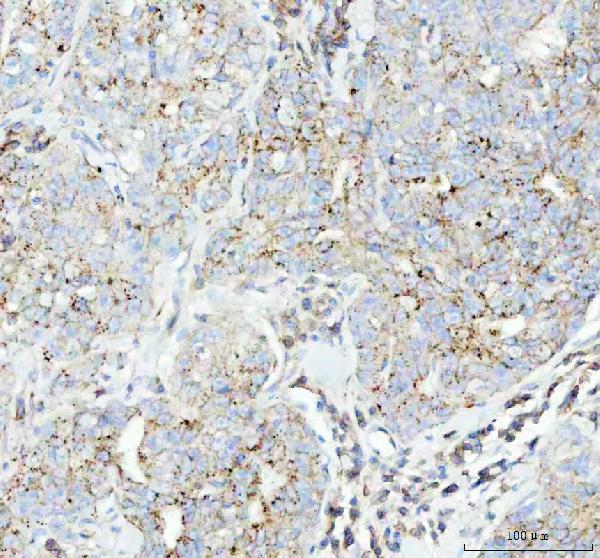
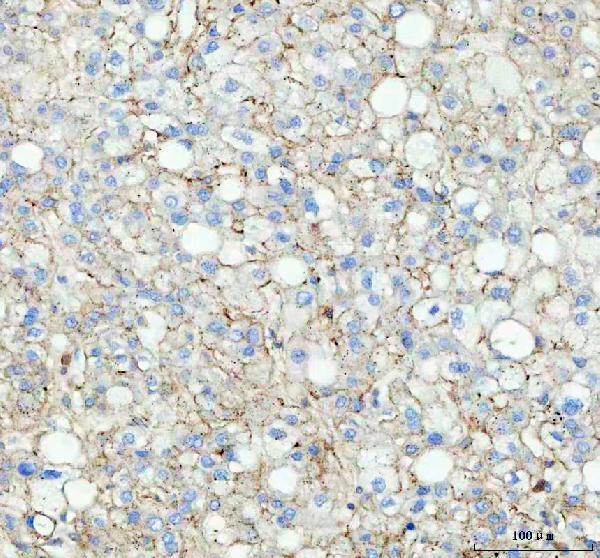
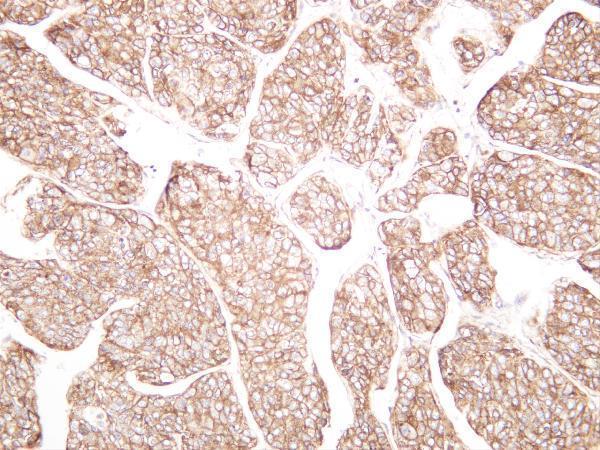
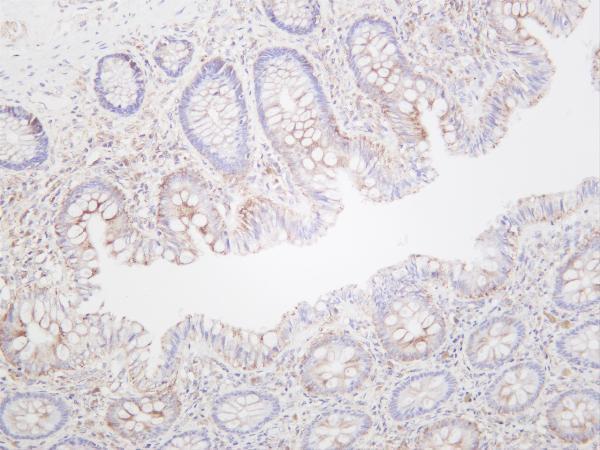
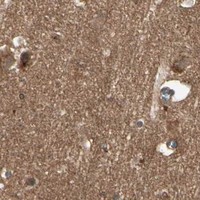


Comprehensive Human Protein Atlas IHC scoring per tissue (reliability: Enhanced — Medium consistency between antibody staining and RNA expression data.). Rows are taken directly from the HPA tissue chart — click any row's HPA link to view the source.
| Tissue | Cell type | Level | Evidence | Source |
|---|---|---|---|---|
| Bone marrow | Hematopoietic cells | High | Protein (IHC) | HPA → |
| Breast | Glandular cells | High | Protein (IHC) | HPA → |
| Bronchus | Respiratory epithelial cells | High | Protein (IHC) | HPA → |
| Cerebral cortex | Neuronal cells | High | Protein (IHC) | HPA → |
| Endometrium | Glandular cells | High | Protein (IHC) | HPA → |
| Tissue | Cell type | Level | Evidence | Source |
|---|---|---|---|---|
| Oral mucosa | Squamous epithelial cells | Not detected | Protein (IHC) | HPA → |
Troubleshoot chromogenic FLOT1 staining in paraffin sections using the PA2033 tissue image and the reported tissue and subcellular patterns (PA2033 caption; HPA tissue IHC; HPA subcellular).
Anti-FLOT1 antibodies have IHC images from human stomach, breast, liver and colon samples, plus mouse and rat brain; two also list IF (catalog image captions and applications).
PA2033 has paraffin-section IHC images from human stomach cancer and mouse and rat brain, and lists IF; M05980 has paraffin-section IHC images from human breast, liver and lung cancers (catalog image captions and applications). M04517-1 has IHC images from human hepatocellular carcinoma and colon and lists IF (catalog image captions and applications).
Which to pick: For paraffin-section IHC, choose PA2033 for the documented 2 μg/ml staining in human stomach cancer or mouse and rat brain, or M05980 for its documented 1:50 staining in human breast, liver and lung cancers; the fixative is unreported in both captions (catalog image captions). For IF, consider PA2033 at its listed 5 μg/ml or the monoclonal M04517-1 at 1:200–1:1000; neither has an IF image here, and ICC validation is unreported (catalog applications, dilutions and image captions). All three list human, mouse and rat reactivity, but PA2033 supplies IHC images for each species (catalog reactivity and image captions).