This website uses cookies to ensure you get the best experience on our website.


- Table of Contents
Plan GLS2 chromogenic IHC in paraffin sections using the documented fixation and antibody conditions (datasheet A05334). Compare cytoplasmic staining with the tissue profile while accounting for its uncertain specificity (HPA tissue IHC).

Expected localisation, validated protocols, controls and antibodies — the at-a-glance facts below, then the full design guide.
| Expected localisation | Cytoplasmic tissue staining (HPA tissue IHC); mitochondrial protein (UniProt) | |
| Staining pattern | Cytoplasmic staining in liver, CNS and pancreas (HPA tissue IHC) | |
| Antigen retrieval | Citrate pH 6 HIER, heat-mediated (datasheet A05334) | |
| Positive control | Adrenal gland+4 more · see all | |
| Negative control | Adipose tissue+2 more · see all |
| Fixation | Use formaldehyde-fixed paraffin sections (selected-SKU IHC image A05334); keep fixation consistent (standard IHC practice; not target-specific) | |
| Caveat | Presumed off-target binding; verify specificity (HPA tissue IHC) | |
| Regulation | Reduced in hepatocellular carcinomas (UniProt) | |
| Isoform / epitope | Two isoforms; map epitopes to mature chain 15–602 (UniProt) |
The catalog antibody’s IHC-P protocol (datasheet A05334) is accompanied by two published GLS2 protocols for paraffin sections (PMC4480704; PMC7215180).
| Sample | Formaldehyde-fixed, paraffin-embedded human liver tissue (datasheet A05334) |
| Fixation | Image formalin-fixed; duration unreported (datasheet A05334); verify before use. |
| Sectioning | 4–5 µm sections on charged slides (standard) |
| Deparaffinisation | Xylene, graded ethanol series to water (standard) |
| Antigen retrieval | Heat retrieval: Citrate pH 6 (datasheet A05334); 20 min, 95–100 °C (standard) |
| Peroxidase block | 3% H2O2, 10 min, room temperature (standard) |
| Blocking | 10% serum (datasheet A05334) |
| Primary antibody | Rabbit anti-GLS2, 0.5-2 μg/mL (datasheet A05334) |
| Primary incubation | Overnight at 4 °C (standard) |
| Detection | HRP-polymer secondary, DAB chromogen 5–10 min (standard) |
| Counterstain | Hematoxylin, blue, dehydrate and mount (standard) |
| Expected result | GLS2-positive staining in glandular cells of adrenal gland (HPA tissue IHC: High). HPA tissue profile: Cytoplasmic expression in liver, CNS and pancreas. No signal in the no-primary control. |
GLS2 is mitochondrial and has no transmembrane segment (UniProt Q9UI32 topology). In paraffin section IHC, expect cytoplasmic staining in liver, CNS and pancreas, with liver the strongest tissue expectation from UniProt expression (HPA: tissue IHC profile; UniProt Q9UI32 tissue specificity). Interpret that pattern cautiously: HPA rates its tissue IHC reliability Uncertain because presumed off target binding was observed and disregarded, pending external verification (HPA: tissue IHC reliability).
| Cytoplasmic staining in liver cells, with a granular appearance if resolved. | This fits the reported liver expression and mitochondrial location (HPA: tissue IHC profile; UniProt Q9UI32 location). Granularity is a plausible mitochondrial appearance in chromogenic IHC, not a validated GLS2 scoring requirement (general IHC practice). Compare signal with adjacent tissue and controls before calling it specific, given HPA's Uncertain IHC reliability (HPA: tissue IHC reliability). |
| Predominantly nuclear, cell surface or extracellular staining. | These compartments conflict with the mitochondrial assignment and lack of a transmembrane segment (UniProt Q9UI32 location and topology). Treat a compartment mismatch as possible nonspecific staining or artefact, particularly if cytoplasmic signal is absent (general IHC practice); HPA does not provide a verified alternate GLS2 location here (HPA: tissue IHC reliability). |
| Strong staining in a cell population expected to be negative on the comparison slide. | Assess the cell type, not just the tissue name: HPA reports no detection in skeletal muscle myocytes, adipocytes and smooth muscle cells, but High staining in several glandular or squamous epithelial populations (HPA: tissue IHC levels). Unexpected staining can reflect cross reactivity or endogenous detection activity; it does not establish GLS2 expression on its own (general IHC practice). |
| Uniform color over cells, stroma and empty areas. | A diffuse deposit without cell boundaries or a cytoplasmic pattern is poor evidence for mitochondrial GLS2 (UniProt Q9UI32 location; general IHC practice). Consider nonspecific antibody binding, inadequate blocking, chromogen overdevelopment or endogenous detection activity as general IHC causes; HPA has flagged presumed off target binding for its tissue IHC profile (HPA: tissue IHC reliability). |
| No visible staining in liver on an otherwise readable section. | This is discordant with high liver expression and HPA's liver profile (UniProt Q9UI32 tissue specificity; HPA: tissue IHC profile). First check whether tissue, counterstain and detection controls are interpretable; then review retrieval, antibody dilution and detection settings as general IHC variables (general IHC practice). An absent signal alone cannot distinguish assay failure from specimen variation. |
| Tissue and cell context | UniProt reports high liver expression, with expression in brain and pancreas, while HPA describes cytoplasmic staining in liver, CNS and pancreas (UniProt Q9UI32 tissue specificity; HPA: tissue IHC profile). HPA also lists High staining in selected glandular and squamous cells outside that summary, but its IHC reliability is Uncertain; use those entries as observations to verify, not definitive specificity controls (HPA: tissue IHC levels and reliability). |
| Intracellular location and processing | GLS2 is assigned to mitochondria, lacks a transmembrane segment and has a reported mature chain spanning residues 15–602 (UniProt Q9UI32 location, topology and processing). These annotations support a cytoplasmic mitochondrial pattern, but do not identify the antibody epitope or predict the appearance of every processed form in a section (UniProt Q9UI32 processing; general IHC practice). |
| Isoforms and epitope coverage | UniProt lists 2 isoforms, but the supplied records do not locate this antibody's epitope or establish isoform specific IHC recognition (UniProt Q9UI32 isoforms; HPA: antibody record). If staining differs among samples, do not assign the difference to an isoform without separate epitope and specificity evidence (general IHC practice). |
| Antibody evidence and controls | HPA lists rabbit polyclonal HPA038608 with IHC status Uncertain; its tissue profile notes presumed off target binding and pending external verification (HPA: antibody record and tissue IHC reliability). Interpret its pattern alongside a matched negative control and an independently supported positive tissue, while recognising that a clean control cannot by itself prove target specificity (general IHC practice). |
| IF/ICC: what pattern is established? | Mitochondrial signal is the expectation from UniProt, but HPA supplies no ICC/IF images or main subcellular location for GLS2 (UniProt Q9UI32 location; HPA: subcellular record). Treat an IF/ICC pattern as a separate question requiring its own validation; the tissue IHC observations do not establish an IF/ICC result (HPA: tissue IHC and subcellular records). |
| Situation | Likely cause | Next action |
|---|---|---|
| Liver signal is absent or very weak. | High liver expression makes this discordant, though the supplied sources give no target specific fixation or retrieval sensitivity (UniProt Q9UI32 tissue specificity; HPA: tissue IHC profile). | Check section integrity and detection controls, then compare retrieval and antibody dilution conditions as general IHC variables; record which change restores a cell restricted pattern (general IHC practice). |
| A negative comparison tissue shows strong color. | HPA reports no detection in skeletal muscle myocytes, adipocytes and smooth muscle cells; color there may reflect nonspecific binding or endogenous detection activity (HPA: tissue IHC levels; general IHC practice). | Confirm the stained cell type, inspect the negative reagent control, and adjust blocking or detection conditions only as needed; reassess liver and negative tissue together (general IHC practice). |
| Nuclei dominate the stain. | A dominant nuclear pattern does not match mitochondrial GLS2 localization (UniProt Q9UI32 location). Overstain or nonspecific binding can obscure the true compartment (general IHC practice). | Compare the no primary control and shorten detection development if background is high; seek reproducible cytoplasmic signal before assigning GLS2 positivity (general IHC practice). |
| Background hides cell boundaries. | Diffuse color can arise from nonspecific binding, incomplete blocking or excessive detection development (general IHC practice); HPA's IHC reliability is Uncertain (HPA: tissue IHC reliability). | Review negative reagent controls, blocking, washes and detection development, then judge whether signal remains concentrated in the expected cells (general IHC practice). |
| An unexpected glandular or squamous cell population stains strongly. | HPA records High staining in several such populations outside its brief liver, CNS and pancreas profile, but flags presumed off target binding (HPA: tissue IHC levels, profile and reliability). | Record the tissue and cell type precisely; require independent specificity evidence before interpreting that color as GLS2 expression (general IHC practice). |
| IF/ICC shows a diffuse or conflicting pattern. | HPA provides no GLS2 ICC/IF images or assigned main subcellular location, so its tissue IHC profile cannot validate the IF/ICC result (HPA: subcellular and tissue IHC records). | Evaluate IF/ICC with its own controls and mitochondrial reference while treating UniProt's mitochondrial assignment as the localization expectation (general IF practice; UniProt Q9UI32 location). |
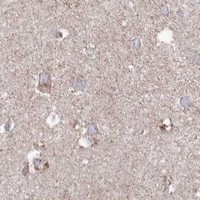


Comprehensive Human Protein Atlas IHC scoring per tissue (reliability: Uncertain — Presumed off target binding observed and disregarded. Pending external verification.). Rows are taken directly from the HPA tissue chart — click any row's HPA link to view the source.
| Tissue | Cell type | Level | Evidence | Source |
|---|---|---|---|---|
| Adrenal gland | Glandular cells | High | Protein (IHC) | HPA → |
| Appendix | Glandular cells | High | Protein (IHC) | HPA → |
| Cervix | Squamous epithelial cells | High | Protein (IHC) | HPA → |
| Colon | Glandular cells | High | Protein (IHC) | HPA → |
| Duodenum | Glandular cells | High | Protein (IHC) | HPA → |
Troubleshoot GLS2 staining in paraffin sections by checking retrieval, controls, cytoplasmic localisation and cell specific scoring before interpreting signal.
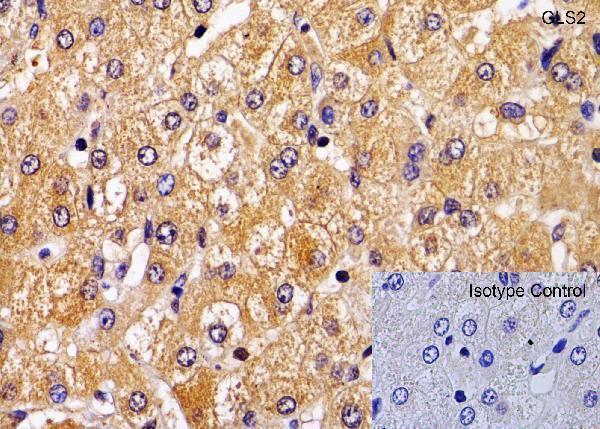
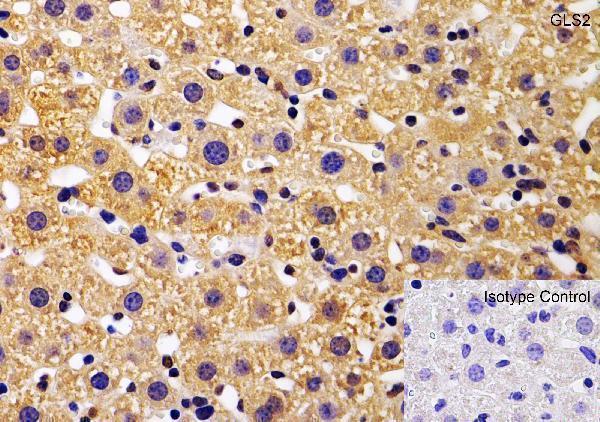
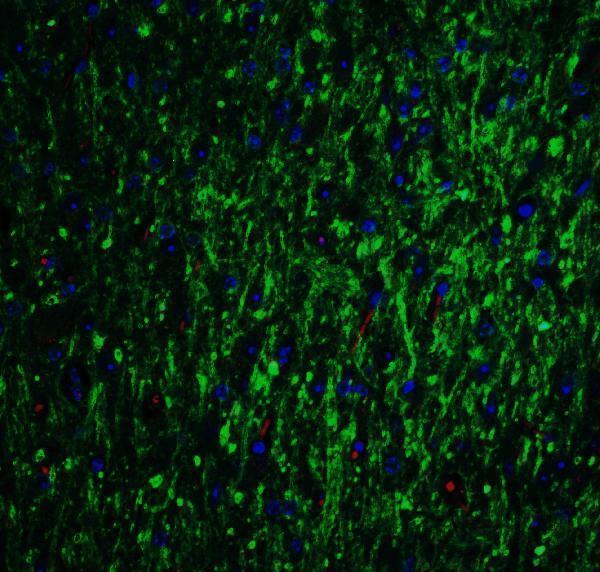
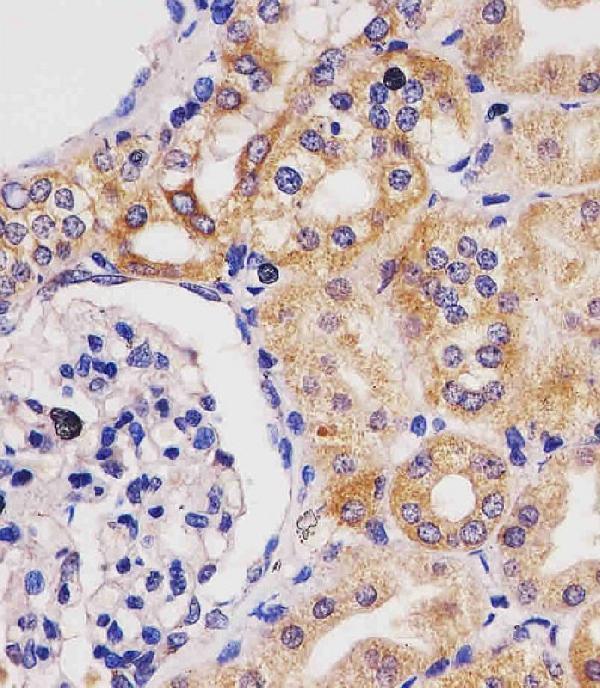
GLS2 IHC images cover human and mouse liver, rat brain, and human kidney; an IF image covers mouse brain (catalog image captions).
A05334 has IHC images from human and mouse liver and rat brain, plus an IF image from mouse brain (A05334 image captions). M05334 has an IHC image from human kidney (M05334 image caption).
Which to pick: For paraffin-section IHC, choose A05334 for the pictured liver or brain samples, or M05334 for the pictured human kidney sample; both captions report formaldehyde fixation and citrate pH 6 retrieval (A05334 and M05334 IHC captions). For IF, choose A05334: its mouse-brain IF image uses paraformaldehyde-fixed tissue; ICC validation is unreported (A05334 IF caption and applications; M05334 applications). For cross-species IHC, A05334 has pictured human, mouse, and rat samples and is polyclonal; M05334 is monoclonal, lists human and mouse reactivity, and pictures human kidney (catalog dilution notes, reactivity, and IHC captions).