GOLM1 / Golgi membrane protein 1 · IHC design guide

Design Immunohistochemistry for GOLM1

Plan chromogenic IHC on paraffin sections using GOLM1’s granular cytoplasmic tissue pattern as a guide (HPA tissue IHC). Compare glandular positive controls with negative cell populations and account for liver expression changes associated with HBV or HCV infection (HPA tissue IHC; UniProt).

Evidence assembled Oct 2026 · For research use; verify linked source records and product datasheet before use
Immunohistochemistry protocol sheet for GOLM1 (IHC for GOLM1): expected localisation Granular cytoplasm (HPA tissue IHC); cis-Golgi membrane (UniProt), antibody A02975-3, validated IHC image, and IHC protocol steps
Printable GOLM1 IHC protocol sheet — expected localisation Granular cytoplasm (HPA tissue IHC); cis-Golgi membrane (UniProt), antibody A02975-3, controls and protocol steps. Open the full GOLM1 IHC guide →

GOLM1 Immunohistochemistry Experimental Design Guide

Expected localisation, validated protocols, controls and antibodies — the at-a-glance facts below, then the full design guide.

Must know before staining
Expected localisation Granular cytoplasm (HPA tissue IHC); cis-Golgi membrane (UniProt)
Staining pattern Granular cytoplasmic staining in most tissues (HPA tissue IHC)
Antigen retrieval EDTA pH 8.0 HIER, heat-mediated (datasheet A02975-3)
Positive control ⓘ Appendix+4 more · see all
Negative control ⓘ Adipose tissue+4 more · see all
Important caveats
Reasons your staining may differ from the expected pattern.
Fixation Keep fixation consistent across sections (standard IHC practice; not target-specific). Selected-image fixative and duration unreported (datasheet A02975-3); verify before use.
Caveat Normal liver: biliary cells express GOLM1; hepatocytes do not (UniProt)
Regulation Increases in HBV/HCV-infected liver (UniProt)
Isoform / epitope 2 isoforms; epitope coverage unknown; residues 1–12 cytoplasmic, 36–401 lumenal (UniProt)
Section 1

Recommended GOLM1 IHC & IF Protocols

The catalog antibody protocol is followed by published GOLM1 IHC methods for lymphoma, prostate tissue, and head and neck cancer (PMC10388734; PMC10071148; PMC9737887).

Recommended immunohistochemistry (IHC-P) protocol parameters
SampleParaffin-embedded human esophageal squamous carcinoma tissue; fixative not specified (datasheet A02975-3)
FixationImage fixative and duration unreported (datasheet A02975-3); verify before use.
Sectioning4–5 µm sections on charged slides (standard)
DeparaffinisationXylene, graded ethanol series to water (standard)
Antigen retrievalHeat retrieval: EDTA pH 8.0 (datasheet A02975-3); 20 min, 95–100 °C (standard)
Peroxidase block3% H2O2, 10 min, room temperature (standard)
Blocking10% goat serum (datasheet A02975-3)
Primary antibodyRabbit anti-GOLM1, 2-5μg/ml (datasheet A02975-3)
Primary incubationOvernight at 4 °C (datasheet A02975-3)
DetectionStreptavidin-biotin complex (SABC), DAB chromogen (datasheet A02975-3)
CounterstainHematoxylin, blue, dehydrate and mount (standard)
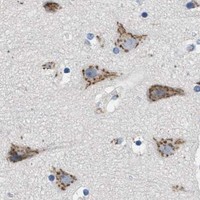
Expected resultGOLM1-positive staining in glandular cells of appendix (HPA tissue IHC: High). HPA tissue profile: Cytoplasmic expression with a granular pattern in most tissues. No signal in the no-primary control.
💡Decision noteStart with the catalog antibody’s heat-mediated EDTA pH 8.0 retrieval (datasheet: A02975-3); citrate pH 6.0 is a published alternative (PMC9737887).
Section 2

What Is the Expected GOLM1 Staining Pattern?

GOLM1 is a membrane protein of the early Golgi and cis-Golgi network, with a short cytoplasmic segment and a lumenal region (UniProt Q8NBJ4 topology). In paraffin-section IHC, expect granular cytoplasmic staining, especially in glandular epithelial cells and kidney distal tubules (HPA tissue IHC). HPA rates the tissue staining profile Enhanced, citing high consistency between antibody staining and RNA expression (HPA tissue IHC).

What am I looking at on my slide?
Granular cytoplasmic staining in stomach or prostate glandular cells, or kidney distal tubules (HPA tissue IHC).This fits the reported high staining in those cells (HPA tissue IHC) and GOLM1's Golgi localisation (UniProt Q8NBJ4; HPA ICC-IF). Score the relevant cells and their cytoplasmic pattern; do not treat every cell in a positive tissue as an expected positive (standard IHC practice).
Predominantly nuclear staining, or a uniform outline of the plasma membrane, without the expected cytoplasmic granules.That compartment does not match the reported granular cytoplasmic tissue pattern or enhanced Golgi localisation (HPA tissue IHC; HPA ICC-IF). Treat it as suspect until antibody specificity and detection background are checked; localisation alone cannot establish the cause (standard IHC practice).
Strong staining in adipocytes, cardiomyocytes, or lymph-node germinal center cells (HPA tissue IHC).HPA reports GOLM1 as not detected in those specific cell populations (HPA tissue IHC). Check a no-primary control and the antibody's validation before assigning the signal to GOLM1; cross-reactivity or endogenous detection activity are possible explanations, not diagnoses from the slide alone (standard IHC practice).
Widespread, diffuse colour obscures cell boundaries and the expected granular pattern.A diffuse field is hard to reconcile with HPA's granular cytoplasmic profile (HPA tissue IHC). Review the no-primary control, blocking, washing and chromogen development; nonspecific binding or detection background can obscure a genuine cellular signal (standard IHC practice).
No staining in stomach or prostate glandular cells, or kidney distal tubules (HPA tissue IHC).Those are reported high-staining populations, so their absence makes the run difficult to interpret (HPA tissue IHC). Check tissue identity and preservation, the IHC antibody's validated use, and the detection controls before calling the sample negative (standard IHC practice). This record supplies no GOLM1-specific fixation sensitivity.
💡Expected GOLM1 appearanceCall a convincing positive when glandular epithelial cells or kidney distal tubules show clear granular cytoplasmic staining, potentially high in the listed positive tissues (HPA tissue IHC); predominant nuclear or diffuse field-wide colour is suspect against the reported Golgi and tissue patterns (UniProt Q8NBJ4; HPA ICC-IF; HPA tissue IHC).
How each factor affects the staining
Cell population and tissueHPA reports high staining in glandular cells of stomach, prostate, appendix, duodenum, endometrium, gallbladder and rectum, and in kidney distal tubules (HPA tissue IHC). Its not-detected calls apply to the named cells within negative tissues, not necessarily every cell in those sections (HPA tissue IHC).
Subcellular position and topologyGOLM1 occupies the early Golgi and cis-Golgi network membrane; residues 1–12 are cytoplasmic and 36–401 lumenal (UniProt Q8NBJ4). HPA's ICC-IF localisation to the Golgi supports the compartment call, but does not prescribe an IHC retrieval or permeabilisation condition (HPA ICC-IF).
Antibody evidenceHPA lists IHC as Enhanced for HPA010638, HPA011929 and CAB015341 (HPA antibodies). That validation supports comparing their tissue patterns; it does not establish the performance, dilution or epitope of a different catalog antibody (HPA antibodies; standard IHC practice).
Liver contextUniProt reports low expression in normal liver, constitutive expression in biliary epithelial cells, and increased expression in virus-infected liver (UniProt Q8NBJ4). Interpret hepatocyte staining in its clinical context rather than using diseased liver as a universal positive control (UniProt Q8NBJ4).
IF/ICC cross-check: what is expected?Golgi localisation is the reported IF/ICC result, with images listed for A-431, U-251MG and U2OS (HPA ICC-IF). This is a localisation cross-check for an IHC finding; IF/ICC workflow belongs to its own guide (HPA ICC-IF).
Why is my staining missing, weak or wrong?
SituationLikely causeNext action
The known-positive glandular cells are blank.The result conflicts with HPA's high calls for stomach and prostate glandular cells (HPA tissue IHC); the cause is undetermined.Confirm the section contains the intended cells, then review the catalog antibody's IHC validation and run controls for retrieval and detection (standard IHC practice).
Only nuclei are strongly coloured.Nuclear dominance conflicts with the reported Golgi localisation and granular cytoplasmic IHC profile (HPA ICC-IF; HPA tissue IHC).Compare with a known-positive section and a no-primary control; verify that the scored colour comes from the intended detection channel (standard IHC practice).
A reportedly negative cell population stains strongly.HPA calls adipocytes, cardiomyocytes and lymph-node germinal center cells not detected; staining there needs independent assessment (HPA tissue IHC).Identify the stained cells on the section, inspect the no-primary control for endogenous detection activity, and review antibody specificity (standard IHC practice).
Brown colour is diffuse across the section.Diffuse colour may be detection background and obscures the granular cytoplasmic pattern reported by HPA (HPA tissue IHC; standard IHC practice).Review blocking, washing and chromogen development alongside a no-primary control; score cellular staining only when its boundaries are clear (standard IHC practice).
A liver section shows uneven hepatocyte staining.Normal liver expression is low, while UniProt describes increased expression in virus-infected liver and some advanced disease settings (UniProt Q8NBJ4).Record whether signal is in hepatocytes or biliary epithelium, and interpret it with the specimen context and run controls (UniProt Q8NBJ4; standard IHC practice).
An IF image appears Golgi-localised but the IHC slide is blank.HPA supports Golgi localisation by ICC-IF and high staining in selected IHC cell populations, but the two preparations do not prove identical assay sensitivity (HPA ICC-IF; HPA tissue IHC; standard IHC practice).Check the IHC section's expected cell population and IHC controls; use the separate IF/ICC guide for that assay's workflow (HPA tissue IHC; standard IHC practice).

Sample controls for GOLM1 IHC & IF

🧪Run duodenum first: glandular cells should show strong staining (HPA: High in duodenal glandular cells). Use normal esophagus as the negative tissue, focusing on squamous epithelial cells (HPA: Not detected in esophageal squamous epithelial cells); on the duodenal slide, adjacent nonglandular cells should lack the strong glandular staining pattern, but their GOLM1 status is not established by the supplied HPA row.
Positive control tissue: Appendix (Glandular cells, HPA High)
Negative control tissue: Adipose tissue (HPA Not detected)
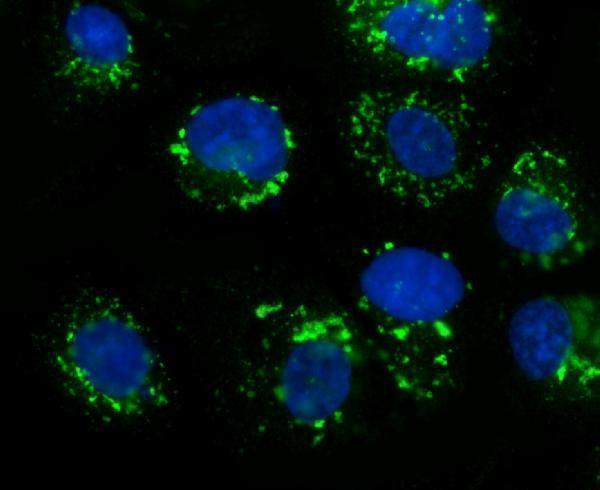
ICC-IF cell lines (HPA subcellular resource): HPA ICC-IF images show GOLM1 in A-431, U-251MG, U2OS, with annotated localisation: Golgi apparatus (enhanced) (HPA subcellular).
Technical controls: Include a no-primary, secondary-only control; a concentration-matched isotype control appropriate to the primary antibody’s host species and clonality; and GOLM1-knockout material or a validated peptide-block control (standard IHC practice). For chromogenic detection, block endogenous peroxidase and, if using the caption’s biotin-based detection system, assess endogenous biotin background in duodenum (selected-SKU tissue-IHC caption: SABC with DAB).
⚠️Feasibility: A target-specific fixation window or fixation effect is unreported, and the exact A02975-3 tissue-IHC caption does not state a fixative (selected-SKU tissue-IHC caption: fixative not stated). The caption documents heat retrieval in EDTA at pH 8.0 for a paraffin section, but does not establish that retrieval is required; frozen-section or IF ease cannot be determined from the supplied evidence (selected-SKU tissue-IHC caption: heat retrieval in EDTA, pH 8.0). In duodenum, evaluate glandular staining against the biotin-based detection controls because endogenous biotin can produce background (standard IHC practice).

HPA tissue IHC evidence for GOLM1

Comprehensive Human Protein Atlas IHC scoring per tissue (reliability: Enhanced — High consistency between antibody staining and RNA expression data.). Rows are taken directly from the HPA tissue chart — click any row's HPA link to view the source.

Positive expression · recommended positive controls

TissueCell typeLevelEvidenceSource
Appendix Glandular cells High Protein (IHC) HPA →
Duodenum Glandular cells High Protein (IHC) HPA →
Endometrium Glandular cells High Protein (IHC) HPA →
Gallbladder Glandular cells High Protein (IHC) HPA →
Kidney Distal tubules High Protein (IHC) HPA →

Undetected expression · recommended negative controls

TissueCell typeLevelEvidenceSource
Adipose tissue Adipocytes Not detected Protein (IHC) HPA →
Bone marrow Hematopoietic cells Not detected Protein (IHC) HPA →
Esophagus Squamous epithelial cells Not detected Protein (IHC) HPA →
Heart muscle Cardiomyocytes Not detected Protein (IHC) HPA →
Lymph node Germinal center cells Not detected Protein (IHC) HPA →
Section 3

Advanced GOLM1 IHC Tips

Use the catalog antibody’s tissue IHC conditions as a starting point, then assess staining against GOLM1’s expected cell types and Golgi localisation.

What should I change if GOLM1 staining is weak after antigen retrieval?
Start with heat mediated retrieval in EDTA at pH 8.0 for paraffin sections (datasheet A02975-3). The selected tissue image used that retrieval before 2 μg/ml primary antibody overnight at 4°C, so reproduce those stated conditions before changing retrieval (datasheet A02975-3). Check whether positive glandular cells stain while adjacent tissue remains interpretable; stomach and prostate glandular cells are reported as high expressing controls (HPA tissue IHC). If staining remains weak, compare a second retrieval condition on serial sections, changing one variable at a time (standard IHC practice). Record tissue preservation alongside signal, because excessive heating can impair morphology (standard IHC practice).
Can I assume a particular fixative preserves GOLM1 staining best?
No target specific fixation sensitivity is established by the supplied evidence: the selected image identifies a paraffin section but does not state its fixative (datasheet A02975-3). Treat fixation history as an experimental variable, and record the fixative and duration for every specimen before comparing staining intensity (standard IHC practice). On serial sections, hold retrieval at EDTA pH 8.0 and primary antibody at 2 μg/ml while assessing specimens with known processing histories (datasheet A02975-3; standard IHC practice). Interpret a weak result against a concurrently processed positive tissue control, rather than attributing it to fixation from staining pattern alone (standard IHC practice).
Where should convincing GOLM1 chromogenic staining appear?
Expect a granular cytoplasmic pattern in tissue sections, consistent with the reported tissue staining profile (HPA tissue IHC). At the organelle level, GOLM1 localises to the early Golgi and cis-Golgi network membrane, so a compact perinuclear signal is plausible where cellular detail permits assessment (UniProt Q8NBJ4 localisation; HPA subcellular). Evaluate cell identity as carefully as compartment: glandular cells in stomach and prostate are reported high, whereas normal esophageal squamous epithelial cells are reported undetected (HPA tissue IHC). Diffuse nuclear colour or uniform staining across unrelated cell types warrants review of counterstain, detection controls, and section quality before assignment as GOLM1 (standard IHC practice; HPA tissue IHC).
How do topology and isoforms affect interpretation of a negative IHC result?
GOLM1 has 2 reported isoforms, but the supplied antibody caption does not identify the recognised epitope or establish isoform coverage (UniProt Q8NBJ4 isoforms; datasheet A02975-3). Its membrane segment spans residues 13–35, with residues 1–12 cytoplasmic and 36–401 lumenal; these positions cannot identify this antibody’s binding side without epitope data (UniProt Q8NBJ4 topology). Glycosylation is reported at residues 109, 144, and 398, but its effect on this antibody’s tissue staining is unestablished (UniProt Q8NBJ4 glycosylation). For an unexpected negative, verify retrieval and a positive tissue control first, then seek epitope and isoform documentation before making a biological claim (standard IHC practice).
How should I investigate an IHC localisation finding by multiplex IF?
Use IF as a separate validation experiment: the supplied tissue protocol documents chromogenic IHC on a paraffin section, with no IF fixation or permeabilisation conditions stated (datasheet A02975-3). Pair GOLM1 with an independently validated marker of the expected cell type, and assess whether its signal occupies the Golgi region within those cells (HPA subcellular; standard IF practice). Choose fluorophores after measuring tissue autofluorescence, reserving a well separated, bright channel for GOLM1 when background is high (standard IF practice). Plan permeabilisation around the actual antibody epitope: access to residues 1–12 differs from access to the lumenal 36–401 region, but this antibody’s epitope is unspecified (UniProt Q8NBJ4 topology; datasheet A02975-3).
How can I reduce diffuse brown background without losing GOLM1 signal?
First separate diffuse deposit from the expected granular cytoplasmic pattern by examining cell outlines and tissue morphology (HPA tissue IHC; standard IHC practice). The selected method used 10% goat serum blocking, a biotinylated secondary antibody, streptavidin–biotin detection, and DAB, so inspect primary omission and detection controls for nonspecific colour (datasheet A02975-3; standard IHC practice). Include a peroxidase block in the chromogenic workflow and check whether colour persists without primary antibody (standard IHC practice). If background remains, optimise washing and detection exposure on matched sections while retaining the documented 2 μg/ml primary condition as a reference (datasheet A02975-3; standard IHC practice).
How should I score GOLM1 when expression differs across cell types? ⚠ ANSWER MARKED FOR VERIFICATION
Define the scored compartment and cell population before reading slides, because the reported tissue pattern is granular cytoplasmic and expression varies by cell type (HPA tissue IHC). For glandular cells, record the percentage positive at each prespecified intensity and calculate an H-score as the sum of percentage times intensity, yielding 0–300 on a 0–3 scale (standard IHC practice). Alternatively, report percent positive cells; if counting positive cells per area, state density per mm² of viable target tissue (standard IHC practice). Normalise comparisons to eligible cells or viable target area, and keep retrieval, detection, counterstain, and scoring thresholds consistent across sections (standard IHC practice).
When is a strong GOLM1 signal likely to be artefactual?
A credible positive should follow the reported granular cytoplasmic pattern and the cell type being evaluated, with Golgi region enrichment when morphology allows (HPA tissue IHC; HPA subcellular). Review unexpected nuclear staining, section edge accentuation, and colour concentrated in necrotic material as possible staining artefacts before assigning them biological meaning (standard IHC practice). Test persistent brown colour with a primary omission control and adequate peroxidase blocking, since endogenous enzyme activity can contribute to chromogenic signal (standard IHC practice). Normal esophageal squamous cells are reported undetected, while the selected carcinoma image demonstrates staining under its stated IHC conditions; assess those distinct contexts separately (HPA tissue IHC; datasheet A02975-3).
Boster reagents

Best GOLM1 / Golgi membrane protein 1 IHC Antibodies

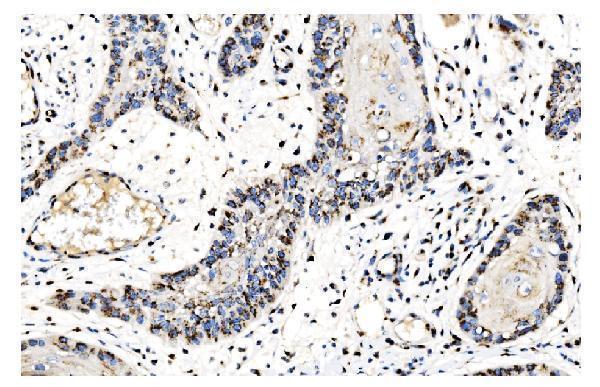
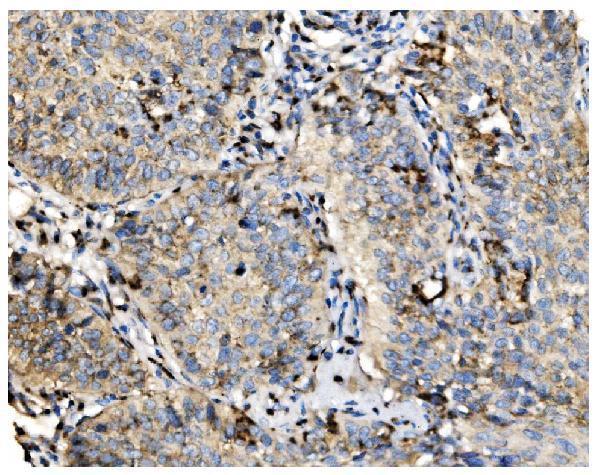
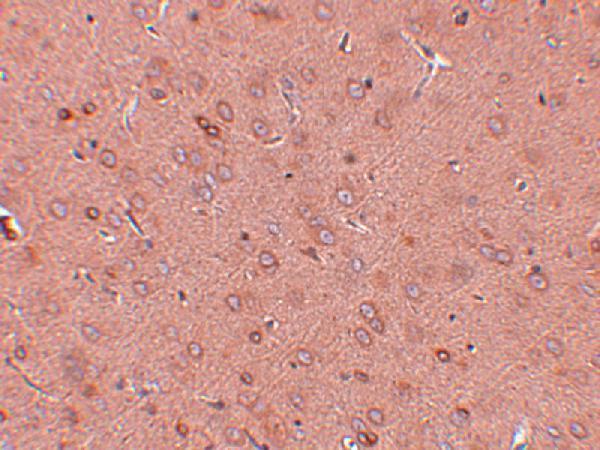
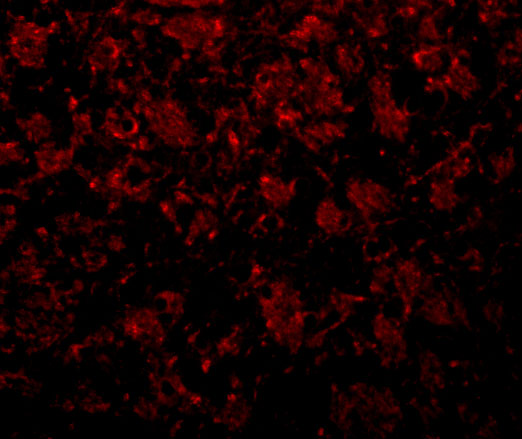
The catalog includes IHC images from human paraffin sections (A02975-3 image captions) and rat brain (A02975 image caption), plus IF images from human A431 cells and rat brain (catalog IF captions).

Real IHC data IHC analysis of GOLPH2/GOLM1 using anti-GOLPH2/GOLM1 antibody (A02975-3). GOLPH2/GOLM1 was detected in a paraffin-embedded section of human esophageal squamous carcinoma tissue. Heat mediated antigen retrieval was performed in EDTA buffer (pH 8.0, epitope retrieval solution). The tissue section was blocked with 10% goat serum. The tissue section was then incubated with 2 μg/ml rabbit anti-GOLPH2/GOLM1 Antibody (A02975-3) overnight at 4°C. Biotinylated goat anti-rabbit IgG was used as secondary antibody and incubated for 30 minutes at 37°C. The tissue section was developed using Strepavidin-Biotin-Complex (SABC) (Catalog # SA1022) with DAB as the chromogen.
Anti-GOLPH2/GOLM1 Antibody ®
Cat # A02975-3
Real IHC data Immunohistochemistry of GOLPH2 in rat brain tissue with GOLPH2 antibody at 2.5 μg/mL.
Anti-GOLPH2 GOLM1 Antibody
Cat # A02975

A02975-3 shows IHC in human paraffin sections and IF/ICC in A431 cells (A02975-3 image captions). A02975 shows IHC and IF in rat brain (A02975 image captions).

Which to pick: For human tissue IHC, choose A02975-3: its paraffin-section caption reports 2 μg/mL with EDTA retrieval at pH 8.0; the fixative is unreported (A02975-3 IHC caption). For human cell IF/ICC, A02975-3 has an A431 image at 5 μg/mL (A02975-3 IF caption); A02975 has a rat brain IF image at 20 μg/mL (A02975 IF caption). For rat tissue IHC, A02975 has a rat brain image at 2.5 μg/mL, though processing and fixative are unreported (A02975 IHC caption); both SKUs list human, mouse and rat reactivity, but neither reports clonality (catalog payload).

Each figure is that product's own IHC / IF validation image from its datasheet.

References

  1. UniProt Consortium. UniProt entry Q8NBJ4 (GOLM1_HUMAN, Golgi membrane protein 1).
  2. Human Protein Atlas. GOLM1 tissue IHC expression (reliability: Enhanced).
  3. Human Protein Atlas. GOLM1 subcellular location (ICC-IF): Localized to the Golgi apparatus..
  4. Human Protein Atlas. GOLM1 antibody validation summary (3 antibodies).
  5. Increased GOLM1 Expression Independently Predicts Unfavorable Overall Survival and Recurrence-Free Survival in Lung Adenocarcinoma. Cancer control : journal of the Moffitt Cancer Center 2018 — PMC6028180.
  6. Aberrant expression of GOLM1 protects ALK+ anaplastic large cell lymphoma from apoptosis by enhancing BCL-XL stability. Blood advances 2023 — PMC10388734.
  7. GOLM1 Promotes Epithelial-Mesenchymal Transition by Activating TGFβ1/Smad2 Signaling in Prostate Cancer. Technology in cancer research & treatment 2023 — PMC10071148.
  8. GOLM1 and FAM49B: Potential Biomarkers in HNSCC Based on Bioinformatics and Immunohistochemical Analysis. International journal of molecular sciences 2022 — PMC9737887.
  9. PubMed PMID:10831838 — UniProt-cited evidence.
  10. PubMed PMID:12975309 — UniProt-cited evidence.
  11. PubMed PMID:16303743 — UniProt-cited evidence.