This website uses cookies to ensure you get the best experience on our website.


- Table of Contents
Plan GRB10 chromogenic IHC-P using glandular cells and cardiomyocytes as strongly staining examples (HPA tissue IHC). Start the catalog antibody at 2–5 μg/mL (datasheet A01663-2) and compare with adipocytes, where staining was not detected (HPA tissue IHC).

Expected localisation, validated protocols, controls and antibodies — the at-a-glance facts below, then the full design guide.
| Expected localisation | Cytoplasmic in most tissues (HPA tissue IHC) | |
| Staining pattern | Cytoplasmic staining across most tissues (HPA tissue IHC) | |
| Antigen retrieval | EDTA pH 8.0 HIER, heat-mediated (datasheet A01663-2) | |
| Positive control | Appendix+4 more · see all | |
| Negative control | Adipose tissue |
| Fixation | Keep fixation consistent across sections (standard IHC practice; not target-specific) | |
| Caveat | Staining and RNA show medium consistency (HPA tissue IHC) | |
| Regulation | Expression regulation is unspecified (UniProt) | |
| Isoform / epitope | 4 isoforms; check epitope coverage (UniProt) |
The catalog antibody’s IHC-P protocol uses EDTA pH 8.0 retrieval (datasheet: A01663-2). Three published GRB10 IHC protocols provide tissue-specific comparisons (PMC11367874; PMC10449302; PMC4795681).
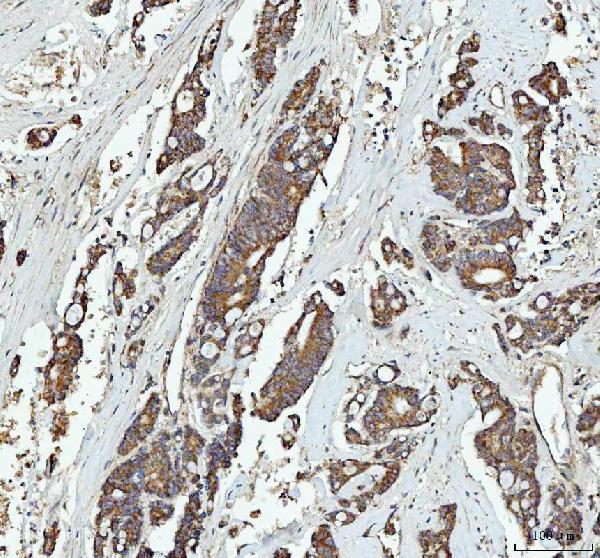
| Sample | Paraffin-embedded human colorectal adenocarcinoma tissue; fixative not specified (datasheet A01663-2) |
| Fixation | Image fixative and duration unreported (datasheet A01663-2); verify before use. |
| Sectioning | 4–5 µm sections on charged slides (standard) |
| Deparaffinisation | Xylene, graded ethanol series to water (standard) |
| Antigen retrieval | Heat retrieval: EDTA pH 8.0 (datasheet A01663-2); 20 min, 95–100 °C (standard) |
| Peroxidase block | 3% H2O2, 10 min, room temperature (standard) |
| Blocking | 10% goat serum (datasheet A01663-2) |
| Primary antibody | Rabbit anti-GRB10, 2-5μg/ml (datasheet A01663-2) |
| Primary incubation | Overnight at 4 °C (datasheet A01663-2) |
| Detection | HRP-conjugated secondary, DAB chromogen (datasheet A01663-2) |
| Counterstain | Hematoxylin, blue, dehydrate and mount (standard) |
| Expected result | GRB10-positive staining in glandular cells of appendix (HPA tissue IHC: High). HPA tissue profile: Cytoplasmic expression in most tissues. No signal in the no-primary control. |
In paraffin-section IHC, expect GRB10 mainly in the cytoplasm of many cell types, including strongly stained glandular cells, cardiomyocytes and neurons (HPA: tissue IHC). GRB10 has no transmembrane segment (UniProt Q13322 topology). HPA rates its IHC evidence Enhanced, while reporting medium consistency between staining and RNA expression (HPA: tissue IHC).
| Cytoplasmic staining in glandular cells of appendix, colon, duodenum, endometrium or gallbladder. | This matches the reported high staining in these cells (HPA: tissue IHC). Judge the named cells and their cytoplasm, rather than treating every stained structure in the section as equally informative. |
| Strong cytoplasmic staining in cardiomyocytes, cerebellar Purkinje cells or hippocampal neurons. | These are further reported high-staining cell populations (HPA: tissue IHC). Their presence can help assess a run, although HPA reports only medium consistency between antibody staining and RNA expression (HPA: tissue IHC). |
| Predominantly nuclear or sharply membrane-rimmed staining. | That distribution conflicts with the mainly cytoplasmic tissue profile (HPA: tissue IHC) and the absence of a transmembrane segment (UniProt Q13322 topology). Check whether the pattern persists after detection controls before assigning it to GRB10. |
| Strong adipocyte staining, especially when the expected glandular or neuronal cells are unstained. | HPA reports GRB10 as not detected in adipocytes (HPA: adipose tissue IHC). Consider cross-reactivity or endogenous detection activity; a single unexpected cell type does not identify which mechanism caused the signal. |
| Broad, fairly even chromogen over cells and surrounding tissue, or no signal in an HPA high-staining cell population. | Neither result demonstrates the expected cell-associated pattern (HPA: tissue IHC). Background calls for detection controls; absent signal calls for checks of tissue, antibody and staining workflow before a biological conclusion. |
| Cell and tissue choice | HPA reports high staining in several glandular, cardiac and neuronal populations, but low staining in oral and vaginal squamous cells and bone marrow hematopoietic cells (HPA: tissue IHC). Use a reported high population to assess detection. |
| Subcellular interpretation | GRB10 is annotated as cytoplasmic and lacks a transmembrane segment (UniProt Q13322). Its association with early endosomes during IGF1R internalization is described by similarity (UniProt Q13322), so puncta alone are not an IHC identity test. |
| Antibody evidence | IHC status is Enhanced for HPA027502 and Approved for CAB019423; HPA031818 has no listed IHC status (HPA: antibody validation). These statuses describe different evidence for the antibodies, not a guarantee for every section. |
| Isoforms and modified residues | UniProt lists four isoforms and multiple phosphorylated residues (UniProt Q13322). The payload gives no antibody epitope, so it cannot establish isoform coverage or a phosphorylation-dependent IHC pattern. |
| IF/ICC Q: Should vesicular fluorescence be expected? | A: HPA reports a supported main location in vesicles, with ICC-IF images from A-549, U-251MG and U2OS (HPA: subcellular). Interpret that observation in the separate IF/ICC guide; it supplies no IHC retrieval or dilution setting. |
| Situation | Likely cause | Next action |
|---|---|---|
| No stain in a reported high-staining population. | A failed detection step or unsuitable run conditions are possible; high staining is reported for colon glandular cells, among others (HPA: tissue IHC). | Check that the named cells are present, then review the antibody's IHC instructions, retrieval and detection controls. No GRB10-specific retrieval condition is supplied. |
| Only weak stain in oral or vaginal squamous cells. | Low staining is reported in those cells (HPA: tissue IHC), so this result alone gives a limited test of assay sensitivity. | Assess a reported high-staining population, such as appendix glandular cells (HPA: tissue IHC), within the same staining run where feasible. |
| Strong stain appears in adipocytes. | This conflicts with HPA's not-detected adipocyte result (HPA: adipose tissue IHC); cross-reactivity or endogenous detection activity is possible. | Inspect a no-primary control and compare cell boundaries and surrounding tissue. Treat the adipocyte signal as unresolved until the source is identified. |
| Nuclei dominate the stain. | A nuclear-dominant result disagrees with the cytoplasmic tissue profile (HPA: tissue IHC; UniProt Q13322 subcellular location). | Compare with a reported high-staining cell population and a no-primary control. Recheck scoring so nuclear counterstain is not mistaken for chromogen. |
| Chromogen coats many structures without clear cell boundaries. | Diffuse background can obscure the cell-associated cytoplasmic pattern (HPA: tissue IHC); the payload does not identify a GRB10-specific cause. | Inspect the no-primary control and review blocking, washes and detection steps as general IHC practice. Avoid scoring diffuse deposition as positive cells. |
| Two antibodies give different cell patterns. | HPA lists differing IHC validation statuses and reports medium staining-to-RNA consistency (HPA: antibody validation; tissue IHC). Discordance needs investigation. | Compare the same named cell populations and controls for each antibody. Report the disagreement instead of assigning an unsupported GRB10-specific pattern. |


Comprehensive Human Protein Atlas IHC scoring per tissue (reliability: Enhanced — Medium consistency between antibody staining and RNA expression data.). Rows are taken directly from the HPA tissue chart — click any row's HPA link to view the source.
| Tissue | Cell type | Level | Evidence | Source |
|---|---|---|---|---|
| Appendix | Glandular cells | High | Protein (IHC) | HPA → |
| Cerebellum | Purkinje cells | High | Protein (IHC) | HPA → |
| Colon | Glandular cells | High | Protein (IHC) | HPA → |
| Duodenum | Glandular cells | High | Protein (IHC) | HPA → |
| Endometrium | Glandular cells | High | Protein (IHC) | HPA → |
| Tissue | Cell type | Level | Evidence | Source |
|---|---|---|---|---|
| Adipose tissue | Adipocytes | Not detected | Protein (IHC) | HPA → |
Troubleshoot GRB10 staining in paraffin sections by checking retrieval, cytoplasmic localisation, cell type and controls against the available tissue evidence.
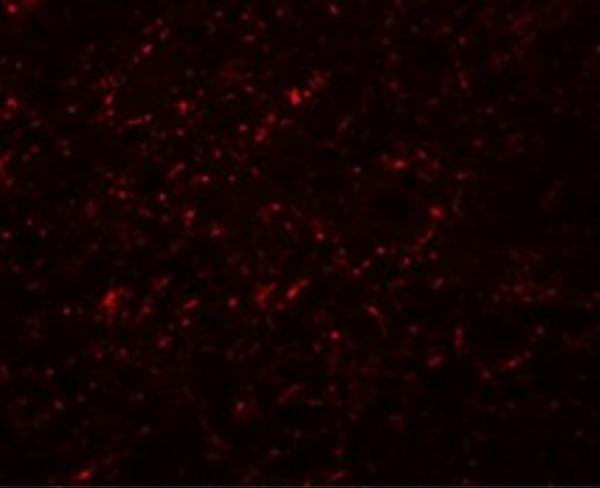
Anti-GRB10 antibodies have real IHC data from human tumor and mouse brain paraffin sections (A01663-2 image captions), plus IF data from rat brain cells (A01663 image caption).
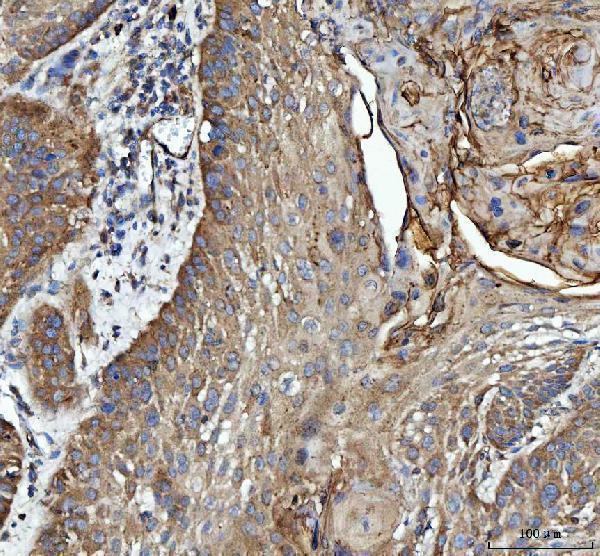
A01663-2 lists IHC and shows staining in human colorectal adenocarcinoma, laryngeal squamous cell carcinoma, and liver cancer paraffin sections, plus mouse brain paraffin sections (catalog applications; A01663-2 image captions). A01663 lists IF and shows staining in rat brain cells (catalog applications; A01663 image caption).
Which to pick: Choose A01663-2 for tissue IHC: its paraffin section images use heat retrieval in EDTA at pH 8.0 and 2 μg/ml primary antibody; the fixative is unreported (A01663-2 image captions). Choose A01663 for IF in cells, starting at 20 μg/mL based on its rat brain cell image; no ICC result is reported (A01663 image caption; catalog applications). For cross-species selection, A01663-2 lists human, monkey, mouse, and rat reactivity, while A01663 lists human, mouse, and rat; clonality is unreported for both (catalog reactivity; catalog clone fields).