This website uses cookies to ensure you get the best experience on our website.


- Table of Contents
Plan paraffin-section HSD11B2 IHC around cytoplasmic staining in kidney collecting ducts and gastrointestinal cell subsets (HPA tissue IHC). Start the catalog antibody RP1094 at 0.5–1 μg/ml and compare cell-level staining with controls (datasheet: RP1094; standard IHC practice).

Expected localisation, validated protocols, controls and antibodies — the at-a-glance facts below, then the full design guide.
| Expected localisation | Cytoplasmic staining in select tissue cells (HPA tissue IHC) | |
| Staining pattern | Cytoplasmic signal in renal tubules and GI glandular cells (HPA tissue IHC) | |
| Antigen retrieval | EDTA pH 8.0 HIER, heat-mediated (datasheet RP1094) | |
| Positive control | Appendix+4 more · see all | |
| Negative control | Adipose tissue+4 more · see all |
| Fixation | Matched tissue-IHC evidence does not establish the fixation claim. Validate the specimen-specific method before use. (selected-SKU IHC image RP1094) | |
| Caveat | Restricted positive cell types can be missed in bulk scoring (HPA tissue IHC) | |
| Regulation | Tissue-dependent expression (UniProt) | |
| Isoform / epitope | 0 annotated isoforms; one 1–405 chain (UniProt) |
The catalog antibody protocol is paired with published HSD11B2 IHC methods for dog placenta and colorectal adenoma and normal mucosa (PMC12561314; PMC9832797).
| Sample | Paraffin-embedded Mouse Pancreas tissue; fixative not specified (datasheet RP1094) |
| Fixation | Image fixative and duration unreported (datasheet RP1094); verify before use. |
| Sectioning | 4–5 µm sections on charged slides (standard) |
| Deparaffinisation | Xylene, graded ethanol series to water (standard) |
| Antigen retrieval | Heat retrieval: EDTA pH 8.0 (datasheet RP1094); 20 min, 95–100 °C (standard) |
| Peroxidase block | 3% H2O2, 10 min, room temperature (standard) |
| Blocking | 10% goat serum (datasheet RP1094) |
| Primary antibody | Rabbit anti-HSD11B2, 0.5-1μg/ml (datasheet RP1094) |
| Primary incubation | Overnight at 4 °C (datasheet RP1094) |
| Detection | HRP-conjugated secondary, DAB chromogen (datasheet RP1094) |
| Counterstain | Hematoxylin, blue, dehydrate and mount (standard) |
| Expected result | HSD11B2-positive staining in endocrine cells of appendix (HPA tissue IHC: High). HPA tissue profile: Cytoplasmic expression in few tissues, including cells in renal tubules and glandular cells in gastrointestinal tract and salivary gland. No signal in the no-primary control. |
HSD11B2 is associated with microsomes and the endoplasmic reticulum, with no annotated transmembrane segment (UniProt P80365 topology). In paraffin-section IHC, expect cytoplasmic staining in selected cells, especially kidney collecting ducts, intestinal endocrine cells, duodenal goblet cells, and placental syncytiotrophoblast cell bodies (HPA tissue IHC: High). The tissue pattern has Enhanced reliability, reflecting agreement between staining and RNA data (HPA tissue IHC: Enhanced).
| Distinct cytoplasmic staining in kidney collecting ducts, with nearby cells less conspicuous. | This fits a strong positive result: collecting ducts are rated High, while HPA describes cytoplasmic expression in only a few tissues (HPA tissue IHC: High; HPA tissue profile). Judge the named cells separately from the overall kidney section; uniform staining throughout the section would need scrutiny. |
| Predominantly nuclear or sharply cell-surface staining, without a convincing cytoplasmic component. | Treat this as a compartment mismatch. UniProt places HSD11B2 in microsomes and endoplasmic reticulum, and HPA reports cytoplasmic tissue staining (UniProt P80365 subcellular location; HPA tissue profile). Check morphology and controls before interpreting the signal as target-specific. |
| Strong signal in a cell population listed as not detected, such as bronchial respiratory epithelium. | This conflicts with that cell-level HPA observation (HPA tissue IHC: Bronchus, Not detected). Consider antibody cross-reactivity or endogenous chromogenic detection activity; compare the stained section with an appropriate negative detection control (standard IHC practice). |
| Weak color spread across cells, extracellular spaces, or much of the section. | A diffuse pattern does not match HPA's selective cytoplasmic profile (HPA tissue profile). Assess background using a control that omits the primary antibody, then review blocking, antibody concentration, washing, and chromogen development (standard IHC practice). |
| No convincing signal in kidney collecting ducts or another documented High population. | A blank known-positive population makes this run difficult to interpret, because those cells show High staining in the HPA record (HPA tissue IHC: Kidney; Placenta). Check that the expected cells are present, then review the antibody's validated IHC-P conditions and the detection controls (standard IHC practice). |
| Which cells provide the clearest tissue check? | Kidney collecting ducts, placental syncytiotrophoblast cell bodies, duodenal goblet cells, and endocrine cells in appendix, colon, rectum, and small intestine are rated High (HPA tissue IHC). Select a control whose named cell population is visible; a tissue name alone does not identify every cell as positive. |
| How broadly should staining be expected? | HPA describes cytoplasmic expression in few tissues and rates endometrial stromal cells Medium, while several listed cell populations are Not detected (HPA tissue IHC). UniProt reports expression across additional tissues, but that statement does not assign an IHC intensity to each cell type (UniProt P80365 tissue specificity). |
| How much confidence does antibody validation provide? | HPA rates tissue IHC reliability Enhanced and lists HPA042186, HPA056385, and CAB032443 as IHC Enhanced (HPA tissue IHC; HPA antibodies). This supports the reported pattern, but a new section still needs its own staining and detection controls (standard IHC practice). |
| Does ICC-IF imply the same visual pattern as tissue IHC? | In ICC-IF, HPA reports supported vesicle localization and images from CACO-2 and RT-4 (HPA subcellular ICC-IF). For paraffin-section IHC, use the tissue record's cytoplasmic description; the ICC-IF observation does not specify an IHC staining intensity or an IHC protocol. |
| Situation | Likely cause | Next action |
|---|---|---|
| The known-positive kidney section appears negative. | The expected collecting-duct cells may be absent from the viewed area, or the staining run may have failed (HPA tissue IHC: Kidney, High; standard IHC practice). | Confirm collecting ducts by morphology; check the IHC-validated antibody's stated conditions and the detection control before calling the sample negative (standard IHC practice). |
| Nuclei carry the strongest signal. | This disagrees with the cytoplasmic tissue profile and microsomal/endoplasmic-reticulum assignment (HPA tissue profile; UniProt P80365 subcellular location). | Compare with a positive tissue and a primary-omission control; interpret persistent nuclear-only staining cautiously (standard IHC practice). |
| A HPA Not detected cell population stains strongly. | Cross-reactivity or endogenous chromogenic detection activity is possible; HPA's Not detected designation applies to the specified cells (HPA tissue IHC; standard IHC practice). | Check a primary-omission control and apply the detection system's endogenous-activity control as appropriate (standard IHC practice). |
| Color is diffuse across the section. | Nonspecific background can arise during blocking, antibody incubation, washing, or chromogen development (standard IHC practice). | Compare with a primary-omission control and review those steps using the antibody's IHC-P instructions (standard IHC practice). |
| A positive tissue shows only faint staining. | The selected cells may have a lower reported level, or the run may be underdeveloped (HPA tissue IHC: Endometrial stroma, Medium; standard IHC practice). | Verify the cell type and compare it with a documented High population on a successfully stained control section (HPA tissue IHC; standard IHC practice). |
| ICC-IF looks punctate while IHC looks broadly cytoplasmic. | HPA describes supported vesicles in ICC-IF and cytoplasmic staining in tissue IHC; these are observations from different preparations (HPA subcellular ICC-IF; HPA tissue profile). | Evaluate each result against its own HPA localization record and controls; do not require identical visual texture across the two applications (standard IHC/IF practice). |



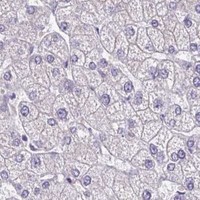
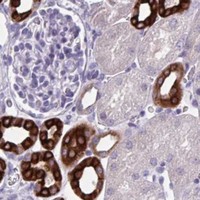


Comprehensive Human Protein Atlas IHC scoring per tissue (reliability: Enhanced — High consistency between antibody staining and RNA expression data.). Rows are taken directly from the HPA tissue chart — click any row's HPA link to view the source.
| Tissue | Cell type | Level | Evidence | Source |
|---|---|---|---|---|
| Appendix | Endocrine cells | High | Protein (IHC) | HPA → |
| Colon | Endocrine cells | High | Protein (IHC) | HPA → |
| Duodenum | Goblet cells | High | Protein (IHC) | HPA → |
| Kidney | Collecting ducts | High | Protein (IHC) | HPA → |
| Placenta | Syncytiotrophoblasts - cell body | High | Protein (IHC) | HPA → |
| Tissue | Cell type | Level | Evidence | Source |
|---|---|---|---|---|
| Adipose tissue | Adipocytes | Not detected | Protein (IHC) | HPA → |
| Bone marrow | Hematopoietic cells | Not detected | Protein (IHC) | HPA → |
| Breast | Adipocytes | Not detected | Protein (IHC) | HPA → |
| Bronchus | Respiratory epithelial cells | Not detected | Protein (IHC) | HPA → |
| Caudate | Glial cells | Not detected | Protein (IHC) | HPA → |
Troubleshoot HSD11B2 staining in paraffin sections by checking retrieval, cell identity, compartment, controls, and scoring before interpreting chromogenic signal.
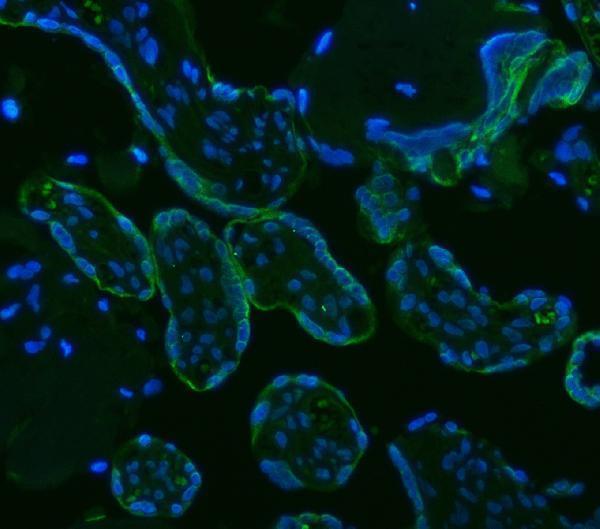
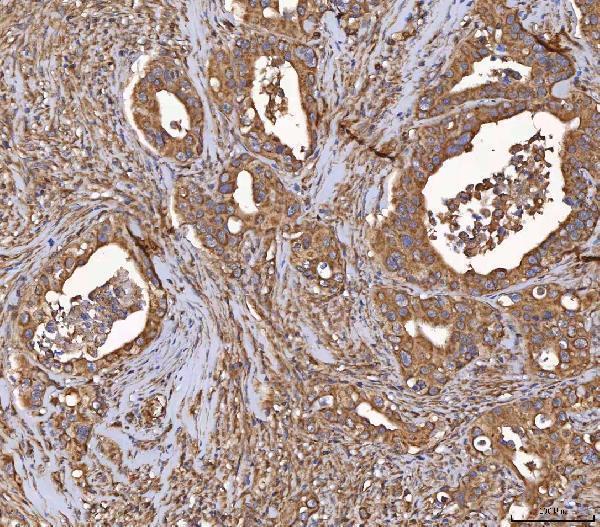
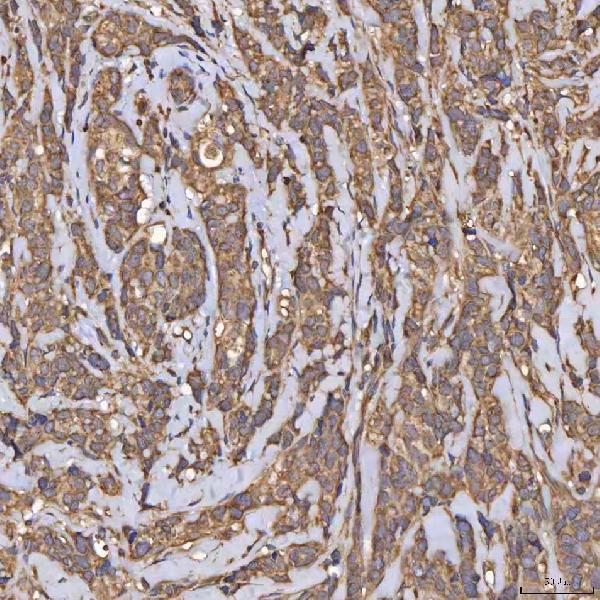
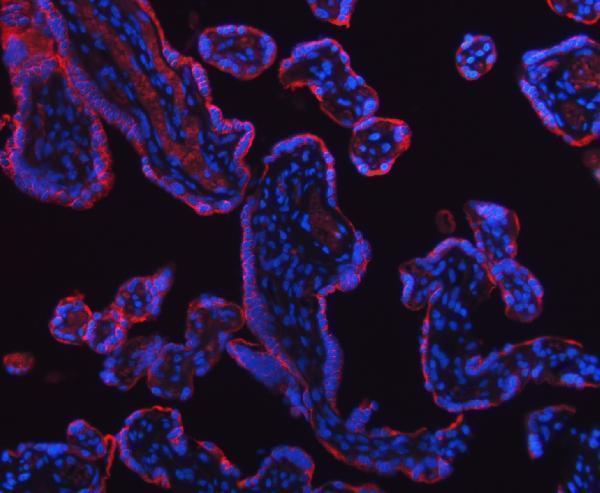
Anti-HSD11B2 antibodies have IHC images from human placenta, colon, cancers, and mouse and rat pancreas; both have IF images from human placenta (catalog image captions).
RP1094 is listed for human, mouse, and rat IHC and IF, with paraffin-section IHC images from human placenta and mouse and rat pancreas (RP1094 applications, reactivity, and IHC captions). A01613 is listed for human IHC and IF, with paraffin-section IHC images from human colon, appendix cancer, breast cancer, and endometrial cancer (A01613 applications, reactivity, and IHC captions).
Which to pick: For human tissue IHC, choose A01613 when its human paraffin-section examples fit the sample; its listed IHC concentration is 2–5 μg/ml (A01613 IHC captions; catalog dilution). Choose RP1094 for cross-species tissue IHC: its paraffin-section captions show human, mouse, and rat samples, and its listed IHC concentration is 0.5–1 μg/ml (RP1094 IHC captions; catalog dilution). For IF, both have human placenta section images at 5 μg/ml; ICC validation and fixation method are unreported in these captions (A01613 and RP1094 IF and IHC captions).